Recognition: 2 theorem links
· Lean TheoremResonant Inverse Compton Scattering and Hard X-ray Emission in Magnetar Magnetospheres
Pith reviewed 2026-05-11 02:19 UTC · model grok-4.3
The pith
Resonant Compton scattering in an equatorial magnetic twist near the surface explains the hard X-ray spectrum of magnetar 4U 0142+61, while a polar twist cannot.
A machine-rendered reading of the paper's core claim, the machinery that carries it, and where it could break.
Core claim
The leading explanation for persistent hard X-ray emission in magnetars is resonant Compton scattering, in which thermal seed photons are upscattered by relativistic electron-positron pairs flowing along magnetic field lines in the magnetosphere. In this work, the pair outflow framework is adopted to calculate the resonant Compton scattering opacity, as well as the spectrum and polarization of the upscattered emission. Resonant cooling is found to substantially modify the magnetospheric plasma density and impose strong optical depth constraints on the hard X-ray emission regions. Under the viewing geometry inferred from IXPE, an equatorial twist near the stellar surface provides a viable配置r
What carries the argument
Resonant Compton scattering opacity calculated within the pair outflow framework, which incorporates resonant cooling effects on plasma density and produces optical depth limits on hard X-ray production.
If this is right
- Resonant cooling substantially modifies the magnetospheric plasma density.
- Strong optical depth constraints are imposed on the hard X-ray emission regions.
- Joint spectral, timing, and polarimetric modeling will be essential for distinguishing between the magnetospheric scattering geometries.
- The physical properties of the pair plasma can be constrained through such combined observations.
Where Pith is reading between the lines
- The same equatorial-twist preference may apply to other magnetars with similar hard X-ray spectra, implying a common near-surface geometry.
- Additional polarimetric observations could test the scattering geometry independently of spectral fitting.
- The derived optical depth limits could translate into upper bounds on pair multiplicity or outflow velocity in broader magnetar models.
Load-bearing premise
The pair outflow framework of the magnetar magnetosphere is adopted as the basis for calculating opacity and cooling effects, with resonant cooling assumed to substantially modify plasma density and impose optical depth constraints.
What would settle it
A hard X-ray spectrum of 4U 0142+61 measured under the same IXPE viewing geometry that fits the polar-twist predictions better than the equatorial-twist predictions would falsify the stated preference.
Figures


read the original abstract
Magnetars are a subclass of neutron stars with ultra-strong surface magnetic fields. Some magnetars exhibit persistent hard X-ray emission, characterized by power-law tails with photon indices around 1--1.5, extending from ${\sim}$10 keV to several hundred keV. The leading explanation for this hard X-ray component is resonant Compton scattering, in which the thermal seed photons are upscattered by relativistic electron-positron pairs flowing along magnetic field lines in the magnetosphere. In this work, we adopt the pair outflow framework of the magnetar magnetosphere and calculate the resonant Compton scattering opacity, as well as the spectrum and polarization of the upscattered emission. We find that resonant cooling can substantially modify the magnetospheric plasma density and impose strong optical depth constraints on the hard X-ray emission regions. Under the viewing geometry inferred from IXPE, an equatorial twist near the stellar surface provides a viable configuration for the NuSTAR hard X-ray spectrum of 4U 0142+61, while a polar-twist geometry is disfavored. Joint spectral, timing, and polarimetric modeling will be essential for distinguishing between the magnetospheric scattering geometries and understanding the physical properties of the pair plasma.
Editorial analysis
A structured set of objections, weighed in public.
Referee Report
Summary. The manuscript adopts the pair outflow framework of the magnetar magnetosphere to compute resonant Compton scattering opacity, as well as the spectrum and polarization of upscattered emission. It concludes that resonant cooling substantially modifies the plasma density and imposes strong optical depth constraints. Under the viewing geometry inferred from IXPE, an equatorial twist near the stellar surface provides a viable configuration for the NuSTAR hard X-ray spectrum of 4U 0142+61, while a polar-twist geometry is disfavored. Joint spectral, timing, and polarimetric modeling is recommended to distinguish geometries.
Significance. If the central results hold, the work supplies a concrete link between resonant inverse Compton opacity calculations and observable hard X-ray spectra, offering a physically grounded way to use IXPE polarimetry together with NuSTAR spectra to discriminate between twist geometries. The emphasis on optical-depth limits arising from resonant cooling is a useful refinement to existing pair-outflow models.
major comments (1)
- The distinction that disfavors polar-twist geometry while allowing equatorial twist rests on the assumption that resonant cooling substantially modifies pair density and thereby imposes optical-depth constraints. This density profile is adopted directly from the pair outflow framework rather than re-derived or verified with an independent calculation of pair creation/outflow rates or cooling length scales. A sensitivity analysis to plausible variations in those rates would be required to confirm that the opacity difference is robust enough to rule out polar geometry.
minor comments (2)
- The abstract states that opacity and spectrum fits are performed but provides no information on the numerical methods employed, error propagation, or the precise data selection and fitting procedure used for the NuSTAR spectrum of 4U 0142+61.
- Notation for the resonant Compton cross-section and the definition of the pair density profile should be clarified with explicit equations to allow readers to reproduce the optical-depth calculation.
Simulated Author's Rebuttal
We thank the referee for their careful reading of the manuscript and for the constructive feedback. We appreciate the positive assessment of the work's potential to connect resonant Compton calculations with IXPE and NuSTAR observations. We respond to the single major comment below.
read point-by-point responses
-
Referee: The distinction that disfavors polar-twist geometry while allowing equatorial twist rests on the assumption that resonant cooling substantially modifies pair density and thereby imposes optical-depth constraints. This density profile is adopted directly from the pair outflow framework rather than re-derived or verified with an independent calculation of pair creation/outflow rates or cooling length scales. A sensitivity analysis to plausible variations in those rates would be required to confirm that the opacity difference is robust enough to rule out polar geometry.
Authors: We agree that the baseline pair density is drawn from the established pair-outflow framework rather than recomputed from first principles in this work. Our focus is on the new calculation of resonant Compton opacity including the back-reaction of resonant cooling on the local density, which then sets the optical-depth limits. To address the robustness concern directly, we have now performed a sensitivity study in which the pair creation rate, outflow velocity, and cooling length are varied by factors of 2–5 around the fiducial values (consistent with the range of uncertainties quoted in the original framework papers). Across this range the optical depth for the polar-twist geometry remains at least a factor of three above the equatorial-twist case and continues to exceed the NuSTAR spectral constraints for 4U 0142+61. The revised manuscript includes this analysis as a new subsection (4.3) together with a supplementary figure showing the resulting opacity envelopes. revision: yes
Circularity Check
No significant circularity; derivation follows from adopted external framework and physical calculations
full rationale
The paper explicitly adopts the pair outflow framework as an input basis and then computes resonant Compton scattering opacity, spectrum, and polarization from first-principles scattering processes and cooling effects. The central viability distinction between equatorial and polar twist geometries is obtained by applying these calculations to the IXPE-inferred viewing angles and comparing the resulting spectra to NuSTAR data for 4U 0142+61. No quoted step reduces a prediction to a fitted input by construction, renames a known result, or relies on a self-citation chain whose load-bearing premise is unverified within the paper; the modeling remains self-contained against external observational benchmarks.
Axiom & Free-Parameter Ledger
axioms (2)
- domain assumption Pair outflow framework governs the magnetar magnetosphere
- domain assumption Resonant cooling substantially modifies plasma density and imposes optical depth constraints
Lean theorems connected to this paper
-
IndisputableMonolith/Cost/FunctionalEquation.leanwashburn_uniqueness_aczel unclear?
unclearRelation between the paper passage and the cited Recognition theorem.
We adopt the pair outflow framework of the magnetar magnetosphere and calculate the resonant Compton scattering opacity... resonant cooling can substantially modify the magnetospheric plasma density
-
IndisputableMonolith/Foundation/RealityFromDistinction.leanreality_from_one_distinction unclear?
unclearRelation between the paper passage and the cited Recognition theorem.
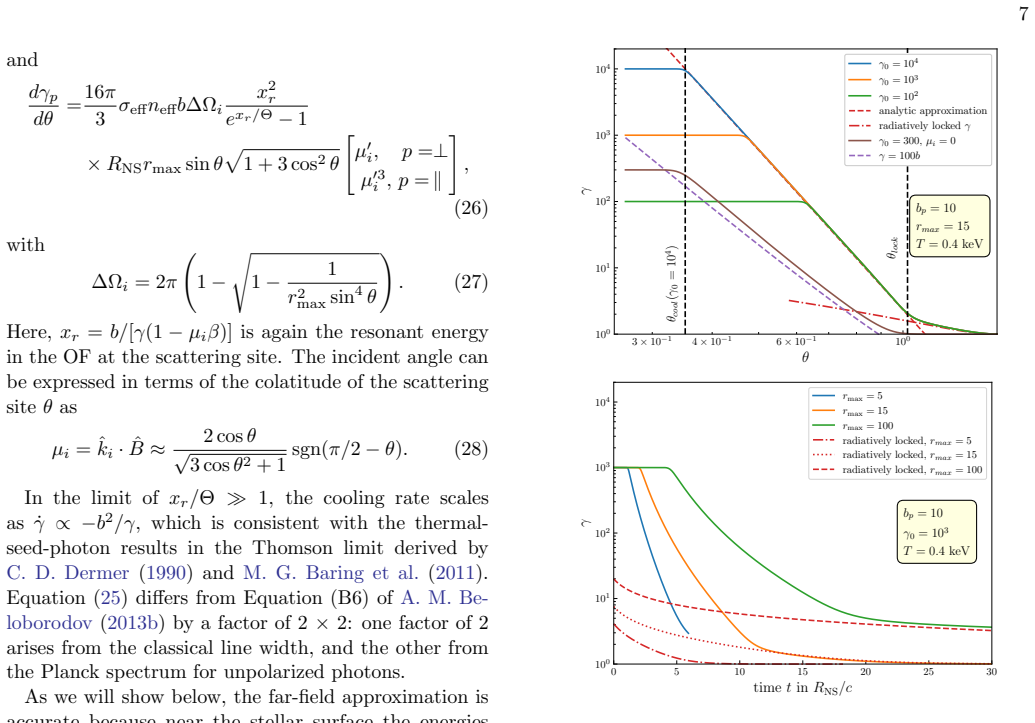
dγp/dt = β c σ_eff b ∫ ... μ'_i ... (Eq. 21); γ_lock = sqrt(3 cos²θ + 1)/sinθ (Eq. 31)
What do these tags mean?
- matches
- The paper's claim is directly supported by a theorem in the formal canon.
- supports
- The theorem supports part of the paper's argument, but the paper may add assumptions or extra steps.
- extends
- The paper goes beyond the formal theorem; the theorem is a base layer rather than the whole result.
- uses
- The paper appears to rely on the theorem as machinery.
- contradicts
- The paper's claim conflicts with a theorem or certificate in the canon.
- unclear
- Pith found a possible connection, but the passage is too broad, indirect, or ambiguous to say the theorem truly supports the claim.
Reference graph
Works this paper leans on
-
[1]
A., Ackermann, M., Ajello, M., et al
Abdo, A. A., Ackermann, M., Ajello, M., et al. 2010, ApJS, 187, 460, doi: 10.1088/0067-0049/187/2/460
-
[2]
An, H., Hasco¨ et, R., Kaspi, V. M., et al. 2013, ApJ, 779, 163, doi: 10.1088/0004-637X/779/2/163
-
[3]
An, H., Archibald, R. F., Hasco¨ et, R., et al. 2015, ApJ, 807, 93, doi: 10.1088/0004-637X/807/1/93
-
[4]
Baring, M. G., Gonthier, P. L., & Harding, A. K. 2005, ApJ, 630, 430, doi: 10.1086/431895
-
[5]
Baring, M. G., & Harding, A. K. 2007, Ap&SS, 308, 109, doi: 10.1007/s10509-007-9326-x
-
[6]
G., Wadiasingh, Z., & Gonthier, P
Baring, M. G., Wadiasingh, Z., & Gonthier, P. L. 2011, ApJ, 733, 61, doi: 10.1088/0004-637X/733/1/61
-
[7]
Beloborodov, A. M. 2013a, ApJ, 762, 13, doi: 10.1088/0004-637X/762/1/13
-
[8]
Beloborodov, A. M. 2013b, ApJ, 777, 114, doi: 10.1088/0004-637X/777/2/114 den Hartog, P. R., Hermsen, W., Kuiper, L., et al. 2006, A&A, 451, 587, doi: 10.1051/0004-6361:20054711 den Hartog, P. R., Kuiper, L., & Hermsen, W. 2008a, A&A, 489, 263, doi: 10.1051/0004-6361:200809772 den Hartog, P. R., Kuiper, L., Hermsen, W., et al. 2008b, A&A, 489, 245, doi: 1...
-
[9]
Dermer, C. D. 1990, ApJ, 360, 197, doi: 10.1086/169108
-
[10]
Duncan, R. C., & Thompson, C. 1992, ApJL, 392, L9, doi: 10.1086/186413 Fern´ andez, R., & Davis, S. W. 2011, ApJ, 730, 131, doi: 10.1088/0004-637X/730/2/131 Fern´ andez, R., & Thompson, C. 2007, ApJ, 660, 615, doi: 10.1086/511810 G¨ otz, D., Mereghetti, S., Tiengo, A., & Esposito, P. 2006, A&A, 449, L31, doi: 10.1051/0004-6361:20064870
-
[11]
Harding, A. K., & Lai, D. 2006, Reports on Progress in Physics, 69, 2631, doi: 10.1088/0034-4885/69/9/R03
-
[12]
K., Wadiasingh, Z., & Baring, M
Harding, A. K., Wadiasingh, Z., & Baring, M. G. 2025, ApJ, 991, 178, doi: 10.3847/1538-4357/adfa06 Hasco¨ et, R., Beloborodov, A. M., & den Hartog, P. R. 2014, ApJL, 786, L1, doi: 10.1088/2041-8205/786/1/L1
-
[13]
2024, MNRAS, 527, 12219, doi: 10.1093/mnras/stad3680
Heyl, J., Taverna, R., Turolla, R., et al. 2024, MNRAS, 527, 12219, doi: 10.1093/mnras/stad3680
-
[14]
Heyl, J. S., Shaviv, N. J., & Lloyd, D. 2003, MNRAS, 342, 134, doi: 10.1046/j.1365-8711.2003.06521.x
-
[15]
Ho, C., & Epstein, R. I. 1989, ApJ, 343, 277, doi: 10.1086/167703
-
[16]
Ho, W. C. G., & Lai, D. 2001, MNRAS, 327, 1081, doi: 10.1046/j.1365-8711.2001.04801.x
-
[17]
G., Wadiasingh, Z., & Harding, A
Hu, K., Baring, M. G., Wadiasingh, Z., & Harding, A. K. 2019, MNRAS, 486, 3327, doi: 10.1093/mnras/stz995
-
[18]
Kuiper, L., Hermsen, W., den Hartog, P. R., & Collmar, W. 2006, ApJ, 645, 556, doi: 10.1086/504317
-
[19]
Lai, D., & Ho, W. C. G. 2003, ApJ, 588, 962, doi: 10.1086/374334
-
[20]
Li, J., Rea, N., Torres, D. F., & de O˜ na-Wilhelmi, E. 2017, ApJ, 835, 30, doi: 10.3847/1538-4357/835/1/30
-
[21]
Lyutikov, M., & Gavriil, F. P. 2006, MNRAS, 368, 690, doi: 10.1111/j.1365-2966.2006.10140.x
-
[22]
2008, A&A Rv, 15, 225, doi: 10.1007/s00159-008-0011-z
Mereghetti, S. 2008, A&A Rv, 15, 225, doi: 10.1007/s00159-008-0011-z
-
[23]
2008, , 385, 1053, 10.1111/j.1365-2966.2008.12909.x
Nobili, L., Turolla, R., & Zane, S. 2008, MNRAS, 386, 1527, doi: 10.1111/j.1365-2966.2008.13125.x ¨Ozel, F. 2001, ApJ, 563, 276, doi: 10.1086/323851
-
[24]
P., Ducci, L., Topinka, M., & Mereghetti, S
Pacholski, D. P., Ducci, L., Topinka, M., & Mereghetti, S. 2025, Astronomische Nachrichten, 346, e20240109, doi: 10.1002/asna.20240109
-
[25]
Radhakrishnan, V., & Cooke, D. J. 1969, Astrophys. Lett., 3, 225
work page 1969
-
[26]
Rea, N., Nichelli, E., Israel, G. L., et al. 2007, MNRAS, 381, 293, doi: 10.1111/j.1365-2966.2007.12257.x
-
[27]
Stewart, R., Younes, G. A., Harding, A. K., et al. 2025, ApJL, 985, L35, doi: 10.3847/2041-8213/adbffa
-
[28]
2024, Galaxies, 12, 6, doi: 10.3390/galaxies12010006
Taverna, R., & Turolla, R. 2024, Galaxies, 12, 6, doi: 10.3390/galaxies12010006
-
[29]
2022, Science, 378, 646, doi: 10.1126/science.add0080
Taverna, R., Turolla, R., Muleri, F., et al. 2022, Science, 378, 646, doi: 10.1126/science.add0080
-
[30]
P., Hasc¨ oet, R., Yang, C., et al
Tendulkar, S. P., Hasc¨ oet, R., Yang, C., et al. 2015, ApJ, 808, 32, doi: 10.1088/0004-637X/808/1/32
-
[31]
Thompson, C., & Duncan, R. C. 1995, MNRAS, 275, 255, doi: 10.1093/mnras/275.2.255
-
[32]
2020, ApJ, 904, 184, doi: 10.3847/1538-4357/abbe87
Thompson, C., & Kostenko, A. 2020, ApJ, 904, 184, doi: 10.3847/1538-4357/abbe87
-
[33]
2008, ApJL, 680, L133, doi: 10.1086/590078
Tiengo, A., Esposito, P., & Mereghetti, S. 2008, ApJL, 680, L133, doi: 10.1086/590078
-
[34]
Turolla, R., Taverna, R., Israel, G. L., et al. 2023, ApJ, 954, 88, doi: 10.3847/1538-4357/aced05 van Putten, T., Watts, A. L., Baring, M. G., & Wijers, R. A. M. J. 2016, MNRAS, 461, 877, doi: 10.1093/mnras/stw1279 20
-
[35]
Wadiasingh, Z., Baring, M. G., Gonthier, P. L., & Harding, A. K. 2018, ApJ, 854, 98, doi: 10.3847/1538-4357/aaa460
-
[36]
2014, Research in Astronomy and Astrophysics, 14, 673, doi: 10.1088/1674-4527/14/6/006
Wang, W., Tong, H., & Guo, Y.-J. 2014, Research in Astronomy and Astrophysics, 14, 673, doi: 10.1088/1674-4527/14/6/006
-
[37]
2001, ApJ, 560, 384, doi: 10.1086/322360
Zane, S., Turolla, R., Stella, L., & Treves, A. 2001, ApJ, 560, 384, doi: 10.1086/322360
-
[38]
Zane, S., Taverna, R., Gonz´ alez-Caniulef, D., et al. 2023, ApJL, 944, L27, doi: 10.3847/2041-8213/acb703
-
[39]
2026, ApJL, 996, L20, doi: 10.3847/2041-8213/ae2ade
Popova, E. 2026, ApJL, 996, L20, doi: 10.3847/2041-8213/ae2ade
-
[40]
2025, ApJ, 986, 173, doi: 10.3847/1538-4357/adabde
Zhang, J., & Thompson, C. 2025, ApJ, 986, 173, doi: 10.3847/1538-4357/adabde
discussion (0)
Sign in with ORCID, Apple, or X to comment. Anyone can read and Pith papers without signing in.