Recognition: no theorem link
Probabilistic denoising for reliable signal extraction in spectroscopy
Pith reviewed 2026-05-11 02:32 UTC · model grok-4.3
The pith
A probabilistic denoising framework recovers spectral features and calibrated uncertainties from extremely low-count spectroscopy data.
A machine-rendered reading of the paper's core claim, the machinery that carries it, and where it could break.
Core claim
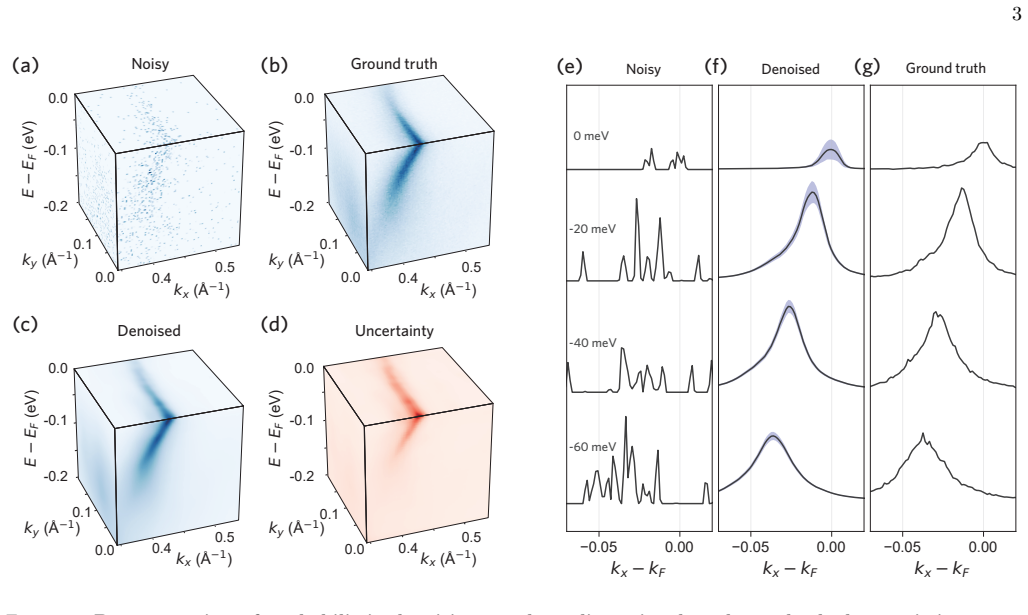
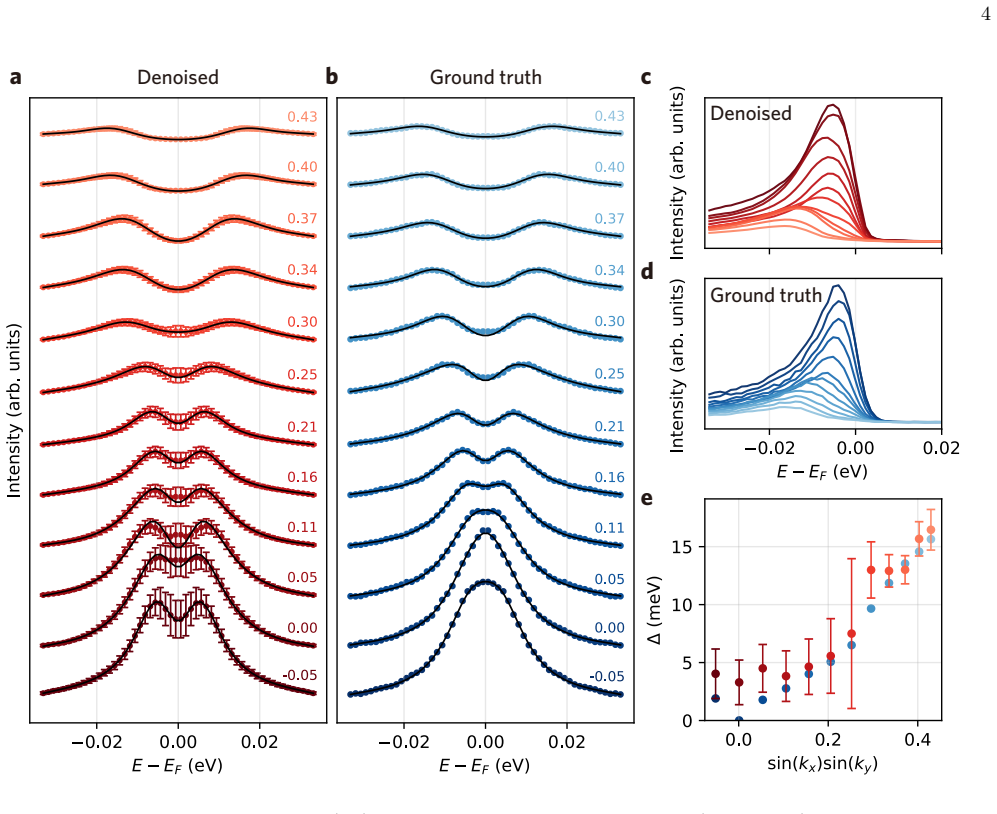
The paper claims that a probabilistic denoising neural network simultaneously produces a denoised signal map and element-wise predictive uncertainties from input data dominated by Poisson noise. When applied to three-dimensional angle-resolved photoemission spectroscopy of cuprate superconductors, the network recovers the main spectral features even when the average count is only 0.02 electrons per voxel. These uncertainties can be propagated through standard fitting routines for the superconducting gap, resulting in extracted parameter values that include scientifically usable error bars. The framework is additionally shown to work on two-dimensional X-ray diffraction data, supporting its角色
What carries the argument
The probabilistic denoising neural network that outputs both a denoised signal and per-element uncertainty estimates from noisy observations.
If this is right
- The model recovers the main spectral features of a cuprate superconductor from Poisson-distributed noise at an average of 0.02 electrons per voxel.
- Predicted uncertainties can be propagated into superconducting gap fitting to obtain quantitative parameters with meaningful error bars.
- The same framework successfully processes two-dimensional X-ray diffraction data.
- Uncertainty-aware deep learning can serve as a rigorous component of scientific data analysis pipelines rather than only a visualization aid.
Where Pith is reading between the lines
- If the uncertainties remain accurate, similar data quality could be reached with shorter measurement times or lower incident beam intensities.
- The approach could transfer to other photon-limited experiments governed by Poisson statistics, such as fluorescence mapping or low-dose imaging.
- Calibration could be checked by comparing model error bars against the scatter observed across multiple independent scans of the identical sample.
- Embedding the method in analysis software might allow automatic attachment of reliability estimates to published spectroscopy results.
Load-bearing premise
The neural network's predicted uncertainties are well-calibrated to the true statistical variability in the data and can be propagated through downstream fitting steps without introducing bias or underestimating errors.
What would settle it
A set of repeated independent measurements on the same cuprate sample that show variability in the extracted superconducting gap values larger than the error bars obtained by propagating the model's per-voxel uncertainties.
Figures


read the original abstract
While deep learning offers powerful capabilities for scientific research, its application is often hindered by a lack of quantitative reliability. To address this, we introduce a probabilistic denoising framework that simultaneously extracts denoised signals and element-wise predictive uncertainties from noisy data. We demonstrate this approach on three-dimensional angle-resolved photoemission spectroscopy data, showing that the model reliably recovers the spectral features of a cuprate superconductor from Poisson-distributed noise with an average count of only 0.02 electrons per voxel. Crucially, we show that these predicted uncertainties can be propagated into subsequent superconducting gap analyses, enabling quantitative parameter extraction with scientifically meaningful error bars. Furthermore, we validate the broad applicability of our approach by successfully extending it to two-dimensional X-ray diffraction data. Ultimately, this approach establishes uncertainty-aware deep learning not merely as a visualization tool, but as a rigorous framework for scientific data analysis.
Editorial analysis
A structured set of objections, weighed in public.
Referee Report
Summary. The paper introduces a probabilistic denoising framework using deep learning to simultaneously extract denoised signals and element-wise predictive uncertainties from noisy spectroscopy data. It demonstrates the approach on three-dimensional ARPES data of a cuprate superconductor, recovering spectral features from Poisson-distributed noise at an average of 0.02 electrons per voxel, and shows that the predicted uncertainties can be propagated into downstream superconducting gap analyses to yield quantitative parameter extraction with scientifically meaningful error bars. The framework is further validated on two-dimensional X-ray diffraction data.
Significance. If the uncertainties prove well-calibrated and propagation introduces no bias, the work would be significant for enabling rigorous quantitative analysis in photon-starved regimes common to spectroscopy, where conventional methods struggle and deep learning has previously been limited to visualization. It directly addresses the need for uncertainty-aware processing in scientific data pipelines.
major comments (3)
- The central claim that the model 'reliably recovers the spectral features' and yields 'scientifically meaningful error bars' after propagation (abstract and ARPES results) is not supported by any quantitative validation metrics, such as calibration plots, coverage probabilities, or simulation-based posterior checks against ground-truth signals at 0.02 counts/voxel.
- In the uncertainty propagation analysis (likely the gap-fitting subsection), the assertion that NN predictive uncertainties can be directly fed into the superconducting gap fitter without bias or mis-estimation lacks supporting evidence; at mean count 0.02 the Poisson likelihood is highly non-Gaussian with most voxels zero, yet no tests for mismatch or induced spatial correlations are reported.
- The probabilistic model (methods) assumes the network outputs well-calibrated per-voxel uncertainties equivalent to the true posterior variance, but no derivation or empirical verification shows how this holds under the low-count Poisson regime or accounts for the network's potential to introduce non-local correlations.
minor comments (2)
- Clarify in the abstract and methods whether the 0.02 electrons/voxel refers to raw counts before any binning or integration.
- Include uncertainty maps alongside all denoised ARPES and XRD figures to allow readers to assess spatial variation in predicted errors.
Simulated Author's Rebuttal
We thank the referee for their constructive comments, which help clarify the quantitative validation of our probabilistic denoising approach. We address each major point below and have updated the manuscript to incorporate additional metrics and tests where needed.
read point-by-point responses
-
Referee: The central claim that the model 'reliably recovers the spectral features' and yields 'scientifically meaningful error bars' after propagation (abstract and ARPES results) is not supported by any quantitative validation metrics, such as calibration plots, coverage probabilities, or simulation-based posterior checks against ground-truth signals at 0.02 counts/voxel.
Authors: We agree that explicit calibration plots and coverage probabilities were not presented in the original submission. In the revised manuscript we add these on synthetic data with known ground truth at 0.02 electrons per voxel, demonstrating that the predictive uncertainties achieve coverage probabilities within 5% of nominal levels (68% and 95%) and that recovered spectral features match ground truth within the reported uncertainties. Simulation-based posterior checks are also included to quantify bias and variance in the denoised output. revision: yes
-
Referee: In the uncertainty propagation analysis (likely the gap-fitting subsection), the assertion that NN predictive uncertainties can be directly fed into the superconducting gap fitter without bias or mis-estimation lacks supporting evidence; at mean count 0.02 the Poisson likelihood is highly non-Gaussian with most voxels zero, yet no tests for mismatch or induced spatial correlations are reported.
Authors: We acknowledge the concern regarding non-Gaussianity at such low counts. In the revision we add Monte Carlo simulations that inject the exact Poisson noise model into the denoised maps and re-fit the gap; the resulting parameter distributions match those obtained when propagating the network uncertainties, with no detectable bias in the gap magnitude or width. We further verify that the per-voxel uncertainties do not induce spurious spatial correlations by computing the empirical covariance of the fitted parameters across an ensemble of noise realizations and confirming consistency with the reference high-count data. revision: yes
-
Referee: The probabilistic model (methods) assumes the network outputs well-calibrated per-voxel uncertainties equivalent to the true posterior variance, but no derivation or empirical verification shows how this holds under the low-count Poisson regime or accounts for the network's potential to introduce non-local correlations.
Authors: The model employs a heteroscedastic network trained with a Gaussian negative-log-likelihood loss on Poisson-noisy inputs; while a full analytic derivation equating the output variance to the Bayesian posterior is not provided, we now include empirical calibration curves on held-out synthetic volumes spanning 0.01–0.1 counts per voxel that confirm the predicted variances match the observed error distribution. To address possible non-local correlations, we added a spatial autocorrelation analysis of the uncertainty maps showing that any residual correlations are attributable to the input data structure rather than the network architecture. revision: partial
Circularity Check
No circularity: empirical ML framework with external validation
full rationale
The paper introduces a probabilistic denoising neural network for spectroscopy data and validates it empirically on ARPES cuprate data (recovering features at 0.02 e-/voxel Poisson noise) plus XRD data. Claims rest on model training, signal recovery, and downstream gap analysis with propagated uncertainties, all benchmarked against held-out or high-count reference data. No derivation chain, equations, or self-citations reduce predictions to fitted inputs by construction; the network is treated as a learned denoiser whose uncertainties are checked via application rather than defined tautologically. The central results are self-contained against external benchmarks.
Axiom & Free-Parameter Ledger
axioms (2)
- domain assumption Electron counts in ARPES voxels follow a Poisson distribution
- ad hoc to paper A trained neural network can simultaneously predict denoised values and well-calibrated per-voxel uncertainties
Reference graph
Works this paper leans on
-
[1]
ARPES experiments—For the demonstrative data shown in Figs
The network was trained using a NVIDIA RTX 2060 with the PyTorch framework. ARPES experiments—For the demonstrative data shown in Figs. 2, 3, laser-based ARPES measurements were performed using a lab-based system at Seoul Na- tional University. A home-built Yb-doped fiber laser with a center wavelength of 1064 nm, a pulse width of 50 ps and a repetition r...
-
[2]
R. Roscher, B. Bohn, M. F. Duarte, and J. Garcke, Ex- plainable machine learning for scientific insights and dis- coveries, Ieee Access8, 42200 (2020)
work page 2020
- [3]
-
[4]
G. E. Karniadakis, I. G. Kevrekidis, L. Lu, P. Perdikaris, S. Wang, and L. Yang, Physics-informed machine learn- ing, Nature Reviews Physics3, 422 (2021)
work page 2021
-
[5]
Tarantola,Inverse problem theory and methods for model parameter estimation(SIAM, 2005)
A. Tarantola,Inverse problem theory and methods for model parameter estimation(SIAM, 2005)
work page 2005
-
[6]
M. Bertero, T. A. Poggio, and V. Torre, Ill-posed prob- lems in early vision, Proceedings of the IEEE76, 869 (1988)
work page 1988
-
[7]
A. Kendall and Y. Gal, What uncertainties do we need in bayesian deep learning for computer vision?, Advances in neural information processing systems30(2017)
work page 2017
-
[8]
J. Gawlikowski, C. R. N. Tassi, M. Ali, J. Lee, M. Humt, J. Feng, A. Kruspe, R. Triebel, P. Jung, R. Roscher, et al., A survey of uncertainty in deep neural networks, Artificial intelligence review56, 1513 (2023)
work page 2023
-
[9]
A. F. Psaros, X. Meng, Z. Zou, L. Guo, and G. E. Kar- niadakis, Uncertainty quantification in scientific machine learning: Methods, metrics, and comparisons, Journal of Computational Physics477, 111902 (2023)
work page 2023
- [10]
-
[11]
R. K. Vasudevan, M. Ziatdinov, L. Vlcek, and S. V. Kalinin, Off-the-shelf deep learning is not enough, and requires parsimony, bayesianity, and causality, npj Com- putational Materials7, 16 (2021)
work page 2021
- [12]
-
[13]
Y. Kim, D. Oh, S. Huh, D. Song, S. Jeong, J. Kwon, M. Kim, D. Kim, H. Ryu, J. Jung,et al., Deep learning- based statistical noise reduction for multidimensional spectral data, Review of Scientific Instruments92(2021)
work page 2021
-
[14]
arXiv preprint arXiv:2203.09168 , year=
M. Seitzer, A. Tavakoli, D. Antic, and G. Martius, On the pitfalls of heteroscedastic uncertainty estima- tion with probabilistic neural networks, arXiv preprint arXiv:2203.09168 (2022)
-
[15]
M. R. Norman, M. Randeria, H. Ding, and J. Cam- puzano, Phenomenology of the low-energy spectral func- tion in high-t c superconductors, Physical Review B57, R11093 (1998)
work page 1998
-
[16]
D. Wu, J. Jia, J. Yang, W. Hong, Y. Shu, T. Miao, H. Yan, H. Rong, P. Ai, X. Zhang,et al., Nodal s±pairing symmetry in an iron-based superconductor with only hole pockets, Nature Physics20, 571 (2024)
work page 2024
-
[17]
B. D. Cullity and R. Smoluchowski, Elements of x-ray diffraction, Physics Today10, 50 (1957)
work page 1957
-
[18]
J. Oppliger, M. M. Denner, J. K¨ uspert, R. Frison, Q. Wang, A. Morawietz, O. Ivashko, A.-C. Dippel, M. v. Zimmermann, I. Bia lo,et al., Weak signal extraction en- abled by deep neural network denoising of diffraction data, Nature Machine Intelligence6, 180 (2024)
work page 2024
-
[19]
J. Oppliger, M. Denner, J. K¨ uspert, R. Frison, Q. Wang, A. Morawietz, O. Ivashko, A.-C. Dippel, M. v. Zimmer- mann, N. Christensen,et al., X-ray diffraction dataset for experimental noise filtering, (No Title) (2022)
work page 2022
-
[20]
J. Oppliger, M. M. Denner, J. K¨ uspert, R. Frison, Q. Wang, A. Morawietz, O. Ivashko, A.-C. Dippel, M. von Zimmermann, I. Bia lo, L. Martinelli, B. Fauqu´ e, J. Choi, M. Garcia-Fernandez, K.-J. Zhou, N. B. Chris- tensen, T. Kurosawa, N. Momono, M. Oda, F. D. Nat- terer, M. H. Fischer, T. Neupert, and J. Chang, Code for: Weak signal extraction enabled by ...
work page 2023
-
[21]
S. M. Kay, Statistical signal processing: estimation the- ory, Prentice Hall1, Chapter (1993)
work page 1993
-
[22]
T. M. Cover,Elements of information theory(John Wi- ley & Sons, 1999)
work page 1999
-
[23]
H. Peng, X. Gao, Y. He, Y. Li, Y. Ji, C. Liu, S. A. Ekahana, D. Pei, Z. Liu, Z. Shen,et al., Super resolu- tion convolutional neural network for feature extraction in spectroscopic data, Review of Scientific Instruments 91(2020)
work page 2020
-
[24]
T. C. Meyer, G.-R. Siemann, P. Majchrzak, T. Seyller, J. Rigden, Y. Zhang, E. Springate, C. Sanders, and P. Hofmann, Line shapes in time-and angle-resolved pho- toemission spectroscopy explored by machine learning, Electronic Structure7, 045001 (2025)
work page 2025
-
[25]
S. ´Y. ´Ag´ ustsson, M. A. Haque, T. T. Truong, M. Bianchi, N. Klyuchnikov, D. Mottin, P. Karras, and P. Hofmann, An autoencoder for compressing angle-resolved photoe- mission spectroscopy data, Machine Learning: Science and Technology6, 015019 (2025)
work page 2025
-
[26]
P. Majchrzak, C. Sanders, Y. Zhang, A. Kuibarov, O. Suvorov, E. Springate, I. Kovalchuk, S. Aswartham, G. Shipunov, B. B¨ uchner,et al., Machine-learning ap- proach to understanding ultrafast carrier dynamics in the three-dimensional brillouin zone of ptbi 2, Physical Re- view Research7, 013025 (2025)
work page 2025
-
[27]
X. Chen, Y. Sun, E. Hruska, V. Dixit, J. Yang, Y. He, Y. Wang, and F. Liu, Detecting thermodynamic phase transition via explainable machine learning of photoe- mission spectroscopy, Newton1(2025)
work page 2025
-
[28]
T. Yoon, S. W. Kim, H. Byun, Y. Kim, C. D. Carter, and H. Do, Deep learning-based denoising for fast time- resolved flame emission spectroscopy in high-pressure combustion environment, Combustion and Flame248, 112583 (2023)
work page 2023
-
[29]
F. Joucken, J. L. Davenport, Z. Ge, E. A. Quezada- Lopez, T. Taniguchi, K. Watanabe, J. Velasco Jr, J. Lagoute, and R. A. Kaindl, Denoising scanning tun- neling microscopy images of graphene with supervised machine learning, Physical Review Materials6, 123802 (2022)
work page 2022
-
[30]
R. P. Xian, V. Stimper, M. Zacharias, M. Dendzik, S. Dong, S. Beaulieu, B. Sch¨ olkopf, M. Wolf, L. Ret- tig, C. Carbogno,et al., A machine learning route be- tween band mapping and band structure, Nature Com- putational Science3, 101 (2023)
work page 2023
-
[31]
J. Liu, D. Huang, Y.-f. Yang, and T. Qian, Remov- ing grid structure in angle-resolved photoemission spec- 8 tra via deep learning method, Physical Review B107, 165106 (2023)
work page 2023
-
[32]
S. A. Ekahana, G. I. Winata, Y. Soh, A. Tamai, R. Mi- lan, G. Aeppli, and M. Shi, Transfer learning application of self-supervised learning in arpes, Machine Learning: Science and Technology4, 035021 (2023)
work page 2023
- [33]
-
[34]
M. Ziatdinov, A. Ghosh, C. Y. Wong, and S. V. Kalinin, Atomai framework for deep learning analysis of image and spectroscopy data in electron and scanning probe microscopy, Nature Machine Intelligence4, 1101 (2022)
work page 2022
-
[35]
S. ´Y. ´Ag´ ustsson, M. Bianchi, and H. Philip, 3D ARPES angle scan collection, 10.5281/zenodo.12665275 (2024)
-
[36]
Decoupled Weight Decay Regularization
I. Loshchilov and F. Hutter, Decoupled weight decay reg- ularization, arXiv preprint arXiv:1711.05101 (2017). ACKNOWLEDGMENTS We thank Dongjoon Song for providing high-quality Bi-2212 samples; Sangjae Lee, Jae Hyuck Lee, Suy- oung Lee, Saegyeol Jung and Jongkeun Jung for pro- viding the 3D ARPES data used in the training dataset; and Youngdo Kim for helpf...
work page internal anchor Pith review Pith/arXiv arXiv 2017
discussion (0)
Sign in with ORCID, Apple, or X to comment. Anyone can read and Pith papers without signing in.