Recognition: no theorem link
Learning from Translation: Seasonal Errors and Feature Importance of the ERA5 Turbulence Predictions
Pith reviewed 2026-05-11 03:01 UTC · model grok-4.3
The pith
Machine learning models show solar radiation as the main driver of optical turbulence predictions from ERA5 data across sites and seasons.
A machine-rendered reading of the paper's core claim, the machinery that carries it, and where it could break.
Core claim
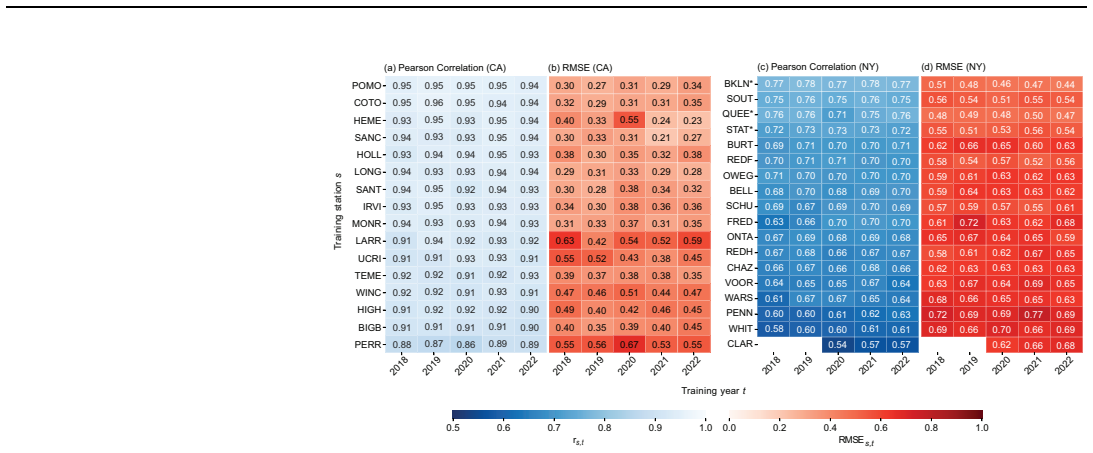
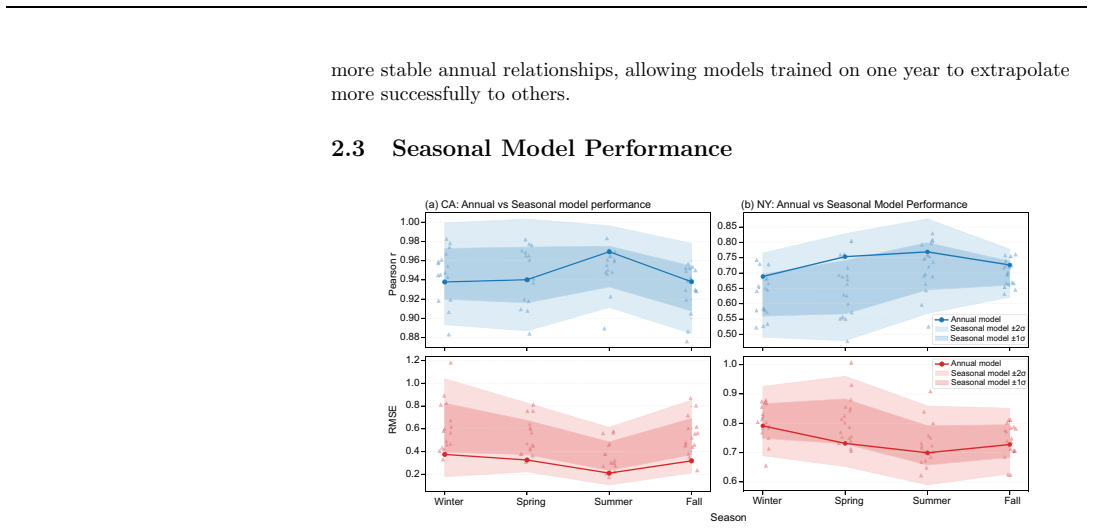
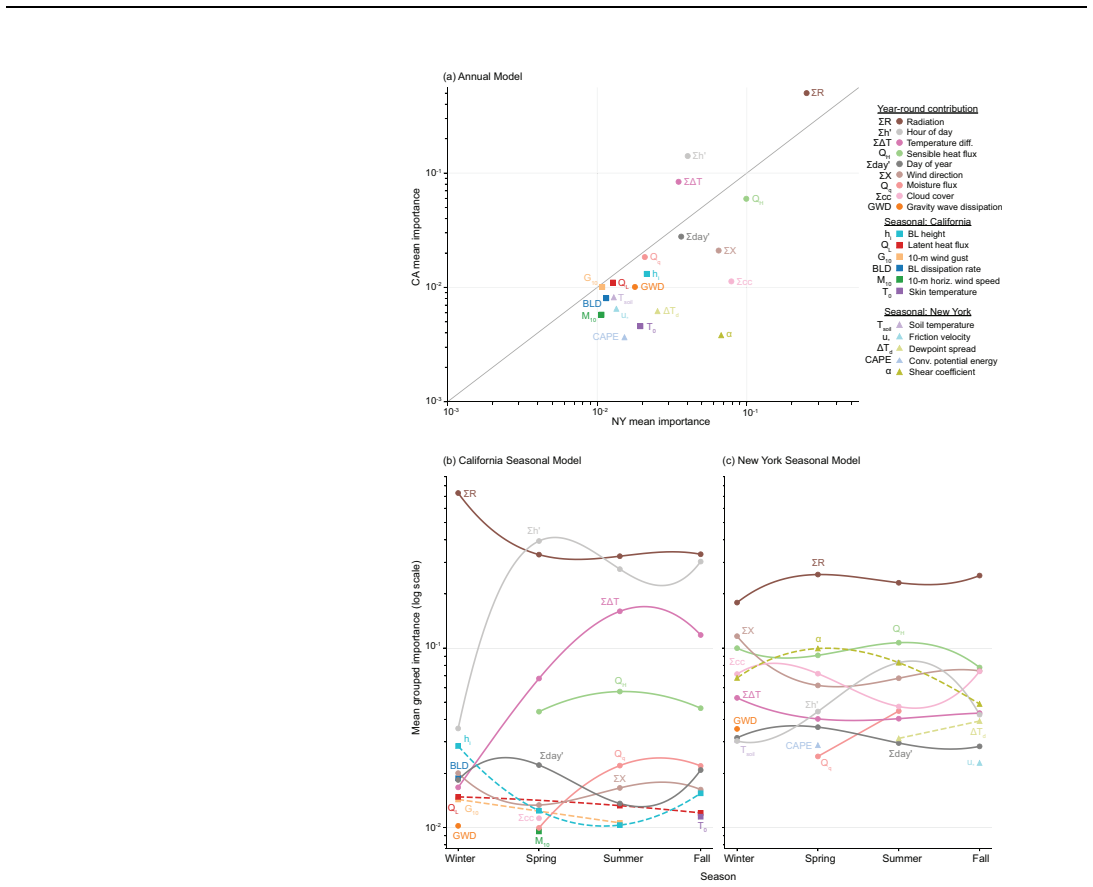
Training machine learning models on one year of co-located Cn2 observations and ERA5 data allows temporal extrapolation to other years at the same sites, yielding multi-year turbulence time series with stable performance across Southern California and New York. All models exhibit stronger correlation, quicker convergence, and reduced errors during summer months. Regardless of location, solar radiation ranks as the top feature of importance, indicating its central role in driving atmospheric turbulence via radiative energy transfer. Seasonal differences in both errors and which ERA5 features matter most point to influences from unmonitored factors such as atmospheric composition.
What carries the argument
Machine learning models that map ERA5 reanalysis variables to Cn2 turbulence strength, assessed through feature importance rankings and seasonal error patterns.
Load-bearing premise
That the feature importance rankings produced by the machine learning models capture physical causes of turbulence rather than statistical patterns tied to the particular training data or model choice.
What would settle it
Measure actual turbulence under conditions of matched solar radiation but differing atmospheric composition such as aerosol loading, then check whether adding composition variables to the ERA5 inputs reduces the seasonal prediction errors.
Figures


read the original abstract
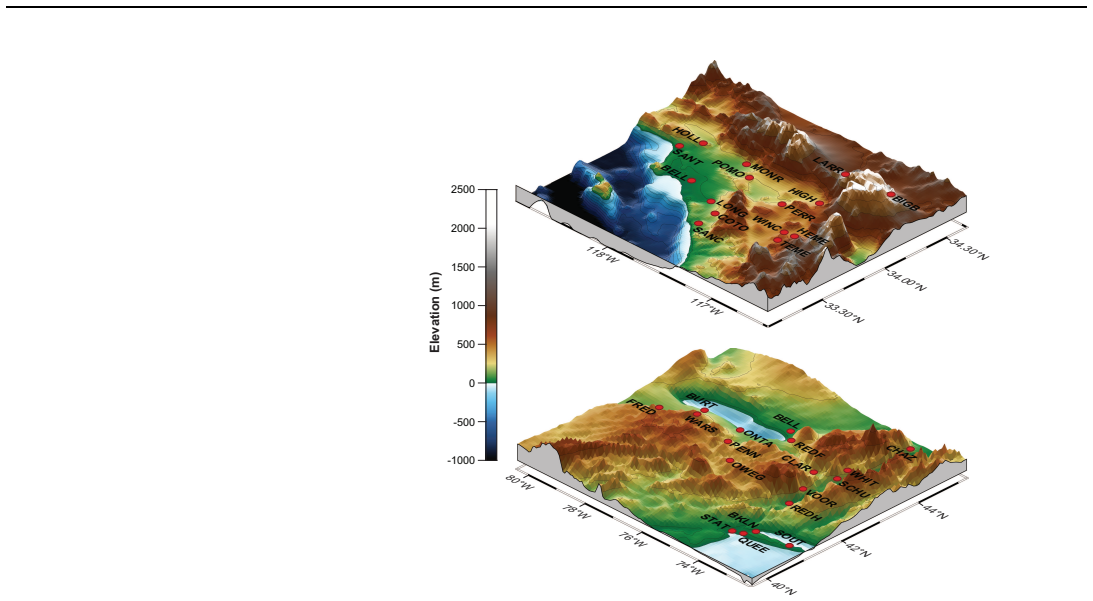
Turbulence is a phenomena that is {\it locally} and statistically characterized by measurements, but it is caused by {\it nonlocal} energy cascades associated with the environment. The presence of turbulence coincides with fluctuations in the refractive index, which impact optical sensing, imaging, and signaling applications. Here, we study the machine learning models that predict near-surface optical turbulence strength $C_n^2$, derived from anemometer-based surface flux measurements through Monin-Obukhov similarity theory, using ERA5 reanalysis data as model inputs. We evaluate the model's ability to perform temporal extrapolation by training on one year of co-located $C_n^2$ observations and ERA5 data, and applying the model to ERA5 data from other years at the same site to reconstruct a multi-year time series. We compare the predictions across Southern California and New York. In spite of varying weather and terrain, the ML models show consistent performance and seasonal behavior across training years. All models show greater correlation, faster convergence, and lower prediction errors in the summer. However, some ERA5 features drive predictions in New York but not California and vice versa, and such feature dependence depends on the season. Seasonal error and feature trends suggest that turbulence is affected by atmospheric composition or other seasonal environmental considerations that are not currently monitored by ERA5. We find, regardless of terrain, the primary feature of importance to turbulence prediction is solar radiation, which underlines the central role of radiative energy transfer in driving atmospheric turbulence. We point toward physics-informed ML translation and feature selection as tools for improving the generalizability of data-driven models.
Editorial analysis
A structured set of objections, weighed in public.
Referee Report
Summary. The manuscript trains machine learning models to predict near-surface optical turbulence strength Cn² (derived from anemometer surface flux measurements via Monin-Obukhov similarity theory) using ERA5 reanalysis variables as inputs. Models are trained on one year of co-located data at sites in Southern California and New York, then applied to ERA5 data from other years at the same locations for temporal extrapolation and multi-year reconstruction. The authors report consistent model performance across training years despite differing weather and terrain, with improved correlation, faster convergence, and lower errors during summer months; site- and season-specific differences in feature importance; and solar radiation as the dominant predictor regardless of terrain, which they interpret as evidence for the central physical role of radiative energy transfer in driving turbulence. They suggest physics-informed ML translation and feature selection to enhance generalizability.
Significance. If the reported seasonal trends and feature rankings are robust, the work could help identify key drivers for data-driven turbulence modeling and improve extrapolation across years and sites for optical applications. The temporal-extrapolation setup and cross-terrain comparison are useful for assessing model generalizability. However, the central interpretation that feature importance directly indicates physical causation (rather than statistical association) would need stronger support to have broad impact on the field.
major comments (3)
- [Abstract, results] Abstract and results sections: The claims of 'consistent performance,' 'greater correlation, faster convergence, and lower prediction errors in the summer,' and site-specific feature differences are stated without any quantitative metrics (e.g., R², RMSE, MAE, or convergence rates) or details on the validation procedure, error distributions, or statistical significance tests for the temporal extrapolation. This absence makes it impossible to evaluate the magnitude or robustness of the reported seasonal and cross-site behaviors.
- [Abstract, feature importance analysis] Abstract and feature-importance discussion: The claim that solar radiation is 'the primary feature of importance to turbulence prediction' 'regardless of terrain' and 'underlines the central role of radiative energy transfer in driving atmospheric turbulence' is not supported by the presented evidence. Feature-importance rankings from ML models trained on ERA5 inputs reflect statistical associations within the training distribution; solar radiation is known to be correlated with other ERA5 variables (temperature, humidity, boundary-layer height, surface fluxes) that also influence stability and Cn². No ablation studies, partial-dependence plots holding confounders fixed, or causal-inference methods are described to distinguish correlation from causation.
- [Methods, results] Methods and results: The workflow trains on co-located Cn² observations and ERA5 data then applies the model to independent ERA5 periods at the same sites. While this avoids direct circularity, the manuscript does not report whether the derived Cn² targets (via Monin-Obukhov) are computed consistently across years or whether any site-specific calibration parameters are held fixed, which could affect the apparent seasonal error trends.
minor comments (2)
- [Abstract] Abstract: 'Turbulence is a phenomena' should read 'Turbulence is a phenomenon.'
- [Results] The manuscript would benefit from a table or figure summarizing quantitative performance metrics (R², RMSE, etc.) for each site, season, and training year to support the textual claims.
Simulated Author's Rebuttal
We thank the referee for the detailed and constructive comments, which have helped us identify areas where the manuscript can be clarified and strengthened. We address each major comment below with specific plans for revision.
read point-by-point responses
-
Referee: [Abstract, results] Abstract and results sections: The claims of 'consistent performance,' 'greater correlation, faster convergence, and lower prediction errors in the summer,' and site-specific feature differences are stated without any quantitative metrics (e.g., R², RMSE, MAE, or convergence rates) or details on the validation procedure, error distributions, or statistical significance tests for the temporal extrapolation. This absence makes it impossible to evaluate the magnitude or robustness of the reported seasonal and cross-site behaviors.
Authors: We agree that the abstract presents these findings qualitatively and that explicit quantitative support is needed for proper evaluation. The results section contains the relevant metrics (seasonal R², RMSE, MAE, training convergence curves) and describes the temporal extrapolation protocol with cross-validation. To resolve this, we will revise the abstract to incorporate key quantitative values and add a dedicated paragraph in the results section detailing the validation procedure, error distributions, and statistical significance testing for seasonal differences. revision: yes
-
Referee: [Abstract, feature importance analysis] Abstract and feature-importance discussion: The claim that solar radiation is 'the primary feature of importance to turbulence prediction' 'regardless of terrain' and 'underlines the central role of radiative energy transfer in driving atmospheric turbulence' is not supported by the presented evidence. Feature-importance rankings from ML models trained on ERA5 inputs reflect statistical associations within the training distribution; solar radiation is known to be correlated with other ERA5 variables (temperature, humidity, boundary-layer height, surface fluxes) that also influence stability and Cn². No ablation studies, partial-dependence plots holding confounders fixed, or causal-inference methods are described to distinguish correlation from causation.
Authors: We accept that feature-importance rankings capture statistical associations and that solar radiation is correlated with other ERA5 variables. The original phrasing was intended to note the feature's consistent top ranking and its physical plausibility under Monin-Obukhov theory. In revision we will (i) soften the abstract and discussion language to emphasize correlation, (ii) add partial-dependence plots to illustrate marginal effects, and (iii) include an explicit limitations paragraph on confounders and the desirability of future causal analyses. revision: partial
-
Referee: [Methods, results] Methods and results: The workflow trains on co-located Cn² observations and ERA5 data then applies the model to independent ERA5 periods at the same sites. While this avoids direct circularity, the manuscript does not report whether the derived Cn² targets (via Monin-Obukhov) are computed consistently across years or whether any site-specific calibration parameters are held fixed, which could affect the apparent seasonal error trends.
Authors: The Cn² targets are obtained from the standard Monin-Obukhov similarity relations using fixed universal constants and literature roughness lengths applied uniformly to all years and sites; no year-specific or site-specific recalibration is performed. We will add an explicit statement in the Methods section confirming this uniform computation procedure to demonstrate that the reported seasonal trends are not artifacts of inconsistent target derivation. revision: yes
Circularity Check
No circularity in the ML training, extrapolation, or feature-importance workflow.
full rationale
The paper trains supervised models on one year of co-located ERA5 inputs and Cn² targets (the latter obtained via Monin-Obukhov similarity from surface-flux observations), then evaluates on ERA5 data from independent years at the same sites. Feature importances are computed directly from the fitted models' behavior on these held-out periods; the reported ranking of solar radiation is therefore an empirical output of the trained predictor, not a quantity defined in terms of itself or recovered by construction from the training labels. No self-citation is invoked to justify the core workflow or the uniqueness of the chosen features, and the seasonal-error analysis likewise rests on direct comparison of model outputs against the same independent ERA5 time series. The interpretive sentence linking feature rank to 'the central role of radiative energy transfer' is an after-the-fact gloss rather than a load-bearing step in any derivation chain.
Axiom & Free-Parameter Ledger
axioms (1)
- domain assumption Monin-Obukhov similarity theory accurately derives Cn² from anemometer-based surface flux measurements
Reference graph
Works this paper leans on
-
[1]
Estimation of ground-based atmospheric turbulence strength (c n2) by neural network arch itecture,
U. Celik, H. A. Yasar, M. Yigitoglu Keskin, et al. , “Estimation of ground-based atmospheric turbulence strength (c n2) by neural network arch itecture,” Applied Optics 63, 7402 (2024)
work page 2024
-
[2]
M. G. Grose and E. A. Watson, “Forecasting atmospheric turbu lence conditions from prior environmental parameters using artificial neural netw orks,” Applied Optics 62, 3370 (2023)
work page 2023
-
[3]
Y. Wang and S. Basu, “Using an artificial neural network approa ch to estimate surface-layer optical turbulence at mauna loa, hawaii,” Optics Lett ers 41, 2334 (2016)
work page 2016
-
[4]
Behavior of the refractive-index-structure parameter near the ground*,
J. C. Wyngaard, Y. Izumi, and S. A. Collins, “Behavior of the refractive-index-structure parameter near the ground*,” Jou rnal of the Optical Society of America 61, 1646 (1971). 12/15
work page 1971
-
[5]
Machine-learning informed macro-meteorological models for the near-maritime environment,
C. Jellen, M. Oakley, C. Nelson, et al. , “Machine-learning informed macro-meteorological models for the near-maritime environment,” Applied Optics 60, 2938 (2021)
work page 2021
-
[6]
Utilizing the kantorovich metric for the valid ation of optical turbulence predictions,
Y. Wang and S. Basu, “Utilizing the kantorovich metric for the valid ation of optical turbulence predictions,” Optics Letters 41, 4008 (2016)
work page 2016
-
[7]
M. Pierzyna, S. Basu, and R. Saathof, “Otclim: Generating a nea r-surface climatology of optical turbulence strength (cn2) using gradient bo osting,” Artificial Intelligence for the Earth Systems 4 (2025)
work page 2025
-
[8]
A technical overview of the new york state mesonet standard network,
J. A. Brotzge, J. Wang, C. D. Thorncroft, et al. , “A technical overview of the new york state mesonet standard network,” Journal of Atmosph eric and Oceanic Technology 37, 1827–1845 (2020)
work page 2020
-
[9]
Basic laws of turbulent mixing in the surface layer of the atmosphere,
A. S. Monin and A. M. Obukhov, “Basic laws of turbulent mixing in the surface layer of the atmosphere,” (2009)
work page 2009
-
[10]
S. Tichkule and A. Muschinski, “Optical anemometry based on th e temporal cross-correlation of angle-of-arrival fluctuations obtained fro m spatially separated light sources,” Applied Optics 51, 5272 (2012)
work page 2012
-
[11]
A. Muschinski and E. L. Wagner, “First field measurements of o ptical turbulence near the ground with a newly developed fine-wire thermo meter,” Waves in Random and Complex Media 33, 1234–1249 (2023)
work page 2023
-
[12]
M. Pierzyna, O. Hartogensis, S. Basu, and R. Saathof, “Inte rcomparison of flux-, gradient-, and variance-based optical turbulence (c n2) p arameterizations,” Applied Optics 63, E107 (2024)
work page 2024
-
[13]
The combined effect of temperature and humidit y fluctuations on refractive index,
M. L. Wesely, “The combined effect of temperature and humidit y fluctuations on refractive index,” Journal of Applied Meteorology (1962-1982) pp . 43–49 (1976)
work page 1962
-
[14]
D. Papale, M. Reichstein, M. Aubinet, et al. , “Towards a standardized processing of net ecosystem exchange measured with eddy covar iance technique: algorithms and uncertainty estimation,” Biogeosciences 3, 571–583 (2006)
work page 2006
-
[15]
H. Hersbach, B. Bell, P. Berrisford, et al. , “The era5 global reanalysis,” Quarterly Journal of the Royal Meteorological Society 146, 1999–2049 (2020)
work page 1999
-
[16]
A. Cremades, S. Hoyas, and R. Vinuesa, “Additive-feature-a ttribution methods: A review on explainable artificial intelligence for fluid dynamics and heat transfer,” International Journal of Heat and Fluid Flow 112, 109662 (2025)
work page 2025
-
[17]
D. Sadot, “Forecasting optical turbulence strength on the b asis of macroscale meteorology and aerosols: models and validation,” Optical Engineerin g 31, 200 (1992)
work page 1992
-
[18]
Prediction model of atmospheric refractive index structure parameter in coastal area,
H. Wang, B. Li, X. Wu, et al. , “Prediction model of atmospheric refractive index structure parameter in coastal area,” Journal of Modern O ptics 62, 1336–1346 (2015)
work page 2015
-
[19]
Optical propagation through non-overturnin g, undulating temperature sheets in the atmosphere,
A. Muschinski, “Optical propagation through non-overturnin g, undulating temperature sheets in the atmosphere,” Journal of the Optical S ociety of America A 33, 793 (2016)
work page 2016
-
[20]
G. Casasanta, M. Conte, R. Sozzi, et al. , “Towards definitive functional forms for monin–obukhov similarity functions in stable and very stable surf ace layers,” Scientific Reports 15 (2025). 13/15
work page 2025
-
[21]
Monin–obukhov similarit y functions for the structure parameters of temperature and hu midity,
D. Li, E. Bou-Zeid, and H. A. R. De Bruin, “Monin–obukhov similarit y functions for the structure parameters of temperature and hu midity,” Boundary-Layer Meteorology 145, 45–67 (2011)
work page 2011
-
[22]
Measurement and analysis of atmospheric optical turbulence in a near-maritime environment,
C. Jellen, C. Nelson, C. Brownell, et al. , “Measurement and analysis of atmospheric optical turbulence in a near-maritime environment,” IO P SciNotes 1, 024006 (2020)
work page 2020
-
[23]
L. M. J. Kooijmans and O. K. Hartogensis, “Surface-layer simila rity functions for dissipation rate and structure parameters of temperature a nd humidity based on eleven field experiments,” Boundary-Layer Meteorology 160, 501–527 (2016)
work page 2016
-
[24]
Non-classic atmospheric optical t urbulence: Review,
O. Korotkova and I. Toselli, “Non-classic atmospheric optical t urbulence: Review,” Applied Sciences 11, 8487 (2021)
work page 2021
-
[25]
E. Adams and M. van Iersel, “Gaussian beam propagation throu gh anisotropic turbulence: a comparison of the extended huygens–fresnel prin ciple and the perturbation method,” Journal of the Optical Society of America A 42, 422 (2025)
work page 2025
-
[26]
Quasi-stable therm al gradients driving atmospheric optical anisotropy,
V. A. Kulikov, A. Augustus, and N. Worku, “Quasi-stable therm al gradients driving atmospheric optical anisotropy,” Optics Letters 51, 145 (2025)
work page 2025
-
[27]
Tatsumi, Theory of Homogeneous Turbulence (Elsevier, 1980), p
T. Tatsumi, Theory of Homogeneous Turbulence (Elsevier, 1980), p. 39–133
work page 1980
-
[28]
Determination of the tu rbulent temperature–humidity correlation from scintillometric measuremen ts,
A. L¨ udi, F. Beyrich, and C. M¨ atzler, “Determination of the tu rbulent temperature–humidity correlation from scintillometric measuremen ts,” Boundary-Layer Meteorology 117, 525–550 (2005)
work page 2005
-
[29]
G. O. Odhiambo and M. J. Savage, “Sensible heat flux by surface layer scintillometry and eddy covariance over a mixed grassland community as affected by bowen ratio and most formulations for unstable condit ions,” Journal of Hydrometeorology 10, 479–492 (2009)
work page 2009
-
[30]
Comparison of sonic anemometer performance under foggy conditions,
T. S. El-Madany, F. Griessbaum, G. Fratini, et al. , “Comparison of sonic anemometer performance under foggy conditions,” Agricultural a nd Forest Meteorology 173, 63–73 (2013)
work page 2013
-
[31]
H. Loescher, T. Ocheltree, B. Tanner, et al. , “Comparison of temperature and wind statistics in contrasting environments among different sonic anemometer–thermometers,” Agricultural and Forest Meteorolo gy 133, 119–139 (2005)
work page 2005
-
[32]
Improved magnus form app roximation of saturation vapor pressure,
O. A. Alduchov and R. E. Eskridge, “Improved magnus form app roximation of saturation vapor pressure,” Journal of Applied Meteorology 35, 601–609 (1996)
work page 1996
-
[33]
Progress in observing and modelling the urban bou ndary layer,
J. F. Barlow, “Progress in observing and modelling the urban bou ndary layer,” Urban Climate 10, 216–240 (2014)
work page 2014
-
[34]
T. R. Oke, G. Mills, A. Christen, and J. A. Voogt, Urban Climates (Cambridge University Press, 2017)
work page 2017
-
[35]
Removal of trace gases can both increase and decrease cloud droplet formation,
E. Ravichandran, S. Han, A. S. Williams, et al. , “Removal of trace gases can both increase and decrease cloud droplet formation,” Science Adva nces 12 (2026). 14/15
work page 2026
-
[36]
S. K. Muppa, A. Behrendt, F. Sp¨ ath, et al. , “Turbulent humidity fluctuations in the convective boundary layer: Case studies using water vapour d ifferential absorption lidar measurements,” Boundary-Layer Meteorology 158, 43–66 (2015). 15/15
work page 2015
discussion (0)
Sign in with ORCID, Apple, or X to comment. Anyone can read and Pith papers without signing in.