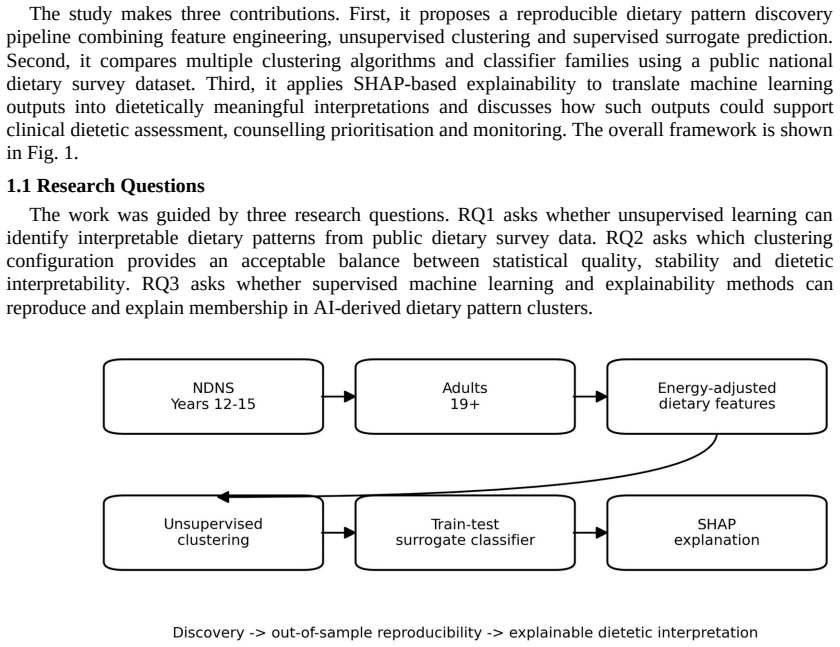
Recognition: 3 theorem links
· Lean TheoremAn Explainable Unsupervised-to-Supervised Machine Learning Framework for Dietary Pattern Discovery Using UK National Dietary Survey Data
Pith reviewed 2026-05-12 00:53 UTC · model grok-4.3
The pith
K-means clustering on UK dietary survey data yields four interpretable patterns reproducible by a surrogate classifier.
A machine-rendered reading of the paper's core claim, the machinery that carries it, and where it could break.
Core claim
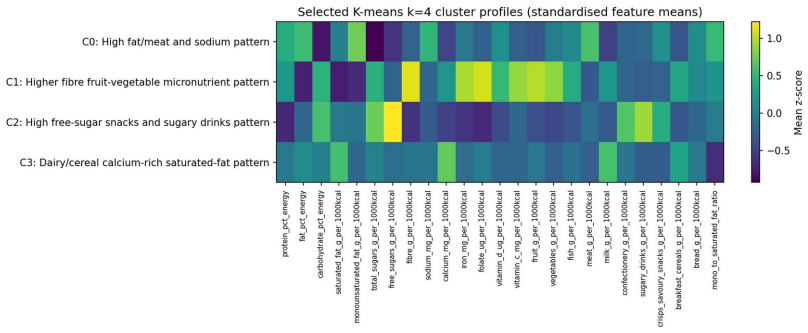
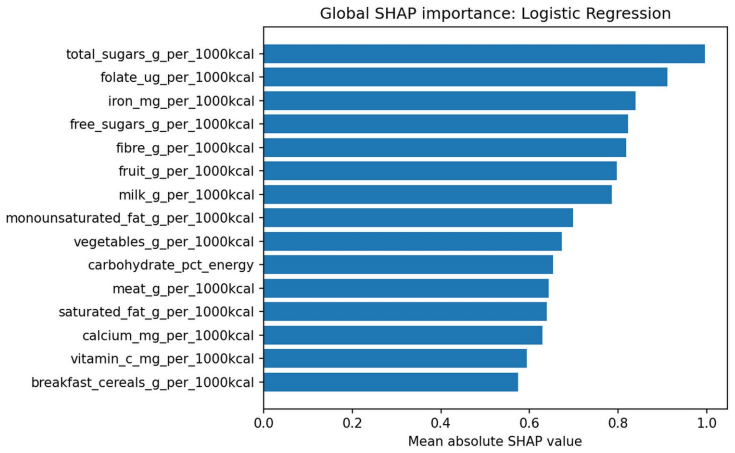
The central claim is that K-means with k=4 applied to 25 energy-adjusted nutrient and food-group features from NDNS Years 12-15 adult data identifies four stable, dietetically interpretable patterns: high fat/meat and sodium, higher fibre fruit-vegetable micronutrient, high free-sugar snacks and sugary drinks, and dairy/cereal calcium-rich saturated-fat. These patterns are reproduced on held-out observations by a supervised surrogate classifier that reaches macro-F1 of 0.963, while SHAP analysis shows that the classifier's decisions rest on dietetically meaningful feature contributions, supporting use for assessment, counselling prioritisation and follow-up monitoring.
What carries the argument
The unsupervised-to-supervised pipeline that uses K-means clustering to discover dietary patterns and a surrogate classifier with SHAP explanations to reproduce and interpret cluster membership.
If this is right
- Four distinct dietary patterns can be consistently recovered from the survey features.
- A surrogate classifier assigns new individuals to the patterns at high accuracy without re-running clustering.
- SHAP values identify which nutrients and food groups most strongly define each pattern.
- The patterns supply a reduced set of targets for dietetic counselling and monitoring.
Where Pith is reading between the lines
- The pipeline could be re-applied to later survey waves to detect population-level shifts in the same patterns.
- Clinicians might run the surrogate on individual patient records to obtain quick pattern labels and feature drivers.
- Similar clustering-plus-surrogate steps on other national surveys could allow direct comparison of dietary structures across countries.
Load-bearing premise
The four clusters represent stable, dietetically meaningful patterns that can be usefully interpreted and applied in clinical settings via the surrogate model and SHAP explanations.
What would settle it
Repeating the full pipeline on NDNS Years 16-18 data and finding either unstable clusters or surrogate macro-F1 well below 0.963 would show the patterns do not generalise.
Figures

read the original abstract
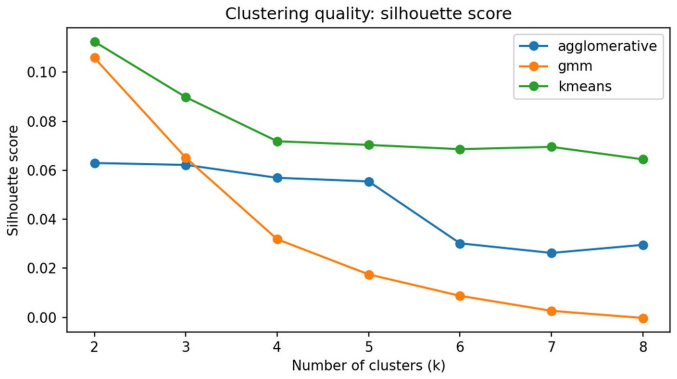
Clinical dietary assessment can generate detailed but high-dimensional nutrient and food-group information that is difficult to translate quickly into counselling priorities. This paper proposes an explainable unsupervised-to-supervised machine learning framework for discovering, reproducing and interpreting dietary patterns using public UK National Diet and Nutrition Survey data. Adult participants aged 19 years and above from NDNS Years 12-15 were represented using 25 energy-adjusted nutrient and food-group features. K-means, Gaussian Mixture Models and Agglomerative Clustering were compared across k = 2-8, with stability and dietetic interpretability used alongside internal validation metrics. The selected K-means k = 4 solution identified four interpretable dietary patterns: high fat/meat and sodium, higher fibre fruit-vegetable micronutrient, high free-sugar snacks and sugary drinks, and dairy/cereal calcium-rich saturated-fat. A supervised surrogate classifier reproduced held-out cluster membership with high test performance (macro-F1 = 0.963), but was interpreted only as an explanatory surrogate rather than as an independent clinical prediction model. SHAP analysis linked predictions to dietetically meaningful drivers, suggesting potential value for dietitian-in-the-loop assessment, counselling prioritisation and follow-up monitoring.
Editorial analysis
A structured set of objections, weighed in public.
Referee Report
Summary. The manuscript proposes an explainable unsupervised-to-supervised machine learning framework for dietary pattern discovery using UK NDNS Years 12-15 data. Adult participants are represented with 25 energy-adjusted nutrient and food-group features. K-means, GMM and agglomerative clustering are compared for k=2-8; the selected K-means k=4 solution yields four interpretable patterns (high fat/meat/sodium, higher fibre/fruit-vegetable/micronutrient, high free-sugar snacks/drinks, dairy/cereal/calcium-rich saturated-fat). A supervised surrogate classifier reproduces held-out cluster membership (macro-F1=0.963) and SHAP explanations are provided, with the claim that this offers potential value for dietitian-in-the-loop assessment.
Significance. If the four clusters prove stable and meaningfully linked to health outcomes, the framework could offer a reproducible, interpretable tool for translating high-dimensional dietary data into clinical priorities. Strengths include public-data use, explicit method comparison, and the surrogate+SHAP pipeline; however, significance is limited by the absence of any linkage to NDNS anthropometric/biochemical variables or clinical endpoints.
major comments (3)
- [Abstract / Results (cluster selection)] Cluster selection and interpretability (abstract and results): The k=4 choice and claim of four 'interpretable dietary patterns' rest partly on unquantified 'dietetic interpretability' with no inter-rater agreement, blinded review, or expert-panel scores reported. This is load-bearing for the clinical-utility assertion.
- [Abstract / Results (surrogate classifier)] Surrogate performance (abstract and results): The macro-F1=0.963 on held-out data is expected by construction because the supervised model is trained to reproduce the unsupervised cluster labels; it does not constitute an independent test of pattern meaningfulness or stability.
- [Methods / Results / Discussion] Validation with health outcomes (methods/results/discussion): NDNS contains anthropometric and biochemical variables (BMI, blood pressure, lipids, micronutrient status), yet no post-hoc tests assess whether the four clusters differ on these measures. This is required to support the claim of 'potential value for dietitian-in-the-loop assessment'.
minor comments (3)
- [Abstract] Abstract: Clarify that the surrogate is purely explanatory and not positioned as a clinical prediction model for health outcomes.
- [Methods] Methods: Provide explicit details on the stability metrics used alongside internal validation and how 'dietetic interpretability' was operationalised.
- [Figures] Figures: Ensure all SHAP plots clearly label feature names and units for reproducibility.
Simulated Author's Rebuttal
We thank the referee for the constructive and detailed comments on our manuscript. We address each major comment point by point below, providing clarifications and indicating where revisions have been made to improve the paper.
read point-by-point responses
-
Referee: [Abstract / Results (cluster selection)] Cluster selection and interpretability (abstract and results): The k=4 choice and claim of four 'interpretable dietary patterns' rest partly on unquantified 'dietetic interpretability' with no inter-rater agreement, blinded review, or expert-panel scores reported. This is load-bearing for the clinical-utility assertion.
Authors: We selected k=4 using a combination of quantitative internal validation metrics (silhouette score, Davies-Bouldin index), cluster stability assessed via repeated bootstrapping, and qualitative evaluation of the resulting nutrient profiles for distinctiveness and alignment with established dietary patterns in the UK population. While formal inter-rater agreement metrics with external dietitians were not performed, the four patterns are defined by clear, non-overlapping differences in key nutrients (e.g., free sugars vs. fibre, sodium vs. calcium) that match patterns reported in prior NDNS publications. In the revised manuscript we have added a supplementary table with cluster centroid values for all 25 features and additional citations to support interpretability. We have also adjusted wording in the abstract and discussion to emphasize that clinical utility remains potential rather than demonstrated. revision: partial
-
Referee: [Abstract / Results (surrogate classifier)] Surrogate performance (abstract and results): The macro-F1=0.963 on held-out data is expected by construction because the supervised model is trained to reproduce the unsupervised cluster labels; it does not constitute an independent test of pattern meaningfulness or stability.
Authors: The referee correctly notes that high surrogate performance is expected because the classifier is trained directly on the unsupervised labels. The surrogate is used solely to enable post-hoc SHAP explanations of the cluster assignments rather than to provide independent validation of pattern stability or external meaningfulness. We have revised the abstract, methods, and discussion sections to explicitly state this limited role and to remove any phrasing that could imply the F1 score constitutes an independent test of the patterns themselves. revision: yes
-
Referee: [Methods / Results / Discussion] Validation with health outcomes (methods/results/discussion): NDNS contains anthropometric and biochemical variables (BMI, blood pressure, lipids, micronutrient status), yet no post-hoc tests assess whether the four clusters differ on these measures. This is required to support the claim of 'potential value for dietitian-in-the-loop assessment'.
Authors: We agree that direct comparison of the clusters against NDNS anthropometric and biochemical variables would strengthen evidence for clinical relevance. The present study was scoped to focus on the development, reproducibility, and explainability of the unsupervised-to-supervised framework. In the revised discussion we have added an explicit limitations paragraph acknowledging the absence of these analyses and have outlined future work that will link the discovered patterns to health outcomes using the same NDNS dataset. This keeps the current contribution focused while addressing the referee's concern about the strength of the clinical-utility claim. revision: partial
Circularity Check
Surrogate classifier 'prediction' of cluster membership reduces to reproduction of its own unsupervised training labels
specific steps
-
fitted input called prediction
[Abstract]
"A supervised surrogate classifier reproduced held-out cluster membership with high test performance (macro-F1 = 0.963), but was interpreted only as an explanatory surrogate rather than as an independent clinical prediction model."
The surrogate is explicitly trained on the K-means cluster labels derived from the identical 25 energy-adjusted features; its ability to 'reproduce' those labels on held-out data is therefore a direct test of how well the fitted unsupervised partition can be recovered, not an external check on whether the patterns are stable, dietetically meaningful, or linked to health outcomes.
full rationale
The paper's core chain is: NDNS nutrient features → K-means clustering (k=4 selected via internal metrics + subjective interpretability) → cluster labels → supervised surrogate trained to predict those labels → high held-out macro-F1 reported as evidence the framework works. This surrogate step matches the 'fitted input called prediction' pattern because the labels are generated from the same data and features; the high test performance therefore measures separability of the fitted clusters rather than independent validation of dietary patterns or clinical utility. No equations or self-citations create further circularity, and the unsupervised clustering itself uses standard methods without reducing to its outputs by definition. The result is partial circularity confined to the surrogate validation claim.
Axiom & Free-Parameter Ledger
free parameters (2)
- k (number of clusters) =
4
- feature set
axioms (2)
- domain assumption Clustering on these features produces stable and interpretable dietary patterns
- domain assumption The surrogate classifier's explanations via SHAP reflect meaningful dietary drivers
Lean theorems connected to this paper
-
IndisputableMonolith/Cost/FunctionalEquation.leanwashburn_uniqueness_aczel unclearK-means k=4 solution... macro-F1=0.963... SHAP analysis linked predictions to dietetically meaningful drivers
-
IndisputableMonolith/Foundation/AlexanderDuality.leanalexander_duality_circle_linking unclearsilhouette score of 0.0718... stability... dietetic interpretability
-
IndisputableMonolith/Foundation/ArithmeticFromLogic.leanLogicNat recovery unclear25 energy-adjusted nutrient and food-group features
Reference graph
Works this paper leans on
-
[1]
Current Opinion in Biotechnology 70, 91-96 (2021)
Bailey, R.L.: Overview of dietary assessment methods for measuring intakes of foods, beverages, and dietary supplements in research studies. Current Opinion in Biotechnology 70, 91-96 (2021). https://doi.org/10.1016/j.copbio.2021.02.007
-
[2]
Nutrition Reviews 62(5), 177-203 (2004)
Newby, P.K., Tucker, K.L.: Empirically derived eating patterns using factor or cluster analysis: a review. Nutrition Reviews 62(5), 177-203 (2004). https://doi.org/10.1111/j.1753- 4887.2004.tb00040.x
-
[3]
Current Opinion in Lipidology 13(1), 3-9 (2002)
Hu, F.B.: Dietary pattern analysis: a new direction in nutritional epidemiology. Current Opinion in Lipidology 13(1), 3-9 (2002). https://doi.org/10.1097/00041433-200202000-00002
-
[4]
British Journal of Nutrition 133, 987-1001 (2025)
Hutchinson, J.M., Raffoul, A., Pepetone, A., Andrade, L., Williams, T.E., McNaughton, S.A., Leech, R.M., Reedy, J., Shams-White, M.M., Vena, J.E., Dodd, K.W., Bodnar, L.M., Lamarche, B., Wallace, M.P., Deitchler, M., Hussain, S., Kirkpatrick, S.I.: Advances in methods for characterising dietary patterns: a scoping review. British Journal of Nutrition 133,...
-
[5]
Sosa-Holwerda, A., Park, O.H., Albracht-Schulte, K., Niraula, S., Thompson, L., Oldewage-Theron, W.: The role of artificial intelligence in nutrition research: a scoping review. Nutrients 16(13), 2066 (2024). https://doi.org/10.3390/nu16132066
-
[6]
Advances in Nutrition 16(4), 100398 (2025)
Wu, X., Oniani, D., Shao, Z., Arciero, P., Sivarajkumar, S., Hilsman, J., Mohr, A.E., Ibe, S., Moharir, M., Li, L.-J., Jain, R., Chen, J., Wang, Y.: A scoping review of artificial intelligence for precision nutrition. Advances in Nutrition 16(4), 100398 (2025). https://doi.org/10.1016/j.advnut.2025.100398
-
[7]
Current Opinion in Clinical Nutrition and Metabolic Care 27(2), 200-206 (2024)
Singer, P., Robinson, E., Raphaeli, O.: The future of artificial intelligence in clinical nutrition. Current Opinion in Clinical Nutrition and Metabolic Care 27(2), 200-206 (2024). https://doi.org/10.1097/MCO.0000000000000977
-
[8]
Oxford University Press, Oxford (2005)
Gibson, R.S.: Principles of Nutritional Assessment, 2nd edn. Oxford University Press, Oxford (2005)
work page 2005
-
[9]
Public Health England, London (2011)
Scientific Advisory Committee on Nutrition: Dietary Reference Values for Energy. Public Health England, London (2011)
work page 2011
- [10]
-
[11]
Journal of the American Dietetic Association 104(4), 615-635 (2004)
Kant, A.K.: Dietary patterns and health outcomes. Journal of the American Dietetic Association 104(4), 615-635 (2004). https://doi.org/10.1016/j.jada.2004.01.010
-
[12]
In: Proceedings of the Fifth Berkeley Symposium on Mathematical Statistics and Probability, pp
MacQueen, J.: Some methods for classification and analysis of multivariate observations. In: Proceedings of the Fifth Berkeley Symposium on Mathematical Statistics and Probability, pp. 281- 297 (1967)
work page 1967
-
[13]
Journal of the Royal Statistical Society: Series B 39(1), 1-38 (1977)
Dempster, A.P., Laird, N.M., Rubin, D.B.: Maximum likelihood from incomplete data via the EM algorithm. Journal of the Royal Statistical Society: Series B 39(1), 1-38 (1977)
work page 1977
-
[14]
Bishop, C.M.: Pattern Recognition and Machine Learning. Springer, New York (2006)
work page 2006
-
[15]
Probability inequalities for sums of bounded random variables
Ward, J.H.: Hierarchical grouping to optimize an objective function. Journal of the American Statistical Association 58(301), 236-244 (1963). https://doi.org/10.1080/01621459.1963.10500845
-
[16]
Journal of the Royal Statistical Society: Series B (Statistical Methodology) , volume =
Tibshirani, R., Walther, G., Hastie, T.: Estimating the number of clusters in a data set via the gap statistic. Journal of the Royal Statistical Society: Series B 63(2), 411-423 (2001). https://doi.org/10.1111/1467-9868.00293
-
[17]
Psychometrika 50, 159-179 (1985)
Milligan, G.W., Cooper, M.C.: An examination of procedures for determining the number of clusters in a data set. Psychometrika 50, 159-179 (1985). https://doi.org/10.1007/BF02294245
-
[18]
Rousseeuw, P.J.: Silhouettes: a graphical aid to the interpretation and validation of cluster analysis. Journal of Computational and Applied Mathematics 20, 53-65 (1987). https://doi.org/10.1016/0377-0427(87)90125-7
-
[19]
IEEE Transactions on Pattern Analysis and Machine Intelligence PAMI-1(2), 224-227 (1979)
Davies, D.L., Bouldin, D.W.: A cluster separation measure. IEEE Transactions on Pattern Analysis and Machine Intelligence PAMI-1(2), 224-227 (1979). https://doi.org/10.1109/TPAMI.1979.4766909
-
[20]
Communications in Statistics 3(1), 1-27 (1974)
Calinski, T., Harabasz, J.: A dendrite method for cluster analysis. Communications in Statistics 3(1), 1-27 (1974). https://doi.org/10.1080/03610927408827101
-
[21]
In: Advances in Neural Information Processing Systems 30, pp
Lundberg, S.M., Lee, S.I.: A unified approach to interpreting model predictions. In: Advances in Neural Information Processing Systems 30, pp. 4765-4774 (2017)
work page 2017
-
[22]
GOV.UK: National Diet and Nutrition Survey 2019 to 2023: report. Office for Health Improvement and Disparities, Department of Health and Social Care, and Food Standards Agency (2025)
work page 2019
-
[23]
UK Data Archive Study Number 6533
UK Data Service: National Diet and Nutrition Survey Years 1-15, 2008-2023. UK Data Archive Study Number 6533. https://doi.org/10.5255/UKDA-SN-6533-22
-
[24]
Journal of Machine Learning Research 12, 2825-2830 (2011)
Pedregosa, F., Varoquaux, G., Gramfort, A., Michel, V., Thirion, B., Grisel, O., et al.: Scikit-learn: machine learning in Python. Journal of Machine Learning Research 12, 2825-2830 (2011)
work page 2011
-
[25]
Hubert, L., Arabie, P.: Comparing partitions. Journal of Classification 2, 193-218 (1985). https://doi.org/10.1007/BF01908075
-
[26]
Breiman, L.: Random forests. Machine Learning 45, 5-32 (2001). https://doi.org/10.1023/A:1010933404324
-
[27]
Chen, T., Guestrin, C.: XGBoost: a scalable tree boosting system. In: Proceedings of the 22nd ACM SIGKDD International Conference on Knowledge Discovery and Data Mining, pp. 785-794 (2016). https://doi.org/10.1145/2939672.2939785
discussion (0)
Sign in with ORCID, Apple, or X to comment. Anyone can read and Pith papers without signing in.