Recognition: 2 theorem links
· Lean TheoremSGC-RML: A reliable and interpretable longitudinal assessment for PD in real-world DNS
Pith reviewed 2026-05-12 01:01 UTC · model grok-4.3
The pith
SGC-RML projects speech, gait and wearables into an 8D symptom space to produce calibrated, rejectable longitudinal Parkinson's assessments.
A machine-rendered reading of the paper's core claim, the machinery that carries it, and where it could break.
Core claim
The paper claims that mapping heterogeneous inputs (speech, gait, wearable motion, mobility tasks and clinical variables) to a shared 8-dimensional symptom node space (seven clinical symptom nodes plus one reliability_state auxiliary node) unifies motor and non-motor representations; when this mapping is paired with uncertainty estimation, conformal calibration and selective decision routing, the resulting model delivers accurate symptom and severity predictions while also rejecting unreliable assessments and suggesting retests, as shown by MAE 4.579 / R² 0.772 on PPMI, AUC 0.953 on mPower, AUC 0.825 on PADS, and the conversion of subject-independent settings into calibrated longitudinalones
What carries the argument
The 8-dimensional symptom node space (seven clinical nodes plus one reliability_state node) that unifies representations through a symptom atlas, together with conformal calibration and selective routing that decides whether to accept, reject or retest an assessment.
If this is right
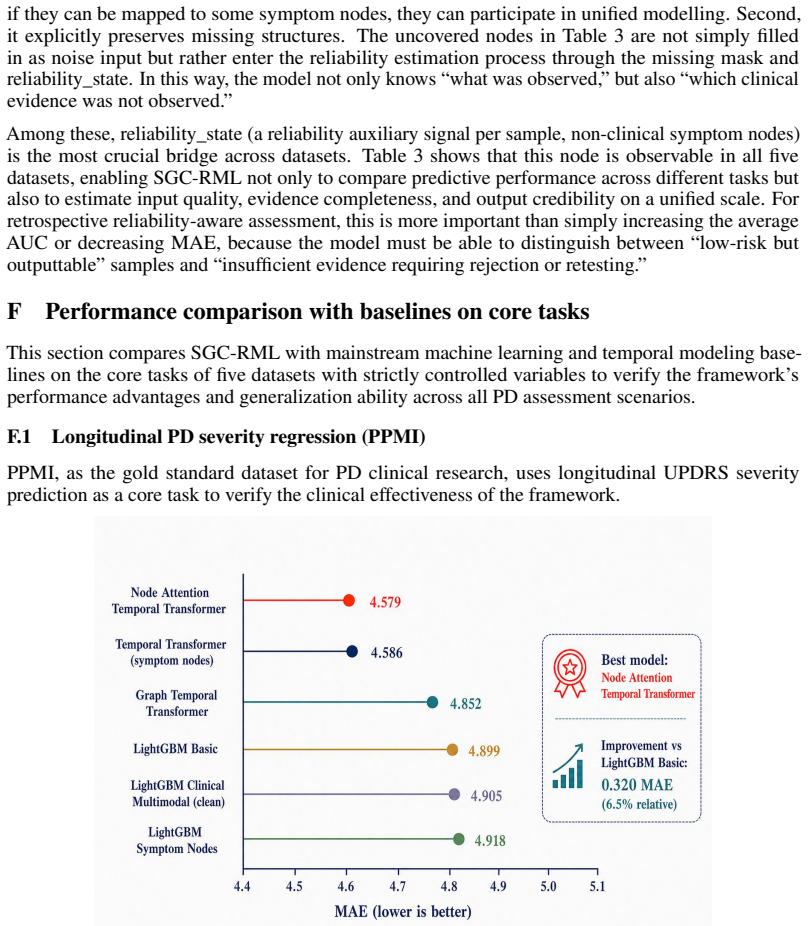
- The model reports MAE 4.579 and R² 0.772 on PPMI longitudinal severity prediction.
- It reaches AUC 0.953 on mPower and AUC 0.825 on PADS classification tasks.
- Five subject-specific anchors convert a non-predictive subject-independent motor task (MAE 8.38, CCC 0.02) into a calibrated longitudinal task (MAE 3.24, CCC 0.756) while holding conformal coverage at the 0.80 target.
- Under the Daphnet LOSO protocol the method achieves F1 0.803 and AUC 0.872 for event detection.
- Assessments are rejected or retests are recommended when the reliability_state node indicates insufficient evidence.
Where Pith is reading between the lines
- The same symptom-node approach could be tested on other neurodegenerative conditions that collect incomplete multimodal streams.
- If the seven clinical nodes prove faithful to standard rating scales, the atlas might enable direct comparison of symptom profiles across studies that use different sensors.
- The explicit reliability routing offers a practical way to audit AI outputs in clinical workflows by surfacing which symptom dimensions are driving each score.
- A follow-up study could measure whether clinicians change management decisions when shown both the symptom scores and the model's rejection flags.
Load-bearing premise
The invented 8-dimensional symptom node space accurately reflects real clinical symptom dimensions and the conformal plus routing steps keep coverage valid without hidden leakage across devices and incomplete labels.
What would settle it
A new real-world PD dataset with known ground-truth symptom scores where the model's conformal prediction sets fail to cover the true values at the stated rate (for example 80 percent) would falsify the reliability claims.
Figures


read the original abstract
Real-world digital Parkinson's disease assessment faces challenges such as heterogeneous modalities, cross-device bias, and incomplete labeling. Existing methods often focus on average predictive performance, lacking the reliability mechanisms needed for retrospective reliability-aware assessment - namely, determining when the model is reliable, when to reject an assessment, when to retest, and from which symptom dimensions the predictions are based. This paper proposes SGC-RML, which maps speech, gait, wearable motion, mobility tasks, and clinical variables to a shared 8-dimensional symptom node space (7 clinical symptom nodes and 1 reliability_state auxiliary node), unifying motor and non-motor representations through a symptom atlas. By jointly introducing uncertainty estimation, conformal calibration, and selective decision routing, the model can not only predict symptoms and severity but also reject assessments or suggest retests when evidence is insufficient. We validate this framework on five real-world PD datasets, covering classification, regression, event detection, and longitudinal severity prediction. Experiments show that SGC-RML achieves an MAE of 4.579 / R^2 of 0.772 on PPMI, an AUC of 0.953 on mPower, and an AUC of 0.825 on PADS. Under leak-free temporal anchoring, as few as 5 subject-specific anchors transform UCI from an essentially non-predictive subject-independent setting (motor MAE 8.38, CCC 0.02) into a calibrated longitudinal assessment (motor MAE 3.24, CCC 0.756) with split-conformal coverage held at the 0.80 target. Under the Daphnet LOSO protocol, it achieves an F1 of 0.803 / AUC of 0.872. These results demonstrate that SGC-RML provides a unified paradigm for accurate, calibrated, auditable, and symptom-interpretable retrospective longitudinal assessment of PD under incomplete multimodal conditions.
Editorial analysis
A structured set of objections, weighed in public.
Referee Report
Summary. The paper proposes SGC-RML, a framework that maps multimodal PD inputs (speech, gait, wearables, mobility tasks, clinical variables) to a shared 8-dimensional symptom node space (7 clinical symptom nodes plus 1 reliability_state auxiliary node) and augments this with joint uncertainty estimation, conformal calibration, and selective decision routing. The goal is to deliver accurate, calibrated, auditable, and symptom-interpretable retrospective longitudinal assessments under heterogeneous, incomplete real-world conditions. Experiments on five datasets report MAE 4.579 / R² 0.772 on PPMI, AUC 0.953 on mPower, AUC 0.825 on PADS, F1 0.803 / AUC 0.872 on Daphnet LOSO, and a transformation of subject-independent motor prediction (MAE 8.38, CCC 0.02) into calibrated longitudinal assessment (MAE 3.24, CCC 0.756) with 5 anchors while holding split-conformal coverage at the 0.80 target.
Significance. If the clinical fidelity of the 8D node space and the validity of the conformal guarantees can be substantiated, the work would offer a practically useful paradigm for reliability-aware digital PD monitoring, directly addressing the need for rejection/re-test mechanisms and symptom-level interpretability in incomplete multimodal settings.
major comments (3)
- [Abstract] Abstract: the 8-dimensional symptom node space (7 clinical + 1 reliability_state) is presented as the core unifying representation, yet no explicit definition, embedding equations, or mapping from raw modalities to the 7 clinical nodes is supplied; without this, the interpretability claim and the assertion that the atlas 'faithfully represents real clinical symptom dimensions' cannot be evaluated.
- [Abstract] Abstract and experimental section: no ablation studies, sensitivity analyses, or error breakdowns are reported that isolate the contribution of the reliability_state node, conformal calibration, or selective routing; the reported gains (e.g., the 5-anchor longitudinal improvement) therefore cannot be attributed to specific components.
- [Abstract] Abstract: the leak-free temporal anchoring and split-conformal coverage claims (0.80 target maintained) rest on an unstated exchangeability assumption across heterogeneous devices and incomplete labels; no verification of this assumption or checks for distribution shift are described, which directly affects the validity of the coverage guarantees.
minor comments (2)
- The abstract references five datasets but reports detailed metrics for only three; a summary table of all five would improve clarity.
- [Abstract] Acronyms SGC-RML, DNS, UCI, and PPMI are used without expansion on first appearance.
Simulated Author's Rebuttal
We thank the referee for the constructive and detailed feedback. We address each major comment below, indicating where we agree that revisions are needed to improve clarity, attribution of results, and discussion of assumptions. We will incorporate the suggested changes in the revised manuscript.
read point-by-point responses
-
Referee: [Abstract] Abstract: the 8-dimensional symptom node space (7 clinical + 1 reliability_state) is presented as the core unifying representation, yet no explicit definition, embedding equations, or mapping from raw modalities to the 7 clinical nodes is supplied; without this, the interpretability claim and the assertion that the atlas 'faithfully represents real clinical symptom dimensions' cannot be evaluated.
Authors: We agree that the abstract, being concise, does not include the explicit definitions, embedding equations, or modality-to-node mappings. The full manuscript describes the symptom atlas construction via graph convolutional networks and modality-specific encoders in the Methods, but to directly address evaluability of the interpretability and clinical fidelity claims, we will revise the abstract to include a brief formal definition of the 8D space and add explicit embedding equations plus a mapping diagram in the Methods section of the revised manuscript. revision: yes
-
Referee: [Abstract] Abstract and experimental section: no ablation studies, sensitivity analyses, or error breakdowns are reported that isolate the contribution of the reliability_state node, conformal calibration, or selective routing; the reported gains (e.g., the 5-anchor longitudinal improvement) therefore cannot be attributed to specific components.
Authors: The referee correctly notes the absence of ablations isolating the reliability_state node, conformal calibration, and selective routing. While the framework integrates these elements and reports overall performance metrics including the longitudinal gains under temporal anchoring, the current experiments do not decompose their individual contributions. We will add targeted ablation studies, sensitivity analyses, and component-wise error breakdowns to the experimental section in the revision to enable attribution of the observed improvements. revision: yes
-
Referee: [Abstract] Abstract: the leak-free temporal anchoring and split-conformal coverage claims (0.80 target maintained) rest on an unstated exchangeability assumption across heterogeneous devices and incomplete labels; no verification of this assumption or checks for distribution shift are described, which directly affects the validity of the coverage guarantees.
Authors: We acknowledge that split-conformal prediction relies on an exchangeability assumption that is not explicitly stated or verified in the manuscript for heterogeneous devices and incomplete labels. The leak-free temporal anchoring mitigates some temporal leakage, but distribution shifts across datasets could affect coverage validity. We will add an explicit discussion of the exchangeability assumption, its relevance to the reported 0.80 coverage, and any feasible empirical checks for distribution shift using the existing multi-dataset setup. Full verification across all device types may require supplementary experiments, which we will note as a limitation. revision: partial
Circularity Check
No significant circularity detected in derivation chain
full rationale
The paper introduces SGC-RML as a mapping from multimodal inputs to a proposed 8D symptom node space (7 clinical + 1 reliability_state), followed by uncertainty estimation, conformal calibration, and selective routing. These components are presented as architectural choices validated through empirical results on independent external datasets (PPMI regression, mPower/PADS classification, Daphnet event detection, and longitudinal anchoring). No equations, node definitions, or calibration procedures are shown to reduce outputs to inputs by construction; the 'leak-free temporal anchoring' with 5 anchors is described as an applied transformation rather than a fitted tautology. No load-bearing self-citations or uniqueness theorems from prior author work are invoked to justify the core claims. The framework remains self-contained against external benchmarks and falsifiable via the reported MAE/R²/AUC/F1 metrics.
Axiom & Free-Parameter Ledger
invented entities (2)
-
8-dimensional symptom node space
no independent evidence
-
reliability_state auxiliary node
no independent evidence
Lean theorems connected to this paper
-
IndisputableMonolith/Foundation/AlexanderDuality.leanalexander_duality_circle_linking unclear?
unclearRelation between the paper passage and the cited Recognition theorem.
maps ... to a shared 8-dimensional symptom node space (7 clinical symptom nodes and 1 reliability_state auxiliary node)
-
IndisputableMonolith/Cost/FunctionalEquation.leanwashburn_uniqueness_aczel unclear?
unclearRelation between the paper passage and the cited Recognition theorem.
split-conformal coverage held at the 0.80 target
What do these tags mean?
- matches
- The paper's claim is directly supported by a theorem in the formal canon.
- supports
- The theorem supports part of the paper's argument, but the paper may add assumptions or extra steps.
- extends
- The paper goes beyond the formal theorem; the theorem is a base layer rather than the whole result.
- uses
- The paper appears to rely on the theorem as machinery.
- contradicts
- The paper's claim conflicts with a theorem or certificate in the canon.
- unclear
- Pith found a possible connection, but the passage is too broad, indirect, or ambiguous to say the theorem truly supports the claim.
Reference graph
Works this paper leans on
-
[1]
E. R. Dorsey, T. Sherer, M. S. Okun, and B. R. Bloem. The emerging evidence of the Parkinson pandemic.Journal of Parkinson’s Disease, 8(s1):S3–S8, 2018. doi: 10.3233/JPD-181474
-
[2]
D. Su et al. Projections for prevalence of Parkinson’s disease and its driving factors in 195 countries and territories to 2050: Modelling study of Global Burden of Disease Study 2021. BMJ, 388:e080952, 2025. doi: 10.1136/bmj-2024-080952
-
[3]
C. G. Goetz et al. Movement Disorder Society-sponsored revision of the Unified Parkinson’s Disease Rating Scale: Scale presentation and clinimetric testing results.Movement Disorders, 23(15):2129–2170, 2008. doi: 10.1002/mds.22340
-
[4]
T. Baltrušaitis, C. Ahuja, and L.-P. Morency. Multimodal machine learning: A survey and taxonomy.IEEE Transactions on Pattern Analysis and Machine Intelligence, 41(2):423–443,
-
[5]
doi: 10.1109/TPAMI.2018.2798607
- [6]
-
[7]
C. Guo, G. Pleiss, Y . Sun, and K. Q. Weinberger. On calibration of modern neural networks. In Proceedings of the 34th International Conference on Machine Learning, volume 70 ofPMLR, pages 1321–1330, 2017
work page 2017
-
[8]
V . V ovk, A. Gammerman, and G. Shafer.Algorithmic Learning in a Random World. Springer, New York, 2005. doi: 10.1007/b106715
-
[9]
A. N. Angelopoulos and S. Bates. Conformal prediction: A gentle introduction.Foundations and Trends in Machine Learning, 16(4):494–591, 2023. doi: 10.1561/2200000101
-
[10]
Y . Geifman and R. El-Yaniv. SelectiveNet: A deep neural network with an integrated reject option. InProceedings of the 36th International Conference on Machine Learning, volume 97 ofPMLR, 2019
work page 2019
-
[11]
B. M. Bot et al. The mPower study, Parkinson disease mobile data collected using ResearchKit. Scientific Data, 3:160011, 2016. doi: 10.1038/sdata.2016.11
-
[12]
K. Marek et al. The Parkinson Progression Marker Initiative.Progress in Neurobiology, 95(4):629–635, 2011. doi: 10.1016/j.pneurobio.2011.09.005
-
[13]
A. Tsanas, M. A. Little, P. E. McSharry, and L. O. Ramig. Accurate telemonitoring of Parkin- son’s disease progression by noninvasive speech tests.IEEE Transactions on Biomedical Engineering, 57(4):884–893, 2010. doi: 10.1109/TBME.2009.2036000
-
[14]
M. Bächlin et al. Wearable assistant for Parkinson’s disease patients with the freezing of gait symptom.IEEE Transactions on Information Technology in Biomedicine, 14(2):436–446, 2010. doi: 10.1109/TITB.2009.2036165
-
[15]
J. Varghese et al. Machine learning in the Parkinson’s disease smartwatch (PADS) dataset.npj Parkinson’s Disease, 10:9, 2024. doi: 10.1038/s41531-023-00625-7
-
[16]
Medical domain knowledge in domain-agnostic generative AI.npj Digital Medicine, 5(1):90, 2022
L. Lonini et al. Wearable sensors for Parkinson’s disease: Which data are worth collecting for training symptom detection models.npj Digital Medicine, 1:64, 2018. doi: 10.1038/s41746- 018-0071-z
-
[17]
C. Moreau et al. Overview on wearable sensors for the management of Parkinson’s disease.npj Parkinson’s Disease, 9(1):153, 2023. doi: 10.1038/s41531-023-00585-y
-
[18]
A. Kendall and Y . Gal. What uncertainties do we need in Bayesian deep learning for computer vision? InAdvances in Neural Information Processing Systems, volume 30, 2017
work page 2017
-
[19]
Y . Geifman and R. El-Yaniv. Selective classification for deep neural networks. InAdvances in Neural Information Processing Systems, volume 30, 2017. arXiv: 1705.08500. 10
-
[20]
M. T. Ribeiro, S. Singh, and C. Guestrin. “Why should I trust you?”: Explaining the predictions of any classifier. InProceedings of the 22nd ACM SIGKDD International Conference on Knowl- edge Discovery and Data Mining, pages 1135–1144, 2016. doi: 10.1145/2939672.2939778
-
[21]
S. M. Lundberg and S.-I. Lee. A unified approach to interpreting model predictions. InAdvances in Neural Information Processing Systems, volume 30, 2017
work page 2017
-
[22]
A ttention is not E xplanation
S. Jain and B. C. Wallace. Attention is not Explanation. InProceedings of the 2019 Conference of the North American Chapter of the Association for Computational Linguistics: Human Language Technologies, pages 3543–3556, 2019. doi: 10.18653/v1/N19-1357
-
[23]
Investigating the Effectiveness of BPE: The Power of Shorter Sequences
S. Wiegreffe and Y . Pinter. Attention is not not Explanation. InProceedings of the 2019 Conference on Empirical Methods in Natural Language Processing and the 9th International Joint Conference on Natural Language Processing, pages 11–20, 2019. doi: 10.18653/v1/D19- 1002
-
[24]
P. E. Shrout and J. L. Fleiss. Intraclass correlations: Uses in assessing rater reliability.Psycho- logical Bulletin, 86(2):420–428, 1979. doi: 10.1037/0033-2909.86.2.420
-
[25]
D. Roggen, M. Plotnik, and J. M. Hausdorff. Daphnet Freezing of Gait dataset. UCI Machine Learning Repository, 2013. doi: 10.24432/C56K78
-
[26]
Y . Nie, N. H. Nguyen, P. Sinthong, and J. Kalagnanam. A time series is worth 64 words: Long- term forecasting with transformers. InInternational Conference on Learning Representations,
-
[27]
Y . Gorishniy, I. Rubachev, V . Khrulkov, and A. Babenko. Revisiting deep learning models for tabular data. InAdvances in Neural Information Processing Systems, volume 34, 2021
work page 2021
- [28]
-
[29]
B. Lakshminarayanan, A. Pritzel, and C. Blundell. Simple and scalable predictive uncertainty estimation using deep ensembles. InAdvances in Neural Information Processing Systems, volume 30, 2017
work page 2017
- [30]
-
[31]
Y . Ovadia et al. Can you trust your model’s uncertainty? Evaluating predictive uncertainty under dataset shift. InAdvances in Neural Information Processing Systems, volume 32, 2019
work page 2019
-
[32]
A Baseline for Detecting Misclassified and Out-of-Distribution Examples in Neural Networks
D. Hendrycks and K. Gimpel. A baseline for detecting misclassified and out-of-distribution examples in neural networks. InInternational Conference on Learning Representations, 2017. arXiv: 1610.02136
work page internal anchor Pith review arXiv 2017
-
[33]
R. El-Yaniv and Y . Wiener. On the foundations of noise-free selective classification.Journal of Machine Learning Research, 11(53):1605–1641, 2010
work page 2010
-
[34]
M. Pakdaman Naeini, G. F. Cooper, and M. Hauskrecht. Obtaining well calibrated probabilities using Bayesian binning. InProceedings of the AAAI Conference on Artificial Intelligence, 29(1),
-
[35]
doi: 10.1609/aaai.v29i1.9602
-
[36]
R. J. Tibshirani, R. F. Barber, E. J. Candès, and A. Ramdas. Conformal prediction under covariate shift. InAdvances in Neural Information Processing Systems, volume 32, 2019
work page 2019
-
[37]
A. Vaswani et al. Attention is all you need. InAdvances in Neural Information Processing Systems, volume 30, 2017
work page 2017
-
[38]
P. Veliˇckovi´c, G. Cucurull, A. Casanova, A. Romero, P. Liò, and Y . Bengio. Graph attention networks. InInternational Conference on Learning Representations, 2018. arXiv: 1710.10903
work page internal anchor Pith review Pith/arXiv arXiv 2018
-
[39]
Neural Computation 9(8), 1735–1780 (1997)
S. Hochreiter and J. Schmidhuber. Long short-term memory.Neural Computation, 9(8):1735– 1780, 1997. doi: 10.1162/neco.1997.9.8.1735. 11
-
[40]
Z. Yue, Y . Wang, J. Duan, T. Yang, C. Huang, Y . Tong, and B. Xu. TS2Vec: Towards universal representation of time series. InProceedings of the AAAI Conference on Artificial Intelligence, 36(8):8980–8987, 2022. doi: 10.1609/aaai.v36i8.20881
-
[41]
Q. Wen, T. Zhou, C. Zhang, W. Chen, Z. Ma, J. Yan, and L. Sun. Transformers in time series: A survey. InProceedings of the Thirty-Second International Joint Conference on Artificial Intelligence, pages 6778–6786, 2023. doi: 10.24963/ijcai.2023/759
-
[42]
Y . Sun, X. Wang, Z. Liu, J. Miller, A. A. Efros, and M. Hardt. Test-time training with self- supervision for generalization under distribution shifts. InProceedings of the 37th International Conference on Machine Learning, volume 119 ofPMLR, pages 9229–9248, 2020
work page 2020
-
[43]
M. A. Little, P. E. McSharry, E. J. Hunter, J. Spielman, and L. O. Ramig. Suitability of dysphonia measurements for telemonitoring of Parkinson’s disease.IEEE Transactions on Biomedical Engineering, 56(4):1015–1022, 2009. doi: 10.1109/TBME.2008.2005954
-
[44]
B. E. Sakar, M. E. Isenkul, C. O. Sakar, A. Sertbas, F. Gurgen, S. Delil, H. Apaydin, and O. Kursun. Collection and analysis of a Parkinson speech dataset with multiple types of sound recordings.IEEE Journal of Biomedical and Health Informatics, 17(4):828–834, 2013. doi: 10.1109/JBHI.2013.2245674
-
[45]
J. Camps et al. Deep learning for freezing of gait detection in Parkinson’s disease patients in their homes using a waist-worn inertial measurement unit.Knowledge-Based Systems, 139:119–131,
-
[46]
doi: 10.1016/j.knosys.2017.10.017
-
[47]
L. Sigcha, N. Costa, I. Pavón, S. Costa, P. Arezes, J. M. López, and G. de Arcas. Deep learning approaches for detecting freezing of gait in Parkinson’s disease patients through on-body acceleration sensors.Sensors, 20(7):1895, 2020. doi: 10.3390/s20071895
-
[48]
A. J. Espay et al. Technology in Parkinson’s disease: Challenges and opportunities.Movement Disorders, 31(9):1272–1282, 2016. doi: 10.1002/mds.26642
-
[49]
S. Patel, H. Park, P. Bonato, L. Chan, and M. Rodgers. A review of wearable sensors and systems with application in rehabilitation.Journal of NeuroEngineering and Rehabilitation, 9:21, 2012. doi: 10.1186/1743-0003-9-21
-
[50]
J. C. Latourelle et al. Large-scale identification of clinical and genetic predictors of motor progression in patients with newly diagnosed Parkinson’s disease: A longitudinal cohort study and validation.The Lancet Neurology, 16(11):908–916, 2017. doi: 10.1016/S1474- 4422(17)30328-9
-
[51]
B. R. Bloem, M. S. Okun, and C. Klein. Parkinson’s disease.The Lancet, 397(10291):2284– 2303, 2021. doi: 10.1016/S0140-6736(21)00218-X
-
[52]
J. N. Acosta, G. J. Falcone, P. Rajpurkar, and E. J. Topol. Multimodal biomedical AI.Nature Medicine, 28(9):1773–1784, 2022. doi: 10.1038/s41591-022-01981-2
-
[53]
S. G. Finlayson, A. Subbaswamy, K. Singh, J. Bowers, A. Kupke, J. Zittrain, I. S. Kohane, and S. Saria. The clinician and dataset shift in artificial intelligence.New England Journal of Medicine, 385(3):283–286, 2021. doi: 10.1056/NEJMc2104626. Appendix A Dataset-specific implementation details A.1 Dataset-specific objectives PADS objective.For PADS, the ...
-
[54]
The basic sample-level classification baseline V1 only achieves an AUC of 0.623, while subject-level aggregation (V2) brings a significant AUC improvement of+0.148, directly proving the necessity of subject-level modeling for PD assessment and solving the noise interference problem of sample-level prediction
-
[55]
The newly added GAT symptom-map module (V3) validates the effectiveness of clinical- prior constraints, introducing structured symptom dependencies into the model and achieving 19 an AUC improvement of +0.081 relative to V1, laying the foundation for interpretable modeling
-
[56]
The largest single jump comes from V2 (subject-level aggregation, +0.148 AUC vs
Frozen-encoder transfer (V4), leak-free clean retraining (V5c), and SSL pretraining [ 38] (V6) collectively raise AUC into the 0.79–0.80 band, although the trajectory isnot strictly monotonic(V3 GAT regresses to 0.704; V6 SSL is essentially flat versus V5c). The largest single jump comes from V2 (subject-level aggregation, +0.148 AUC vs. V1) and V5c (leak...
-
[57]
knowing when to be credible, when to reject, and why to make the judgment
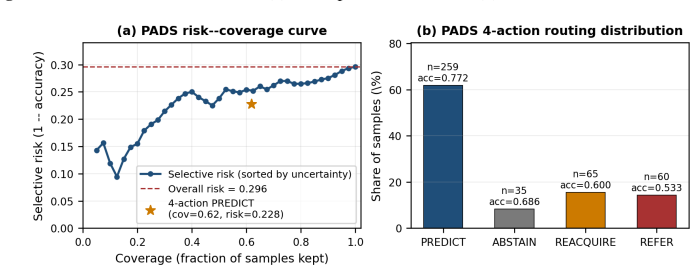
The multi-task Quality Head (V7) provides a modest AUC gain of +0.009 over V6. Rather than being the primary driver of predictive accuracy, V7’s role is to expose an explicit acquisition-quality signal that the downstream 4-action router can use; the Quality Head is therefore better characterised as anenabling component for reliability routing, not as the...
work page 2024
-
[58]
Institutional review board (IRB) approvals or equivalent for research with human subjects Question: Does the paper describe potential risks incurred by study participants, whether such risks were disclosed to the subjects, and whether Institutional Review Board (IRB) approvals (or an equivalent approval/review based on the requirements of your country or ...
discussion (0)
Sign in with ORCID, Apple, or X to comment. Anyone can read and Pith papers without signing in.