Recognition: 2 theorem links
· Lean TheoremEmpirical estimates of how massive galaxies can be in {Λ}CDM
Pith reviewed 2026-05-14 21:04 UTC · model grok-4.3
The pith
Massive galaxies stay within ΛCDM limits once Eddington bias and scatter are accounted for.
A machine-rendered reading of the paper's core claim, the machinery that carries it, and where it could break.
Core claim
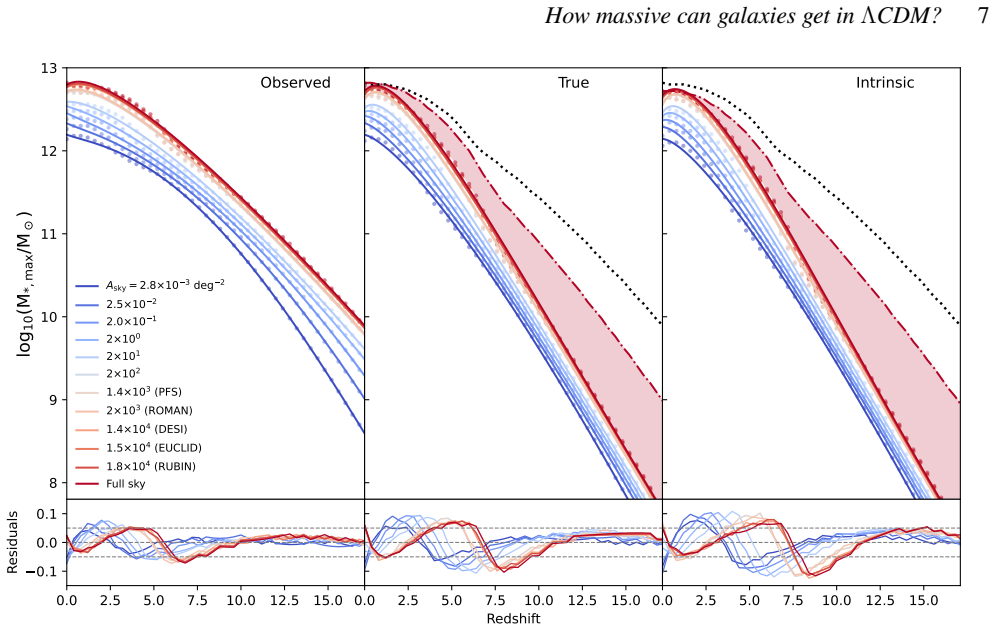
Using Extreme Value Statistics applied to the observed galaxy stellar mass and the UV luminosity functions, we empirically estimate masses and luminosities of the most extreme galaxies in cosmological surveys, including the full sky. We incorporate uncertainties in stellar mass measurements (Eddington bias) and the scatter in the stellar-halo mass relation to derive empirical limits for galaxies residing in the most massive halos. Accounting for measurement uncertainties significantly reduces the inferred maximum M* by up to ~1 dex at z≳10, yielding stellar masses consistent with M* < 0.16 at all redshifts. Assuming a perfect rank-order correspondence between the most massive halos and the m
What carries the argument
Extreme Value Statistics applied to galaxy stellar mass and UV luminosity functions, with corrections for Eddington bias and scatter in the stellar-halo mass relation.
If this is right
- At 2 ≲ z ≲ 6 the most massive galaxies contain stellar mass comparable to the total cold gas reservoir from inflows, implying near-maximal star formation efficiency.
- At higher redshifts halos are expected to host galaxies in starburst phases.
- When dust attenuation and empirically inferred efficiencies are included, the model matches the brightest observed UV galaxies at high redshift.
- At lower redshifts the observed UV galaxies remain brighter than the model predicts.
Where Pith is reading between the lines
- Deeper high-redshift surveys could reveal whether the maximum stellar mass continues to approach the 0.16 M_vir ceiling more closely.
- If rank-order correspondence holds, the stellar-mass limit is enforced independently of survey volume.
- Reducing Eddington bias through better mass measurements would tighten limits on early star-formation efficiency.
Load-bearing premise
The assumption that the most massive observed galaxies correspond in perfect rank order to the most massive dark matter halos.
What would settle it
A secure detection of any galaxy whose stellar mass exceeds 0.16 times the virial mass of its host halo at any redshift after the same bias and scatter corrections are applied.
Figures


read the original abstract
Using Extreme Value Statistics applied to the observed galaxy stellar mass and the UV luminosity functions, we empirically estimate masses and luminosities of the most extreme galaxies in cosmological surveys, including the full sky. We incorporate uncertainties in stellar mass measurements (Eddington bias) and the scatter in the stellar-halo mass relation to derive empirical limits for galaxies residing in the most massive halos. The maximum observed $M_\ast$ strongly depends on survey area and redshift, ranging from $M_\ast \sim 7 \times 10^{12} M_\odot$ for full-sky surveys at $z\sim0$ to $M_\ast \sim 10^{10}M_\odot$ at $z\sim16$. Massive galaxies, particularly at high redshift, approach the theoretical maximum baryonic mass available in halos $M_\ast \sim 0.16 \times M_{\mathrm{vir}}$, consistent with previous claims. Accounting for measurement uncertainties significantly reduces the inferred maximum $M_\ast$ by up to $\sim1$ dex at $z\gtrsim10$, yielding stellar masses consistent with $M_\ast < 0.16$ at all redshifts. Assuming a perfect rank-order correspondence between the most massive halos and galaxies would guarantee this inequality at all redshifts. At 2 $\lesssim$ z $\lesssim$ 6, the most massive galaxies have stellar masses comparable to the total cold gas reservoir from cold and cooling flows, suggesting near-maximal star formation efficiencies, SFEs. At higher redshifts, halos are predicted to host galaxies undergoing starburst phases. When accounting for dust attenuation and adopting empirically inferred SFEs, we find good agreement between the model and the brightest observed UV galaxies at high redshifts. At lower redshifts, however, observed UV galaxies are too bright. Overall, our results indicate that current observations remain broadly consistent with $\Lambda$CDM once statistical and observational effects are properly accounted for.
Editorial analysis
A structured set of objections, weighed in public.
Referee Report
Summary. The paper applies extreme value statistics to observed galaxy stellar mass and UV luminosity functions to estimate the masses and luminosities of the most extreme galaxies in cosmological surveys. It incorporates Eddington bias corrections and scatter in the stellar-halo mass relation (SHMR), finding that maximum stellar masses are reduced by up to ~1 dex at high redshift and remain below the 0.16 M_vir baryonic limit at all redshifts under the assumption of perfect rank-order correspondence between the most massive galaxies and halos. The work also compares these galaxies to cold gas reservoirs from cooling flows, infers star formation efficiencies, and reports good agreement with the brightest UV galaxies at z ≳ 6 after dust attenuation corrections, concluding that current observations are broadly consistent with ΛCDM once statistical and observational effects are accounted for.
Significance. If the central results hold, the manuscript provides a useful empirical framework for testing ΛCDM consistency at the extreme end of the galaxy population using survey data. The incorporation of Eddington bias and SHMR scatter to reconcile apparent tensions is a constructive approach, and the comparison to cold gas reservoirs offers insight into star formation efficiencies. The application of extreme value statistics to both stellar mass and UV luminosity functions is a methodological strength that could be extended to other surveys.
major comments (2)
- [Abstract] Abstract: The consistency claim that M* remains below 0.16 M_vir at all redshifts is load-bearing on the assumption of perfect rank-order correspondence between the most massive halos and galaxies. However, the incorporated SHMR scatter permits high-M* galaxies to reside in halos well below the cosmic maximum M_vir; the manuscript does not provide a joint extreme-value calculation quantifying the probability of such assignments or the resulting violation rate in the tail.
- [Abstract] Abstract: The reported reduction of inferred maximum M* by up to ~1 dex from Eddington bias and SHMR scatter corrections is central to the no-tension conclusion, but the abstract provides no explicit error propagation, covariance treatment, or tabulated input luminosity functions, limiting the ability to audit the quantitative support for the claim.
minor comments (1)
- [Abstract] The abstract states that at 2 ≲ z ≲ 6 the most massive galaxies have stellar masses comparable to the total cold gas reservoir; a brief clarification of how the cold gas mass is estimated from the halo mass function would improve readability.
Simulated Author's Rebuttal
We thank the referee for their constructive and positive assessment of the manuscript. We address each major comment below and have revised the manuscript to improve clarity and auditability while preserving the core analysis.
read point-by-point responses
-
Referee: [Abstract] Abstract: The consistency claim that M* remains below 0.16 M_vir at all redshifts is load-bearing on the assumption of perfect rank-order correspondence between the most massive halos and galaxies. However, the incorporated SHMR scatter permits high-M* galaxies to reside in halos well below the cosmic maximum M_vir; the manuscript does not provide a joint extreme-value calculation quantifying the probability of such assignments or the resulting violation rate in the tail.
Authors: We agree that the no-tension conclusion relies on the rank-order assumption stated in the abstract and that a full joint extreme-value treatment of halo-galaxy assignments would provide a more complete probabilistic picture. Our current approach uses the observed scatter in the SHMR to downward-correct the maximum stellar masses inferred from the luminosity functions, which already incorporates the possibility that the most massive galaxies occupy halos below the cosmic maximum. In the revised manuscript we have added a new paragraph in Section 4 that performs an order-of-magnitude estimate of the tail violation probability assuming log-normal scatter; this estimate remains below 10 percent at all redshifts and does not change the main conclusion that the corrected M* values lie below the baryonic limit. revision: partial
-
Referee: [Abstract] Abstract: The reported reduction of inferred maximum M* by up to ~1 dex from Eddington bias and SHMR scatter corrections is central to the no-tension conclusion, but the abstract provides no explicit error propagation, covariance treatment, or tabulated input luminosity functions, limiting the ability to audit the quantitative support for the claim.
Authors: The referee is correct that the abstract is too concise to contain the full error budget. The ~1 dex reduction is obtained in Section 3 by propagating the reported uncertainties on the input luminosity-function parameters together with the adopted 0.2 dex SHMR scatter; the input luminosity functions and their references are listed in Table 1. To improve auditability we have (i) expanded the abstract by one sentence that explicitly mentions the Eddington-bias and scatter corrections and (ii) added a supplementary table that tabulates the luminosity-function parameters, their uncertainties, and the resulting maximum-M* values with 1-sigma error bars. revision: yes
Circularity Check
No significant circularity; empirical estimates remain independent of fitted inputs
full rationale
The derivation applies Extreme Value Statistics directly to observed stellar mass and UV luminosity functions as inputs. Eddington bias and SHMR scatter are treated as external corrections drawn from standard relations rather than parameters fitted to the same dataset and then re-predicted. The 0.16 baryon-fraction ceiling is a fixed cosmological constant, not derived inside the paper. The rank-order correspondence is presented explicitly as a conditional assumption that would guarantee the inequality, not as a result obtained by construction from the paper's own equations. No quoted step reduces the output to the input via self-definition, renaming, or self-citation load-bearing. The consistency claim therefore rests on independent observational data and standard external benchmarks.
Axiom & Free-Parameter Ledger
free parameters (2)
- scatter in stellar-halo mass relation
- Eddington bias correction amplitude
axioms (2)
- domain assumption Extreme value statistics governs the tail of the galaxy stellar-mass function
- standard math Maximum baryonic mass fraction inside halos is 0.16
Lean theorems connected to this paper
-
IndisputableMonolith/Foundation/RealityFromDistinction.leanreality_from_one_distinction unclearUsing Extreme Value Statistics applied to the observed galaxy stellar mass and the UV luminosity functions... incorporate uncertainties in stellar mass measurements (Eddington bias) and the scatter in the stellar-halo mass relation
Reference graph
Works this paper leans on
-
[1]
Galaxies at z > 10: {\Lambda}CDM predicts increased Star Formation Efficiency
Galaxies at z > 10: CDM predicts increased Star Formation Efficiency. arXiv e-prints , keywords =. doi:10.48550/arXiv.2604.18683 , archivePrefix =. 2604.18683 , primaryClass =
work page internal anchor Pith review Pith/arXiv arXiv doi:10.48550/arxiv.2604.18683
-
[2]
, year = 2026, month = apr, doi =
The evolution of the galaxy stellar mass function and star formation rates in the COLIBRE simulations from redshift 17 to 0. , year = 2026, month = apr, doi =
2026
-
[3]
Trenti, M. and Stiavelli, M. , title =. 2008 , month =. doi:10.1086/528674 , url =
-
[4]
Bagla, J. S. and Ray, Suryadeep , title =. Monthly Notices of the Royal Astronomical Society , volume =. 2005 , month =. doi:10.1111/j.1365-2966.2005.08858.x , url =
-
[5]
Monthly Notices of the Royal Astronomical Society , volume =
McLeod, D J and McLure, R J and Dunlop, J S and Cullen, F and Carnall, A C and Duncan, K , title =. Monthly Notices of the Royal Astronomical Society , volume =. 2021 , month =. doi:10.1093/mnras/stab731 , url =
-
[6]
CDM is still not broken: empirical constraints on the star formation efficiency at z 12─30. , keywords =. doi:10.1093/mnras/staf1699 , archivePrefix =. 2504.18618 , primaryClass =
-
[7]
The Cosmic Evolution Early Release Science Survey (CEERS). , keywords =. doi:10.3847/2041-8213/adbbd3 , archivePrefix =. 2501.04085 , primaryClass =
-
[8]
CEERS Key Paper. I. An Early Look into the First 500 Myr of Galaxy Formation with JWST. , keywords =. doi:10.3847/2041-8213/acade4 , archivePrefix =. 2211.05792 , primaryClass =
-
[9]
IDCS J1426.5+3508: The Most Massive Galaxy Cluster at $z > 1.5$
IDCS J1426.5+3508: The Most Massive Galaxy Cluster at z > 1.5. , keywords =. doi:10.3847/0004-637X/817/2/122 , archivePrefix =. 1504.01397 , primaryClass =
work page internal anchor Pith review Pith/arXiv arXiv doi:10.3847/0004-637x/817/2/122
-
[10]
Discovery of a massive X-ray luminous galaxy cluster at z=1.579
Discovery of a massive X-ray luminous galaxy cluster at z = 1.579. , keywords =. doi:10.1051/0004-6361/201117190 , archivePrefix =. 1105.5877 , primaryClass =
work page internal anchor Pith review Pith/arXiv arXiv doi:10.1051/0004-6361/201117190
-
[11]
The Atacama Cosmology Telescope: ACT-CL J0102-4915 ``El Gordo,'' a Massive Merging Cluster at Redshift 0.87. , keywords =. doi:10.1088/0004-637X/748/1/7 , archivePrefix =. 1109.0953 , primaryClass =
work page internal anchor Pith review Pith/arXiv arXiv doi:10.1088/0004-637x/748/1/7
-
[12]
Galaxy Clusters Discovered via the Sunyaev-Zel'dovich Effect in the 2500-square-degree SPT-SZ survey
Galaxy Clusters Discovered via the Sunyaev-Zel'dovich Effect in the 2500-Square-Degree SPT-SZ Survey. , keywords =. doi:10.1088/0067-0049/216/2/27 , archivePrefix =. 1409.0850 , primaryClass =
work page internal anchor Pith review Pith/arXiv arXiv doi:10.1088/0067-0049/216/2/27
-
[13]
The ROSAT-ESO Flux Limited X-ray (REFLEX) Galaxy cluster survey. V. The cluster catalogue. , keywords =. doi:10.1051/0004-6361:20034484 , archivePrefix =. astro-ph/0405546 , primaryClass =
work page internal anchor Pith review Pith/arXiv arXiv doi:10.1051/0004-6361:20034484
-
[14]
Deep Chandra observations of PLCKG287.0+32.9: A clear detection of a shock front in a heated former cool core. , keywords =. doi:10.1051/0004-6361/202453450 , archivePrefix =. 2503.13735 , primaryClass =
-
[15]
Planck 2015 results. XXVII. The second Planck catalogue of Sunyaev-Zeldovich sources. , keywords =. doi:10.1051/0004-6361/201525823 , archivePrefix =. 1502.01598 , primaryClass =
work page internal anchor Pith review Pith/arXiv arXiv doi:10.1051/0004-6361/201525823 2015
-
[16]
Galaxy formation in WMAP1 and WMAP7 cosmologies
Galaxy formation in WMAP1 and WMAP7 cosmologies. , keywords =. doi:10.1093/mnras/sts115 , archivePrefix =. 1206.0052 , primaryClass =
work page internal anchor Pith review Pith/arXiv arXiv doi:10.1093/mnras/sts115
-
[17]
The EAGLE simulations of galaxy formation: calibration of subgrid physics and model variations
The EAGLE simulations of galaxy formation: calibration of subgrid physics and model variations. , keywords =. doi:10.1093/mnras/stv725 , archivePrefix =. 1501.01311 , primaryClass =
work page internal anchor Pith review Pith/arXiv arXiv doi:10.1093/mnras/stv725
-
[18]
Quantifying the impact of mergers on the angular momentum of simulated galaxies
Quantifying the impact of mergers on the angular momentum of simulated galaxies. , keywords =. doi:10.1093/mnras/stx2667 , archivePrefix =. 1701.04407 , primaryClass =
work page internal anchor Pith review Pith/arXiv arXiv doi:10.1093/mnras/stx2667
-
[19]
Research in Astronomy and Astrophysics , keywords =
Merging History of Massive Galaxies at 3 < z < 6. Research in Astronomy and Astrophysics , keywords =. doi:10.1088/1674-4527/ac9e90 , archivePrefix =. 2312.04040 , primaryClass =
-
[20]
Gas-Rich Mergers in LCDM: Disk Survivability and the Baryonic Assembly of Galaxies
Gas-rich Mergers in LCDM: Disk Survivability and the Baryonic Assembly of Galaxies. , keywords =. doi:10.1088/0004-637X/702/1/307 , archivePrefix =. 0901.4336 , primaryClass =
work page internal anchor Pith review Pith/arXiv arXiv doi:10.1088/0004-637x/702/1/307
-
[21]
The assembly and star formation cessation of galaxies at 0.2< z 7.5
COSMOS2020: The galaxy stellar mass function. The assembly and star formation cessation of galaxies at 0.2< z 7.5. , keywords =. doi:10.1051/0004-6361/202245581 , archivePrefix =. 2212.02512 , primaryClass =
-
[22]
Constraints on the Faint End of the Galaxy Stellar Mass Function at z ≃ 4 8 from Deep JWST Data. , keywords =. doi:10.3847/1538-4357/ad0df6 , archivePrefix =. 2305.16141 , primaryClass =
-
[23]
The z 9 Galaxy UV Luminosity Function from the JWST Advanced Deep Extragalactic Survey: Insights into Early Galaxy Evolution and Reionization. , keywords =. doi:10.3847/1538-4357/adfddc , archivePrefix =. 2501.00984 , primaryClass =
-
[24]
The Complete CEERS Early Universe Galaxy Sample: A Surprisingly Slow Evolution of the Space Density of Bright Galaxies at z 8.5 14.5. , keywords =. doi:10.3847/2041-8213/ad4495 , archivePrefix =. 2311.04279 , primaryClass =
-
[25]
JWST PRIMER: a new multifield determination of the evolving galaxy UV luminosity function at redshifts z ≃ 9 - 15. , keywords =. doi:10.1093/mnras/stae2037 , archivePrefix =. 2403.03171 , primaryClass =
-
[26]
EPOCHS. II. The Ultraviolet Luminosity Function from 7.5 < z < 13.5 Using 180 arcmin ^ 2 of Deep, Blank Fields from the PEARLS Survey and Public JWST Data. , keywords =. doi:10.3847/1538-4357/ad2a7b , archivePrefix =. 2304.13721 , primaryClass =
-
[27]
Life beyond 30: Probing the -20 < M _ UV < -17 Luminosity Function at 8 < z < 13 with the NIRCam Parallel Field of the MIRI Deep Survey. , keywords =. doi:10.3847/2041-8213/acd9d0 , archivePrefix =. 2302.02429 , primaryClass =
-
[28]
NGDEEP Epoch 1: The Faint End of the Luminosity Function at z 9-12 from Ultradeep JWST Imaging. , keywords =. doi:10.3847/2041-8213/acf365 , archivePrefix =. 2306.06244 , primaryClass =
-
[29]
Pushing JWST to the extremes: Search and scrutiny of bright galaxy candidates at z ≃ 15─30. , keywords =. doi:10.1051/0004-6361/202555082 , archivePrefix =. 2504.05893 , primaryClass =
-
[30]
A Census of the Bright z = 8.5-11 Universe with the Hubble and Spitzer Space Telescopes in the CANDELS Fields. , keywords =. doi:10.3847/1538-4357/ac3aed , archivePrefix =. 2106.13813 , primaryClass =
-
[31]
z 2-9 Galaxies Magnified by the Hubble Frontier Field Clusters. II. Luminosity Functions and Constraints on a Faint-end Turnover. , keywords =. doi:10.3847/1538-4357/ac86d1 , archivePrefix =. 2205.11526 , primaryClass =
-
[32]
Sub-Eddington star-forming regions are super-Eddington: momentum-driven outflows from supersonic turbulence. , keywords =. doi:10.1093/mnras/stv2331 , archivePrefix =. 1411.1769 , primaryClass =
work page internal anchor Pith review Pith/arXiv arXiv doi:10.1093/mnras/stv2331
-
[33]
Multiphase gas in the circumgalactic medium: relative role of t _ cool /t _ ff and density fluctuations. , keywords =. doi:10.1093/mnras/stz1857 , archivePrefix =. 1901.02903 , primaryClass =
work page internal anchor Pith review Pith/arXiv arXiv doi:10.1093/mnras/stz1857 1901
-
[34]
arXiv e-prints , keywords =
Magnetohydrodynamic Precipitation. arXiv e-prints , keywords =
-
[35]
The Uchuu simulations: Data Release 1 and dark matter halo concentrations. , keywords =. doi:10.1093/mnras/stab1755 , archivePrefix =. 2007.14720 , primaryClass =
-
[36]
arXiv e-prints , keywords =
DeepDive: Tracing the early quenching pathways of massive quiescent galaxies at z>3 from their star-formation histories and chemical abundances. arXiv e-prints , keywords =
-
[37]
ALMA Observations toward the Starburst Dwarf Galaxy NGC 5253. I. Molecular Cloud Properties and Scaling Relations. , keywords =. doi:10.3847/1538-4357/aad69f , archivePrefix =. 1808.10089 , primaryClass =
work page internal anchor Pith review Pith/arXiv arXiv doi:10.3847/1538-4357/aad69f
-
[38]
ALMA Reveals the Molecular Medium Fueling the Nearest Nuclear Starburst
ALMA Reveals the Molecular Medium Fueling the Nearest Nuclear Starburst. , keywords =. doi:10.1088/0004-637X/801/1/25 , archivePrefix =. 1411.2836 , primaryClass =
work page internal anchor Pith review Pith/arXiv arXiv doi:10.1088/0004-637x/801/1/25
-
[39]
Protostars and Planets VII , year = 2023, editor =
The Life and Times of Giant Molecular Clouds. Protostars and Planets VII , year = 2023, editor =. doi:10.48550/arXiv.2203.09570 , archivePrefix =. 2203.09570 , primaryClass =
-
[40]
Non-monotonic relations of galaxy star formation, radius, and structure at fixed stellar mass. , keywords =. doi:10.1093/mnras/stae1735 , archivePrefix =. 2404.10114 , primaryClass =
-
[41]
Entrainment of hot gas into cold streams: the origin of excessive star formation rates at cosmic noon. , keywords =. doi:10.1093/mnras/stae1673 , archivePrefix =. 2403.00912 , primaryClass =
-
[42]
A mock redshift catalogue of the dusty star-forming galaxy population with intrinsic clustering and lensing for deep millimetre surveys. , keywords =. doi:10.1093/mnras/stae1417 , archivePrefix =. 2403.15650 , primaryClass =
-
[43]
arXiv e-prints , keywords =
Bottom-heavy initial mass functions reveal hidden mass in early galaxies. arXiv e-prints , keywords =
-
[44]
The Constant Average Relationship between Dust-obscured Star Formation and Stellar Mass from z = 0 to z = 2.5. , keywords =. doi:10.3847/1538-4357/aa94ce , archivePrefix =. 1710.06872 , primaryClass =
work page internal anchor Pith review Pith/arXiv arXiv doi:10.3847/1538-4357/aa94ce
-
[45]
Clustering and halo abundances in early dark energy cosmological models. , keywords =. doi:10.1093/mnras/stab769 , archivePrefix =. 2006.14910 , primaryClass =
-
[46]
The Co-Evolution Between Galaxies and Dark Matter Halos. arXiv e-prints , keywords =. doi:10.48550/arXiv.2404.10801 , archivePrefix =. 2404.10801 , primaryClass =
-
[47]
The JWST EXCELS survey: too much, too young, too fast? Ultra-massive quiescent galaxies at 3 < z < 5. , keywords =. doi:10.1093/mnras/stae2092 , archivePrefix =. 2405.02242 , primaryClass =
-
[48]
On the Significance of Rare Objects at High Redshift: The Impact of Cosmic Variance. , keywords =. doi:10.3847/1538-4357/adb422 , archivePrefix =. 2403.00050 , primaryClass =
-
[49]
DeepDive: A deep dive into the physics of the first massive quiescent galaxies in the Universe. arXiv e-prints , keywords =. doi:10.48550/arXiv.2506.22642 , archivePrefix =. 2506.22642 , primaryClass =
-
[50]
The Nature of High-Redshift Massive Quiescent Galaxies -- Searching for RUBIES-UDS-QG-z7 in FLARES. arXiv e-prints , keywords =. doi:10.48550/arXiv.2509.16111 , archivePrefix =. 2509.16111 , primaryClass =
-
[51]
Explaining Ultramassive Quiescent Galaxies at 3 < z < 5 in the Context of Their Environments. , keywords =. doi:10.3847/2041-8213/adeb7c , archivePrefix =. 2507.05340 , primaryClass =
-
[52]
Effects of helium sedimentation on late star formation in galaxy clusters. arXiv e-prints , keywords =. doi:10.48550/arXiv.2512.06223 , archivePrefix =. 2512.06223 , primaryClass =
-
[53]
Statistical Properties of Cold Streams In Massive Star-Forming Halos in IllustrisTNG-50. arXiv e-prints , keywords =. doi:10.48550/arXiv.2511.21814 , archivePrefix =. 2511.21814 , primaryClass =
-
[54]
Visual morphological classification of the full MaNGA DR17 sample: a general characterization. , keywords =. doi:10.1093/mnras/staf1784 , archivePrefix =. 2510.12792 , primaryClass =
-
[55]
Morphologies of 190,000 Galaxies at z = 0-10 Revealed with HST Legacy Data. I. Size Evolution. , keywords =. doi:10.1088/0067-0049/219/2/15 , archivePrefix =. 1503.07481 , primaryClass =
work page internal anchor Pith review Pith/arXiv arXiv doi:10.1088/0067-0049/219/2/15
-
[56]
Euclid Quick Data Release (Q1): Identification of massive galaxy candidates at the end of the Epoch of Reionisation. arXiv e-prints , keywords =. doi:10.48550/arXiv.2511.11943 , archivePrefix =. 2511.11943 , primaryClass =
-
[57]
The most massive objects in the Universe
The Most Massive Objects in the Universe. , keywords =. doi:10.1088/2041-8205/755/2/L36 , archivePrefix =. 1004.5349 , primaryClass =
work page internal anchor Pith review Pith/arXiv arXiv doi:10.1088/2041-8205/755/2/l36 2041
-
[58]
An application of extreme value statistics to the most massive galaxy clusters at low and high redshifts. , keywords =. doi:10.1111/j.1365-2966.2011.20171.x , archivePrefix =. 1109.4820 , primaryClass =
-
[59]
GRUMPY: a simple framework for realistic forward modelling of dwarf galaxies. , keywords =. doi:10.1093/mnras/stac1439 , archivePrefix =. 2106.09724 , primaryClass =
-
[60]
The bending of the star-forming main sequence traces the cold- to hot-accretion transition mass over 0 < z < 4. , keywords =. doi:10.1051/0004-6361/202243574 , archivePrefix =. 2203.10880 , primaryClass =
-
[61]
Ly blobs from cold streams undergoing Kelvin-Helmholtz instabilities. , keywords =. doi:10.1093/mnras/staa2421 , archivePrefix =. 2003.01724 , primaryClass =
-
[62]
A deep ALMA image of the Hubble Ultra Deep Field
A deep ALMA image of the Hubble Ultra Deep Field. , keywords =. doi:10.1093/mnras/stw3088 , archivePrefix =. 1606.00227 , primaryClass =
work page internal anchor Pith review Pith/arXiv arXiv doi:10.1093/mnras/stw3088
-
[63]
The SCUBA-2 Cosmology Legacy Survey: the nature of bright submm galaxies from 2 deg ^ 2 of 850- m imaging. , keywords =. doi:10.1093/mnras/stx861 , archivePrefix =. 1610.02409 , primaryClass =
work page internal anchor Pith review Pith/arXiv arXiv doi:10.1093/mnras/stx861
-
[64]
Cold streams in early massive hot haloes as the main mode of galaxy formation
Cold streams in early massive hot haloes as the main mode of galaxy formation. , keywords =. doi:10.1038/nature07648 , archivePrefix =. 0808.0553 , primaryClass =
work page internal anchor Pith review Pith/arXiv arXiv doi:10.1038/nature07648
-
[65]
Survival of radiatively cooling streams
Instability of supersonic cold streams feeding galaxies - IV. Survival of radiatively cooling streams. , keywords =. doi:10.1093/mnras/staa812 , archivePrefix =. 1910.05344 , primaryClass =
-
[66]
HMFcalc: An Online Tool for Calculating Dark Matter Halo Mass Functions
HMFcalc: An online tool for calculating dark matter halo mass functions. Astronomy and Computing , keywords =. doi:10.1016/j.ascom.2013.11.001 , archivePrefix =. 1306.6721 , primaryClass =
work page internal anchor Pith review Pith/arXiv arXiv doi:10.1016/j.ascom.2013.11.001 2013
-
[67]
Recovering galaxy stellar population properties from broad-band spectral energy distribution fitting. , keywords =. doi:10.1111/j.1365-2966.2012.20848.x , archivePrefix =. 1203.3548 , primaryClass =
-
[68]
and Castellano, Marco and Santini, Paola and Merlin, Emiliano and Fontana, A
Menci, N. and Castellano, Marco and Santini, Paola and Merlin, Emiliano and Fontana, A. and Shankar, F. , year =. High-redshift Galaxies from Early JWST Observations: Constraints on Dark Energy Models , volume =. The Astrophysical Journal Letters , doi =
-
[69]
Earliest Galaxies in the JADES Origins Field: Luminosity Function and Cosmic Star Formation Rate Density 300 Myr after the Big Bang. , keywords =. doi:10.3847/1538-4357/ad463d , archivePrefix =. 2312.10033 , primaryClass =
-
[70]
COSMOS-Web: Intrinsically Luminous z 10 Galaxy Candidates Test Early Stellar Mass Assembly. , keywords =. doi:10.3847/1538-4357/ad2075 , archivePrefix =. 2308.10932 , primaryClass =
-
[71]
Two Remarkably Luminous Galaxy Candidates at z 10-12 Revealed by JWST. , keywords =. doi:10.3847/2041-8213/ac9b22 , archivePrefix =. 2207.09434 , primaryClass =
-
[72]
JADES NIRSpec Spectroscopy of GN-z11: Lyman- emission and possible enhanced nitrogen abundance in a z = 10.60 luminous galaxy. , keywords =. doi:10.1051/0004-6361/202346159 , archivePrefix =. 2302.07256 , primaryClass =
-
[73]
The Cosmos in Its Infancy: JADES Galaxy Candidates at z > 8 in GOODS-S and GOODS-N. , keywords =. doi:10.3847/1538-4357/ad1ee4 , archivePrefix =. 2306.02468 , primaryClass =
-
[74]
Unveiling the Distant Universe: Characterizing z 9 Galaxies in the First Epoch of COSMOS-Web. , keywords =. doi:10.3847/1538-4357/ad5e6a , archivePrefix =. 2308.00751 , primaryClass =
-
[75]
A New Census of the 0.2 < z < 3.0 Universe. I. The Stellar Mass Function. , keywords =. doi:10.3847/1538-4357/ab7e27 , archivePrefix =. 1910.04168 , primaryClass =
-
[76]
EMERGE - An empirical model for the formation of galaxies since $z\sim10$
EMERGE - an empirical model for the formation of galaxies since z 10. , keywords =. doi:10.1093/mnras/sty655 , archivePrefix =. 1705.05373 , primaryClass =
work page internal anchor Pith review Pith/arXiv arXiv doi:10.1093/mnras/sty655
-
[77]
Relating galaxies across different redshift to study galaxy evolution. , keywords =. doi:10.1093/mnras/stad262 , archivePrefix =. 2211.00485 , primaryClass =
-
[78]
A large difference in the progenitor masses of active and passive galaxies in the EAGLE simulation
A large difference in the progenitor masses of active and passive galaxies in the EAGLE simulation. , keywords =. doi:10.1093/mnrasl/slw137 , archivePrefix =. 1605.00009 , primaryClass =
work page internal anchor Pith review Pith/arXiv arXiv doi:10.1093/mnrasl/slw137
-
[79]
Density-modulated star formation efficiency: implications for the observed abundance of ultraviolet luminous galaxies at z > 10. , keywords =. doi:10.1093/mnras/staf1824 , archivePrefix =. 2505.05442 , primaryClass =
-
[80]
The Most Massive Galaxies with Large Depleted Cores: Structural Parameter Relations and Black Hole Masses. , keywords =. doi:10.3847/1538-4357/ab4d4f , archivePrefix =. 1910.10240 , primaryClass =
discussion (0)
Sign in with ORCID, Apple, or X to comment. Anyone can read and Pith papers without signing in.