Recognition: no theorem link
Accounting for variable detection functions in temporal abundance modeling via transfer learning
Pith reviewed 2026-05-12 00:58 UTC · model grok-4.3
The pith
Transfer learning from capture-recapture data allows catch-per-unit-effort models to account for variable detection probabilities, leading to improved abundance estimates and better detection of temporal trends.
A machine-rendered reading of the paper's core claim, the machinery that carries it, and where it could break.
Core claim
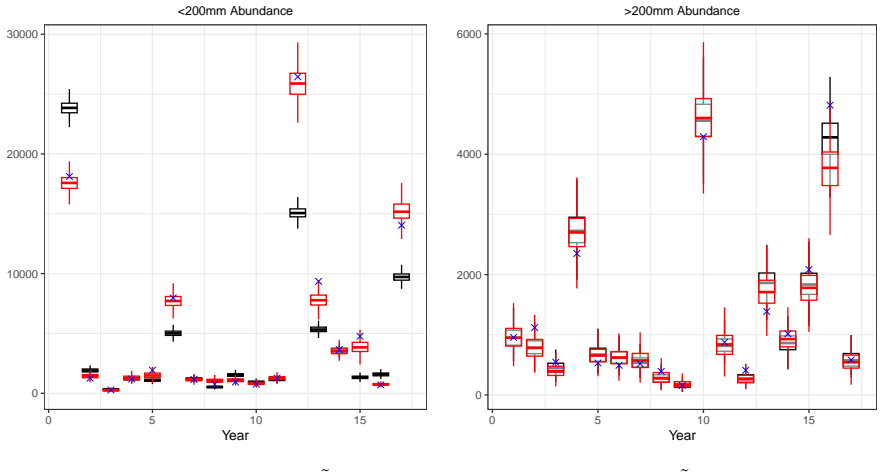
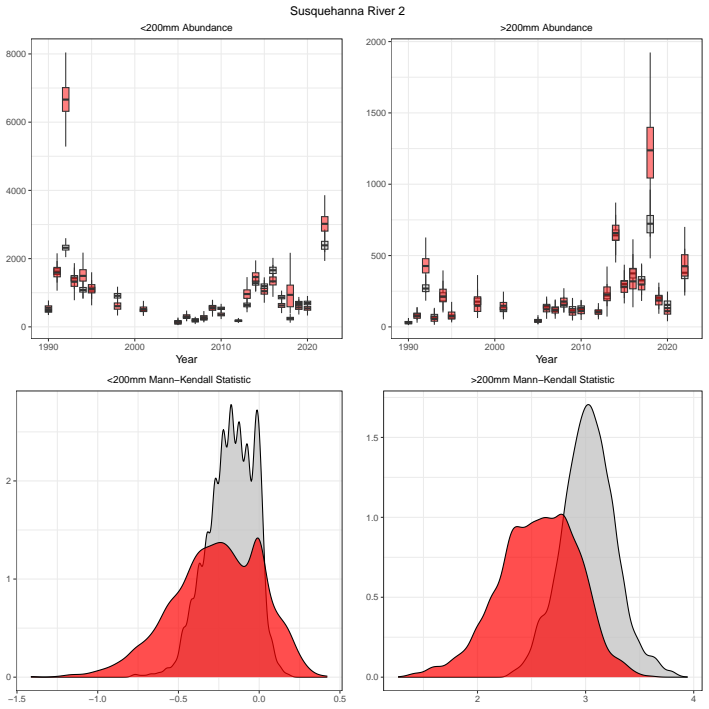
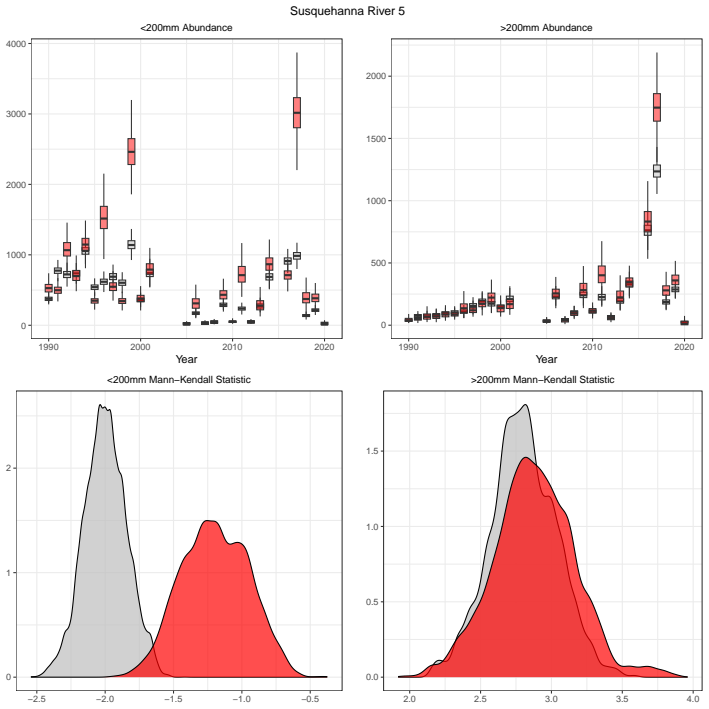
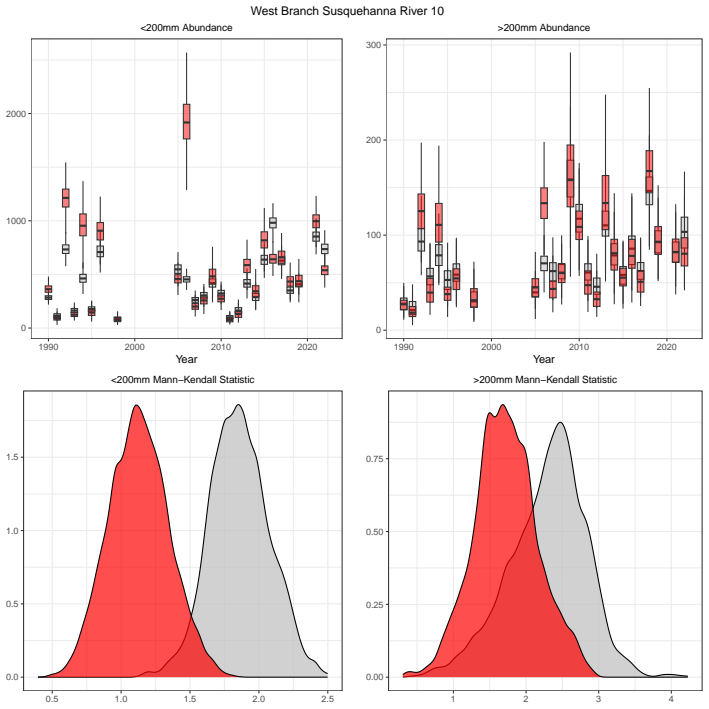
We propose an approach to (i) learn the effect of environmental covariates on detection probabilities from CR data and (ii) transfer these detection functions to CPUE models for improved inference. Shown empirically through a simulation study, this approach improves estimates of abundance and the ability to detect temporal trends. We apply our transfer learning method using CR and CPUE data to recreationally important smallmouth bass fisheries in Pennsylvania, USA rivers.
What carries the argument
Transfer learning of detection functions estimated from capture-recapture data to catch-per-unit-effort abundance models, using shared environmental covariates.
Load-bearing premise
The relationship between environmental covariates and detection probability is sufficiently consistent between capture-recapture and catch-per-unit-effort sampling methods to allow direct transfer of the learned functions.
What would settle it
A validation study where abundance estimates from the transfer method are compared against known true abundances from a fully observed population or independent high-effort surveys, showing no improvement or worse performance than standard CPUE models.
Figures


read the original abstract
Relative abundance, measured as the number of animals caught per unit of sampling effort (CPUE), is commonly used to monitor fish and wildlife populations, largely because sampling methods are cost-effective to implement. Modeling relative abundance, however, requires the assumption that the detection probability is constant across sampling events. This assumption is likely not valid, as the probability of detection often varies as a function of several factors, including the characteristics of individual animals and environmental conditions at the time of sampling. In contrast, methods to estimate absolute abundance, such as capture-recapture (CR), account for variable detection, but are often infeasible to implement across large spatiotemporal scales. Despite this, CR data are sometimes available for species of interest, albeit at smaller spatiotemporal extents. Leveraging information on detection probabilities from CR data to help inform estimates of widely available CPUE data could strengthen inferences about the status of fish and wildlife populations. We propose an approach to (i) learn the effect of environmental covariates on detection probabilities from CR data and (ii) transfer these detection functions to CPUE models for improved inference. Shown empirically through a simulation study, this approach improves estimates of abundance and the ability to detect temporal trends. We apply our transfer learning method using CR and CPUE data to recreationally important smallmouth bass (\textit{Micropterus dolomieu}) fisheries in Pennsylvania, USA rivers.
Editorial analysis
A structured set of objections, weighed in public.
Referee Report
Summary. The manuscript proposes a transfer learning approach to estimate variable detection probabilities from limited capture-recapture (CR) data and transfer the resulting detection functions to inform catch-per-unit-effort (CPUE) models for absolute abundance estimation and temporal trend detection. The method is evaluated in a simulation study claimed to show improved abundance estimates and trend detection power, and is applied to smallmouth bass (Micropterus dolomieu) fisheries using CR and CPUE data from Pennsylvania rivers.
Significance. If the transfer assumption holds, the approach could substantially increase the value of abundant but detection-biased CPUE data by borrowing strength from more rigorous but spatially limited CR studies, improving the reliability of population monitoring for management. The simulation provides a proof-of-concept under matched conditions, but the real-data application would gain from explicit validation of transferred effects.
major comments (2)
- [Simulation study] Simulation study section: the data-generating process uses the same detection function (identical covariate effects on p) for both CR and CPUE observations, so the reported improvements in abundance accuracy and trend detection do not address bias arising from protocol mismatch (gear type, effort distribution, spatial scale). This is load-bearing for the central claim that transferred functions improve real-world CPUE inference.
- [Application to Pennsylvania smallmouth bass data] Application section: no diagnostic or validation is described to confirm that CR-derived covariate effects (e.g., on flow or temperature) match those operating in the CPUE electrofishing/angling samples; without this, the Pennsylvania results remain an untested extrapolation.
minor comments (2)
- [Abstract] Abstract and results lack any numerical summary (bias reduction, MSE, power gain, or confidence intervals) of the claimed simulation improvements, hindering assessment of practical significance.
- [Methods] Notation for the transferred detection function p(detection | covariates) and its plug-in into the CPUE likelihood should be defined explicitly with an equation in the methods.
Simulated Author's Rebuttal
We thank the referee for their constructive and insightful comments on our manuscript. We address each major comment below and describe the revisions we will incorporate to strengthen the work.
read point-by-point responses
-
Referee: Simulation study section: the data-generating process uses the same detection function (identical covariate effects on p) for both CR and CPUE observations, so the reported improvements in abundance accuracy and trend detection do not address bias arising from protocol mismatch (gear type, effort distribution, spatial scale). This is load-bearing for the central claim that transferred functions improve real-world CPUE inference.
Authors: We agree that the simulation evaluates performance under the assumption of transferable detection functions and does not directly quantify bias from protocol mismatch. This design isolates the benefit of incorporating variable detection when transfer is valid, which is the method's core premise. To address the concern, we will add a new simulation scenario with mismatched covariate effects on detection (e.g., differing slopes for flow and temperature, plus protocol-specific noise) between CR and CPUE data-generating processes. Results will show performance degradation under mismatch and conditions where transfer remains advantageous. We will also revise the methods and discussion to emphasize that real-world gains require the transfer assumption and to recommend diagnostics for mismatch. revision: yes
-
Referee: Application section: no diagnostic or validation is described to confirm that CR-derived covariate effects (e.g., on flow or temperature) match those operating in the CPUE electrofishing/angling samples; without this, the Pennsylvania results remain an untested extrapolation.
Authors: We acknowledge that the current application lacks explicit validation of transferred effects. In the revision we will add a diagnostic subsection that compares the posterior means and credible intervals for shared covariate effects (flow, temperature) estimated from the CR model against those recovered in the CPUE model after transfer. We will also articulate the biological and methodological rationale for transferability, noting that both datasets were collected in comparable Pennsylvania river habitats using gears sensitive to the same environmental drivers. The discussion will explicitly state the transfer assumption, its unverifiable aspects with available data, and the need for future cross-validation studies. revision: yes
Circularity Check
No circularity in transfer learning from independent CR data to CPUE models
full rationale
The paper derives its method by estimating covariate effects on detection probability from separate capture-recapture (CR) datasets and transferring those functions as plug-ins into CPUE likelihoods. This uses distinct data sources rather than fitting parameters on a subset and relabeling a related quantity from the same data as a prediction. The simulation generates both data types from a shared ground-truth model solely to benchmark recovery performance, not to create a self-referential result. No self-citations, uniqueness theorems, or ansatz smuggling appear in the derivation chain. The claims rest on external empirical validation and application to Pennsylvania river data, rendering the approach self-contained against independent benchmarks.
Axiom & Free-Parameter Ledger
axioms (1)
- domain assumption Detection probability varies as a function of environmental covariates and these functions can be learned from CR data and transferred to CPUE models.
Reference graph
Works this paper leans on
-
[1]
Factors affecting detection probability, effective area surveyed, and species misidentification in grassland bird point counts , author=. The Condor , volume=. 2019 , publisher=
work page 2019
-
[2]
Journal of Caribbean Ornithology , volume=
Effects of observer skill and survey method on forest bird abundance data: Recommendations for citizen science conservation monitoring in the Caribbean , author=. Journal of Caribbean Ornithology , volume=
-
[3]
Canadian Journal of Fisheries and Aquatic Sciences , volume=
Predicting fish species richness and habitat relationships using Bayesian hierarchical multispecies occupancy models , author=. Canadian Journal of Fisheries and Aquatic Sciences , volume=. 2020 , publisher=
work page 2020
-
[4]
Transactions of the American Fisheries Society , volume=
Evaluation of electrofishing catch per unit effort for indexing fish abundance in Florida lakes , author=. Transactions of the American Fisheries Society , volume=. 2013 , publisher=
work page 2013
-
[5]
Fisheries Management and Ecology , volume=
Accounting for variation in species detection in fish community monitoring , author=. Fisheries Management and Ecology , volume=. 2014 , publisher=
work page 2014
-
[6]
North American Journal of Fisheries Management , volume=
Validation of abundance estimates from mark--recapture and removal techniques for rainbow trout captured by electrofishing in small streams , author=. North American Journal of Fisheries Management , volume=. 2005 , publisher=
work page 2005
-
[7]
Imperfect detection and the determination of environmental flows for fish: challenges, implications and solutions , author=. Freshwater Biology , volume=. 2016 , publisher=
work page 2016
-
[8]
Toward improved understanding of streamflow effects on freshwater fishes , author=. Fisheries , volume=. 2022 , publisher=
work page 2022
-
[9]
Transactions of the American Fisheries Society , volume=
Factors affecting nesting success of smallmouth bass in a regulated Virginia stream , author=. Transactions of the American Fisheries Society , volume=. 1995 , publisher=
work page 1995
-
[10]
Canadian Journal of Fisheries and Aquatic Sciences , volume=
How reliable are the abundance indices derived from commercial catch--effort standardization? , author=. Canadian Journal of Fisheries and Aquatic Sciences , volume=
-
[11]
Indices of abundance in the Gulf of Mexico reef fish complex: A comparative approach using spatial data from vessel monitoring systems , author=. Fisheries Research , volume=. 2018 , publisher=
work page 2018
-
[12]
Hierarchical spatiotemporal matrix models for characterizing invasions , author=. Biometrics , volume=. 2007 , publisher=
work page 2007
-
[13]
Trends in inland commercial fisheries in the United States , author=. Fisheries , volume=. 2020 , publisher=
work page 2020
-
[14]
A fresh look at inland fisheries and their role in food security and livelihoods , author=. Fish and Fisheries , volume=. 2019 , publisher=
work page 2019
-
[15]
A note on the multiple-recapture census , author=. Biometrika , volume=. 1965 , publisher=
work page 1965
-
[16]
Mark-recapture models with parameters constant in time , author=. Biometrics , pages=. 1982 , publisher=
work page 1982
-
[17]
Accounting for uncertainty when estimating drivers of imperfect detection: An integrated approach illustrated with snorkel surveys for riverine fishes , author=. Fisheries Research , volume=. 2022 , publisher=
work page 2022
-
[18]
Accounting for imperfect detection in ecology: a quantitative review , author=. PloS one , volume=. 2014 , publisher=
work page 2014
-
[19]
Environmental Science and Pollution Research , volume=
Evaluating and validating abundance monitoring methods in the absence of populations of known size: review and application to a passive tracking index , author=. Environmental Science and Pollution Research , volume=. 2015 , publisher=
work page 2015
-
[20]
Environmetrics: The official journal of the International Environmetrics Society , volume=
Large scale wildlife monitoring studies: statistical methods for design and analysis , author=. Environmetrics: The official journal of the International Environmetrics Society , volume=. 2002 , publisher=
work page 2002
-
[21]
North American Journal of Fisheries Management , volume=
Adapting standardized trout monitoring to a changing climate for the upper Yellowstone River, Montana, USA , author=. North American Journal of Fisheries Management , volume=. 2024 , publisher=
work page 2024
-
[22]
A fishery after the decline: the Susquehanna River Smallmouth Bass story , author=. Fisheries , volume=. 2020 , publisher=
work page 2020
-
[23]
Analysis and interpretation of freshwater fisheries data
Relative abundance and catch per unit effort , author=. Analysis and interpretation of freshwater fisheries data. American Fisheries Society, Bethesda, Maryland , pages=
-
[24]
A Bayesian analysis of multiple-recapture sampling for a closed population , author=. Biometrika , volume=. 1981 , publisher=
work page 1981
-
[25]
An integrated data model to estimate abundance from counts with temporal dependence and imperfect detection , author=. Ecology , volume=. 2025 , publisher=
work page 2025
-
[26]
Journal of Applied Ecology , volume=
Accounting for spatiotemporal sampling variation in joint species distribution models , author=. Journal of Applied Ecology , volume=. 2024 , publisher=
work page 2024
-
[27]
A survey of transfer learning , author=. Journal of Big data , volume=. 2016 , publisher=
work page 2016
-
[28]
arXiv preprint arXiv:2312.13484 , year=
Bayesian transfer learning , author=. arXiv preprint arXiv:2312.13484 , year=
-
[29]
Journal of Statistical Software , volume=
Estimating population abundance using sightability models: R SightabilityModel package , author=. Journal of Statistical Software , volume=
-
[30]
Proceedings of the IEEE/CVF conference on computer vision and pattern recognition , pages=
Characterizing and avoiding negative transfer , author=. Proceedings of the IEEE/CVF conference on computer vision and pattern recognition , pages=
-
[31]
Joint species distribution modelling: With applications in R , author=. 2020 , publisher=
work page 2020
- [32]
discussion (0)
Sign in with ORCID, Apple, or X to comment. Anyone can read and Pith papers without signing in.