Recognition: 2 theorem links
· Lean TheoremUnmasking Stellar Feedback-Driven Bubbles: Identification and Properties Analysis
Pith reviewed 2026-05-12 01:07 UTC · model grok-4.3
The pith
Stellar feedback bubbles in a simulated dwarf galaxy follow exponential distributions in lifetime and size, both increasing with galactocentric radius.
A machine-rendered reading of the paper's core claim, the machinery that carries it, and where it could break.
Core claim
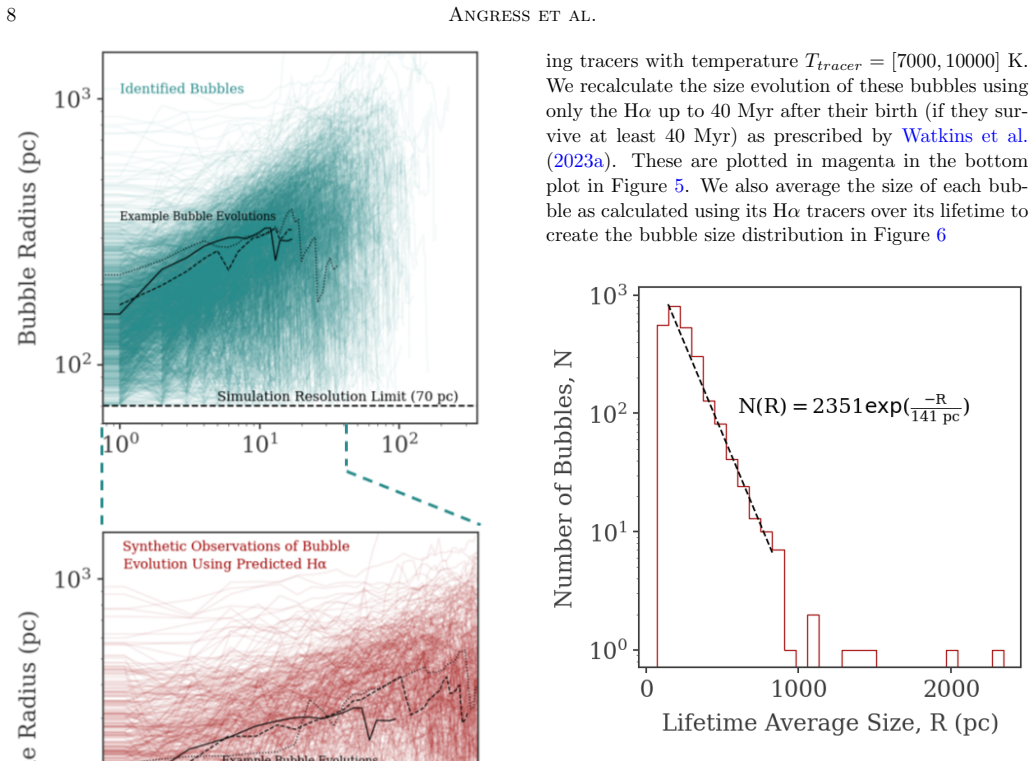
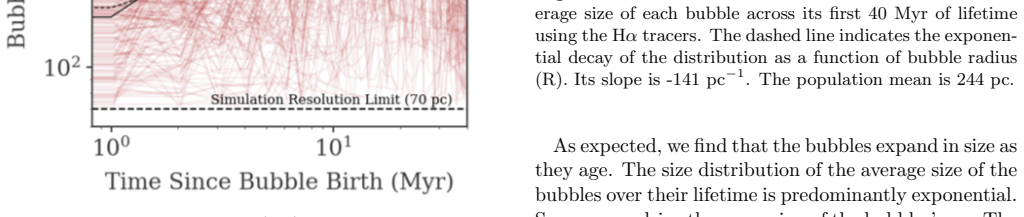
We calculate the average radius, lifetime, temperature, density, and spatial distribution of simulated feedback-driven bubbles using Lagrangian gas parcels. We find exponential distributions of bubble lifetime and size, and we find a positive correlation between bubble lifetime and galactocentric radius. We predict how the data would appear in Hα tracers and compare the simulated values to observations, finding an additional positive correlation between the size of the bubbles and the galactocentric radius using their Hα tracers.
What carries the argument
Lagrangian gas parcels that tag and follow the hot ionized gas inside each feedback bubble to extract its time-dependent radius, lifetime, and other properties.
If this is right
- Bubble lifetime and size both increase with distance from the galactic center, implying that local galactic environment shapes feedback structures.
- Exponential distributions of lifetime and size suggest a common statistical process governing how bubbles expand and dissipate.
- Synthetic Hα maps reproduce the same radial trend, allowing observers to test the simulation results directly.
- The spatial distribution of bubbles reflects the underlying star-formation activity across the disk.
Where Pith is reading between the lines
- Longer-lived bubbles at larger radii could help explain why star-formation regulation appears weaker in galaxy outskirts.
- The same Lagrangian tracking technique could be applied to simulations of larger spiral galaxies to check whether the trends persist.
- If confirmed, the exponential statistics might be used to estimate the total energy injected by feedback across an entire galactic disk.
Load-bearing premise
The method of tagging and following Lagrangian gas parcels correctly identifies real stellar feedback bubbles and tracks their physical evolution without major numerical artifacts or selection biases.
What would settle it
High-resolution Hα imaging of a real galaxy like NGC 300 that shows no increase in bubble size with galactocentric radius would contradict the predicted positive correlation.
Figures


read the original abstract
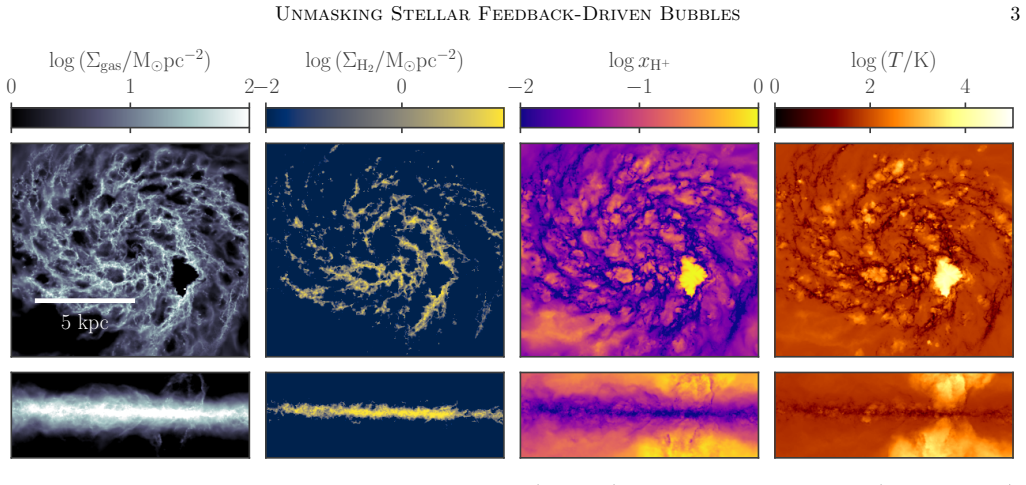
The identification and tracking of stellar feedback-driven galaxy bubbles is an important topic in star formation and galactic structure research. However, current observational analysis of bubbles is limited in scope; information on bubble lifetime is inaccessible. Simulation data thus provides a unique opportunity to glean some of these characteristics at high resolution. We present an investigation into the characteristics and evolution of hot, ionized bubbles in the interstellar medium of a dwarf spiral (NGC300-like) galaxy. We calculate the average radius, lifetime, temperature, density, and spatial distribution of the simulated feedback-driven bubbles using Lagrangian gas parcels, and we examine the relationship between these characteristics and the local galactic environment. We find exponential distributions of bubble lifetime and size, and we find a positive correlation between bubble lifetime and galactocentric radius. Finally, we predict how the data would appear in H$\alpha$ tracers and compare the simulated values to observations. We find an additional positive correlation between the size of the bubbles and the galactocentric radius using their H$\alpha$ tracers.
Editorial analysis
A structured set of objections, weighed in public.
Referee Report
Summary. The manuscript analyzes stellar feedback-driven hot ionized bubbles in a high-resolution simulation of a dwarf spiral galaxy modeled after NGC 300. Using Lagrangian gas parcels to identify and track bubbles, the authors compute their average radii, lifetimes, temperatures, densities, and spatial distributions, reporting exponential distributions for lifetimes and sizes along with positive correlations between these quantities and galactocentric radius. They further predict observable properties using Hα tracers and compare the resulting size-radius correlation to observations.
Significance. If the Lagrangian identification method is shown to be free of significant numerical artifacts, the work would provide valuable simulation-derived constraints on bubble lifetimes and environmental trends that are inaccessible to observations, potentially improving sub-grid feedback prescriptions in galaxy formation models. The exponential forms and radial correlations, if robust, represent a concrete link between local stellar feedback and galactic structure.
major comments (2)
- [Methods (bubble identification and tracking)] The Lagrangian gas-parcel method for bubble identification and tracking is load-bearing for every reported distribution and correlation. The manuscript does not appear to present convergence tests across resolutions, comparisons to Eulerian threshold-based identification, or sensitivity checks to parcel seeding and numerical diffusion, leaving open the possibility that the exponential lifetime/size distributions and galactocentric trends are partly methodological rather than physical.
- [Results (distributions and correlations)] The exponential fits to lifetime and size distributions (and the reported positive correlations with galactocentric radius) require explicit documentation of the fitting procedure, goodness-of-fit statistics, and any post-selection cuts on the parcel sample. Without these, it is impossible to assess whether the functional forms are robust or influenced by the identification criteria.
minor comments (2)
- [Abstract] The abstract states findings on average radius, lifetime, etc., but omits the total number of bubbles analyzed, typical error estimates, or simulation resolution; adding these would improve context for the statistical claims.
- [Hα comparison section] The Hα tracer comparison is a useful bridge to observations, but the manuscript should clarify the exact emission model (e.g., temperature/density assumptions or ionization fraction) used to generate the simulated Hα sizes.
Simulated Author's Rebuttal
We thank the referee for their constructive comments, which help clarify the robustness of our bubble identification method and the presentation of our statistical results. We address each major point below and will revise the manuscript to incorporate additional documentation and validation where feasible.
read point-by-point responses
-
Referee: The Lagrangian gas-parcel method for bubble identification and tracking is load-bearing for every reported distribution and correlation. The manuscript does not appear to present convergence tests across resolutions, comparisons to Eulerian threshold-based identification, or sensitivity checks to parcel seeding and numerical diffusion, leaving open the possibility that the exponential lifetime/size distributions and galactocentric trends are partly methodological rather than physical.
Authors: We agree that demonstrating the robustness of the Lagrangian parcel-based identification is essential. The method tracks parcels that exceed a temperature threshold due to stellar feedback and remain coherent over time, which is described in Section 3. While the original submission did not include explicit resolution convergence tests (owing to the computational cost of the fiducial high-resolution run), we will add a new subsection in the revised manuscript that compares bubble statistics from the fiducial simulation to a lower-resolution counterpart. We will also report sensitivity tests to the temperature threshold and minimum parcel count used for bubble definition. These additions will quantify the impact of numerical diffusion and seeding choices on the reported exponential distributions and radial trends. We note that the qualitative trends align with analytic expectations for feedback-driven bubbles, but the new tests will strengthen this claim. revision: yes
-
Referee: The exponential fits to lifetime and size distributions (and the reported positive correlations with galactocentric radius) require explicit documentation of the fitting procedure, goodness-of-fit statistics, and any post-selection cuts on the parcel sample. Without these, it is impossible to assess whether the functional forms are robust or influenced by the identification criteria.
Authors: We acknowledge that the fitting details were insufficiently documented. In the revised manuscript we will expand the relevant methods and results sections to specify: (i) the exact fitting procedure (maximum-likelihood estimation on the unbinned data for the exponential form, with least-squares confirmation on log-binned histograms), (ii) goodness-of-fit metrics (reduced chi-squared and Kolmogorov-Smirnov p-values), and (iii) all post-selection cuts (e.g., discarding bubbles with lifetimes shorter than 0.5 Myr to exclude numerical transients and requiring at least 10 parcels per bubble). These clarifications will allow readers to evaluate the robustness of the exponential forms and the galactocentric correlations independently of the identification thresholds. revision: yes
Circularity Check
No significant circularity in reported distributions or correlations
full rationale
The paper's central results—exponential distributions of bubble lifetime and size, plus positive correlations with galactocentric radius—are obtained by direct measurement of properties (radius, lifetime, temperature, density, spatial distribution) from Lagrangian gas parcels in the simulation output. No equations, ansatzes, or self-citations are shown that reduce these quantities to fitted parameters, self-definitions, or prior author results by construction. The Hα tracer comparison is a post-processing visualization step rather than a load-bearing derivation. The derivation chain remains self-contained against the simulation data without circular reduction.
Axiom & Free-Parameter Ledger
axioms (1)
- domain assumption Stellar feedback in the simulation produces identifiable hot ionized bubbles whose properties can be tracked with Lagrangian gas parcels.
Lean theorems connected to this paper
-
IndisputableMonolith/Cost/FunctionalEquation.leanwashburn_uniqueness_aczel unclear?
unclearRelation between the paper passage and the cited Recognition theorem.
We calculate the average radius, lifetime, temperature, density... using Lagrangian gas parcels... We find exponential distributions of bubble lifetime and size
-
IndisputableMonolith/Foundation/RealityFromDistinction.leanreality_from_one_distinction unclear?
unclearRelation between the paper passage and the cited Recognition theorem.
bubble identification algorithm groups hot, ionized gas cells into spatially connected groups, links gas tracers... tracks the tracers as they heat and cool
What do these tags mean?
- matches
- The paper's claim is directly supported by a theorem in the formal canon.
- supports
- The theorem supports part of the paper's argument, but the paper may add assumptions or extra steps.
- extends
- The paper goes beyond the formal theorem; the theorem is a base layer rather than the whole result.
- uses
- The paper appears to rely on the theorem as machinery.
- contradicts
- The paper's claim conflicts with a theorem or certificate in the canon.
- unclear
- Pith found a possible connection, but the passage is too broad, indirect, or ambiguous to say the theorem truly supports the claim.
Reference graph
Works this paper leans on
-
[1]
2011, AJ, 141, 23, doi: 10.1088/0004-6256/141/1/23
Bagetakos, I., Brinks, E., Walter, F., et al. 2011, AJ, 141, 23, doi: 10.1088/0004-6256/141/1/23
-
[2]
2021, ApJL, 919, L5, doi: 10.3847/2041-8213/ac1f95
Bialy, S., Zucker, C., Goodman, A., et al. 2021, ApJL, 919, L5, doi: 10.3847/2041-8213/ac1f95
-
[3]
A., Williams, R., Payne, J., et al
Binder, B. A., Williams, R., Payne, J., et al. 2024, ApJ, 969, 97, doi: 10.3847/1538-4357/ad46d9
-
[4]
Breitschwerdt, D., & de Avillez, M. A. 2006, A&A, 452, L1, doi: 10.1051/0004-6361:20064989
-
[5]
2009, ApJ, 695, 292, doi: 10.1088/0004-637X/695/1/292
Ceverino, D., & Klypin, A. 2009, ApJ, 695, 292, doi: 10.1088/0004-637X/695/1/292
-
[6]
Chabrier, G. 2003, PASP, 115, 763, doi: 10.1086/376392
work page internal anchor Pith review doi:10.1086/376392 2003
-
[7]
2008, in Massive Stars as Cosmic Engines, ed
Chu, Y.-H. 2008, in Massive Stars as Cosmic Engines, ed. F. Bresolin, P. A. Crowther, & J. Puls, Vol. 250, 341–354, doi: 10.1017/S1743921308020681
-
[8]
, archivePrefix = "arXiv", eprint =
Clark, P. C., Glover, S. C. O., & Klessen, R. S. 2012, MNRAS, 420, 745, doi: 10.1111/j.1365-2966.2011.20087.x
-
[9]
Cox, D. P., & Smith, B. W. 1974, ApJL, 189, L105, doi: 10.1086/181476 da Silva, R. L., Fumagalli, M., & Krumholz, M. 2012, ApJ, 745, 145, doi: 10.1088/0004-637X/745/2/145 da Silva, R. L., Fumagalli, M., & Krumholz, M. R. 2014, MNRAS, 444, 3275, doi: 10.1093/mnras/stu1688
-
[10]
Dawson, J. R. 2013, PASA, 30, e025, doi: 10.1017/pas.2013.002
-
[11]
Dawson, J. R., McClure-Griffiths, N. M., Wong, T., et al. 2013, ApJ, 763, 56, doi: 10.1088/0004-637X/763/1/56
-
[12]
Draine, B. T. 2011, Physics of the Interstellar and Intergalactic Medium
work page 2011
-
[13]
Elmegreen, B. G. 2011, in EAS Publications Series, Vol. 51, EAS Publications Series, ed. C. Charbonnel & T. Montmerle, 45–58, doi: 10.1051/eas/1151004
-
[14]
Faesi, C. M., Lada, C. J., & Forbrich, J. 2018, ApJ, 857, 19, doi: 10.3847/1538-4357/aaad60
-
[15]
M., Goodman, A., Zucker, C., et al
Foley, M. M., Goodman, A., Zucker, C., et al. 2023, ApJ, 947, 66, doi: 10.3847/1538-4357/acb5f4
-
[16]
2013, MNRAS, 435, 1426, doi: 10.1093/mnras/stt1383
Genel, S., Vogelsberger, M., Nelson, D., et al. 2013, MNRAS, 435, 1426, doi: 10.1093/mnras/stt1383
-
[17]
Gensior, J., Kruijssen, J. M. D., & Keller, B. W. 2020, MNRAS, 495, 199, doi: 10.1093/mnras/staa1184
-
[18]
Gentry, E. S., Krumholz, M. R., Dekel, A., & Madau, P. 2017, MNRAS, 465, 2471, doi: 10.1093/mnras/stw2746
-
[19]
Klessen, R. S. 2010, MNRAS, 404, 2, doi: 10.1111/j.1365-2966.2009.15718.x
-
[20]
Glover, S. C. O., & Mac Low, M.-M. 2007a, ApJS, 169, 239, doi: 10.1086/512238 —. 2007b, ApJ, 659, 1317, doi: 10.1086/512227
-
[21]
Harris, C. R., Millman, K. J., van der Walt, S. J., et al. 2020, Nature, 585, 357, doi: 10.1038/s41586-020-2649-2
-
[22]
1979, ApJ, 229, 533, doi: 10.1086/156986 —
Heiles, C. 1979, ApJ, 229, 533, doi: 10.1086/156986 —. 1984, ApJS, 55, 585, doi: 10.1086/190970
-
[23]
Helou, G., Roussel, H., Appleton, P., et al. 2004, ApJS, 154, 253, doi: 10.1086/422640
-
[24]
FIRE-2 Simulations: Physics versus Numerics in Galaxy Formation
Hopkins, P. F., Wetzel, A., Kereˇ s, D., et al. 2018, MNRAS, 480, 800, doi: 10.1093/mnras/sty1690
-
[25]
Hu, E. M. 1981, ApJ, 248, 119, doi: 10.1086/159135
-
[26]
Jeffreson, S. M. R., Krumholz, M. R., Fujimoto, Y., et al. 2021, MNRAS, 505, 3470, doi: 10.1093/mnras/stab1536
-
[27]
Jeffreson, S. M. R., Semenov, V. A., & Krumholz, M. R. 2023, Monthly Notices of the Royal Astronomical Society, 527, 7093, doi: 10.1093/mnras/stad3550
-
[28]
Joubaud, T., Grenier, I. A., Ballet, J., & Soler, J. D. 2019, A&A, 631, A52, doi: 10.1051/0004-6361/201936239
-
[29]
Keller, B. W., & Kruijssen, J. M. D. 2020, arXiv e-prints, arXiv:2004.03608. https://arxiv.org/abs/2004.03608
-
[30]
Kim, C.-G., & Ostriker, E. C. 2017, ApJ, 846, 133, doi: 10.3847/1538-4357/aa8599
-
[31]
2014, ApJ, 788, 121, doi: 10.1088/0004-637X/788/2/121
Kimm, T., & Cen, R. 2014, ApJ, 788, 121, doi: 10.1088/0004-637X/788/2/121
-
[32]
Kruijssen, J. M. D., Schruba, A., Chevance, M., et al. 2019, Nature, 569, 519, doi: 10.1038/s41586-019-1194-3
-
[33]
R., Fumagalli, M., da Silva, R
Krumholz, M. R., Fumagalli, M., da Silva, R. L., Rendahl, T., & Parra, J. 2015, MNRAS, 452, 1447, doi: 10.1093/mnras/stv1374
-
[34]
Krumholz, M. R., & Matzner, C. D. 2009, ApJ, 703, 1352, doi: 10.1088/0004-637X/703/2/1352
-
[35]
Leitherer, C., Schaerer, D., Goldader, J. D., et al. 1999, ApJS, 123, 3, doi: 10.1086/313233
-
[36]
2024, MNRAS, 529, 4073, doi: 10.1093/mnras/stae797
Li, C., Li, H., Cui, W., et al. 2024, MNRAS, 529, 4073, doi: 10.1093/mnras/stae797
- [37]
-
[38]
Matzner, C. D. 2002, ApJ, 566, 302, doi: 10.1086/338030
-
[39]
Green, A. J. 2002, ApJ, 578, 176, doi: 10.1086/342470
-
[40]
2019, Journal of Astrophysics and Astronomy, 40, 35, doi: 10.1007/s12036-019-9603-4
Mondal, C., Subramaniam, A., & George, K. 2019, Journal of Astrophysics and Astronomy, 40, 35, doi: 10.1007/s12036-019-9603-4
-
[41]
, year = 1997, month = dec, volume = 490, pages =
Navarro, J. F., Frenk, C. S., & White, S. D. M. 1997, ApJ, 490, 493, doi: 10.1086/304888
-
[42]
Nelson, A. F. 2006, MNRAS, 373, 1039, doi: 10.1111/j.1365-2966.2006.11119.x
-
[43]
Nelson, R. P., & Langer, W. D. 1997, ApJ, 482, 796, doi: 10.1086/304167 16Angress et al
-
[44]
R., Hennebelle, P., & Fierlinger, K
Ntormousi, E., Dawson, J. R., Hennebelle, P., & Fierlinger, K. 2017, A&A, 599, A94, doi: 10.1051/0004-6361/201629268
-
[45]
Ochsendorf, B. B., Brown, A. G. A., Bally, J., & Tielens, A. G. G. M. 2015, ApJ, 808, 111, doi: 10.1088/0004-637X/808/2/111
-
[46]
2017, ApJ, 840, 48, doi: 10.3847/1538-4357/aa6afa
Padoan, P., Haugbølle, T., Nordlund, ˚A., & Frimann, S. 2017, ApJ, 840, 48, doi: 10.3847/1538-4357/aa6afa
-
[47]
2023, MNRAS, 522, 5529, doi: 10.1093/mnras/stad1358
Gawryszczak, A. 2023, MNRAS, 522, 5529, doi: 10.1093/mnras/stad1358
-
[48]
Power, C., Navarro, J. F., Jenkins, A., et al. 2003, MNRAS, 338, 14, doi: 10.1046/j.1365-8711.2003.05925.x
-
[49]
2017, glueviz v0.13.1: multidimensional data exploration, doi: 10.5281/zenodo.1237692
Goodman, A. 2017, glueviz v0.13.1: multidimensional data exploration, doi: 10.5281/zenodo.1237692
-
[50]
2013, ApJ, 765, 43, doi: 10.1088/0004-637X/765/1/43
Silich, S., & Tenorio-Tagle, G. 2013, ApJ, 765, 43, doi: 10.1088/0004-637X/765/1/43
-
[51]
Smith, A., Safranek-Shrader, C., Bromm, V., et al. 2023, COLT: Monte Carlo radiative transfer and simulation analysis toolkit, Astrophysics Source Code Library, record ascl:2306.034. http://ascl.net/2306.034
work page 2023
-
[52]
Smith, M. C., Sijacki, D., & Shen, S. 2018, MNRAS, 478, 302, doi: 10.1093/mnras/sty994
-
[53]
Sobolev, V. V. 1960, Moving Envelopes of Stars, doi: 10.4159/harvard.9780674864658
-
[54]
F., Capozziello, S., & Dainotti, M
Springel, V. 2010, MNRAS, 401, 791, doi: 10.1111/j.1365-2966.2009.15715.x
-
[55]
2016, ApJ, 821, 7, doi: 10.3847/0004-637X/821/1/7
Tanner, R., Cecil, G., & Heitsch, F. 2016, ApJ, 821, 7, doi: 10.3847/0004-637X/821/1/7
- [56]
-
[57]
1990, ApJL, 361, L5, doi: 10.1086/185814 van der Tak, F
Tomisaka, K. 1990, ApJL, 361, L5, doi: 10.1086/185814 van der Tak, F. F. S., & van Dishoeck, E. F. 2000, A&A, 358, L79. https://arxiv.org/abs/astro-ph/0006246 V´ azquez, G. A., & Leitherer, C. 2005, ApJ, 621, 695, doi: 10.1086/427866
-
[58]
Virtanen, P., Gommers, R., Oliphant, T. E., et al. 2020, Nat. Methods, 17, 261, doi: 10.1038/s41592-019-0686-2
-
[59]
2015, MNRAS, 451, 2757, doi: 10.1093/mnras/stv1155
Walch, S., & Naab, T. 2015, MNRAS, 451, 2757, doi: 10.1093/mnras/stv1155
-
[60]
Watkins, E. J., Barnes, A. T., Henny, K., et al. 2023a, ApJL, 944, L24, doi: 10.3847/2041-8213/aca6e4
-
[61]
J., Kreckel, K., Groves, B., et al
Watkins, E. J., Kreckel, K., Groves, B., et al. 2023b, A&A, 676, A67, doi: 10.1051/0004-6361/202346075
-
[62]
1977, ApJ, 218, 377, doi: 10.1086/155692
Weaver, R., McCray, R., Castor, J., Shapiro, P., & Moore, R. 1977, ApJ, 218, 377, doi: 10.1086/155692
-
[63]
Westmeier, T., Braun, R., & Koribalski, B. S. 2011, MNRAS, 410, 2217, doi: 10.1111/j.1365-2966.2010.17596.x
-
[64]
Protostars and Planets VII , year = 2023, editor =
Zucker, C., Alves, J., Goodman, A., Meingast, S., & Galli, P. 2023, in Astronomical Society of the Pacific Conference Series, Vol. 534, Protostars and Planets VII, ed. S. Inutsuka, Y. Aikawa, T. Muto, K. Tomida, & M. Tamura, 43, doi: 10.48550/arXiv.2212.00067
-
[65]
Zucker, C., Goodman, A. A., Alves, J., et al. 2022, Nature, 601, 334, doi: 10.1038/s41586-021-04286-5
discussion (0)
Sign in with ORCID, Apple, or X to comment. Anyone can read and Pith papers without signing in.