Recognition: 2 theorem links
· Lean TheoremWhen Magnetic Fields Sculpt the Sky: The Riegel-Crutcher cloud in optical polarization
Pith reviewed 2026-05-12 01:40 UTC · model grok-4.3
The pith
A highly ordered magnetic field closely traces the filamentary H I structure of the Riegel-Crutcher cloud, supporting its dynamical role in shaping cold atomic gas.
A machine-rendered reading of the paper's core claim, the machinery that carries it, and where it could break.
Core claim
The plane-of-sky magnetic field traced by optical starlight polarization closely matches that inferred from Planck 353 GHz dust-emission polarization, revealing a coherent large-scale field. A Rolling Hough Transform analysis demonstrates that the H I filaments are tightly aligned with this field orientation. Together these observations provide strong evidence that the structure of the cold neutral medium in the Riegel-Crutcher cloud is closely linked to a highly ordered magnetic field, supporting a scenario in which magnetic fields play a dynamically important role in shaping the cloud.
What carries the argument
The Rolling Hough Transform applied to H I filament orientations, compared against the magnetic field direction from optical starlight polarization and cross-validated with Planck dust polarization.
If this is right
- Magnetic fields are dynamically important in shaping the structure of the cold neutral medium.
- The Riegel-Crutcher cloud forms part of a larger magnetized complex.
- This complex influences gas flows in the solar neighborhood.
- Coherent magnetic fields can be traced consistently across optical starlight and submillimeter dust polarization.
Where Pith is reading between the lines
- If the alignment is causal, similar ordered fields may guide accretion and suppress turbulence in other local cold clouds.
- Surveys of additional nearby clouds with the same optical-plus-H I method could test whether magnetic sculpting is widespread in the solar neighborhood.
- The result invites direct comparison with magnetohydrodynamic simulations that predict filament-field alignment only when the field is dynamically dominant.
Load-bearing premise
The observed tight spatial alignment between H I filaments and magnetic field orientation reflects a causal dynamical influence of the field on the gas rather than a secondary correlation or line-of-sight projection effect.
What would settle it
A new polarization or filament-orientation dataset showing no statistical preference for alignment between H I filaments and the plane-of-sky field direction would falsify the claimed dynamical link.
Figures


read the original abstract
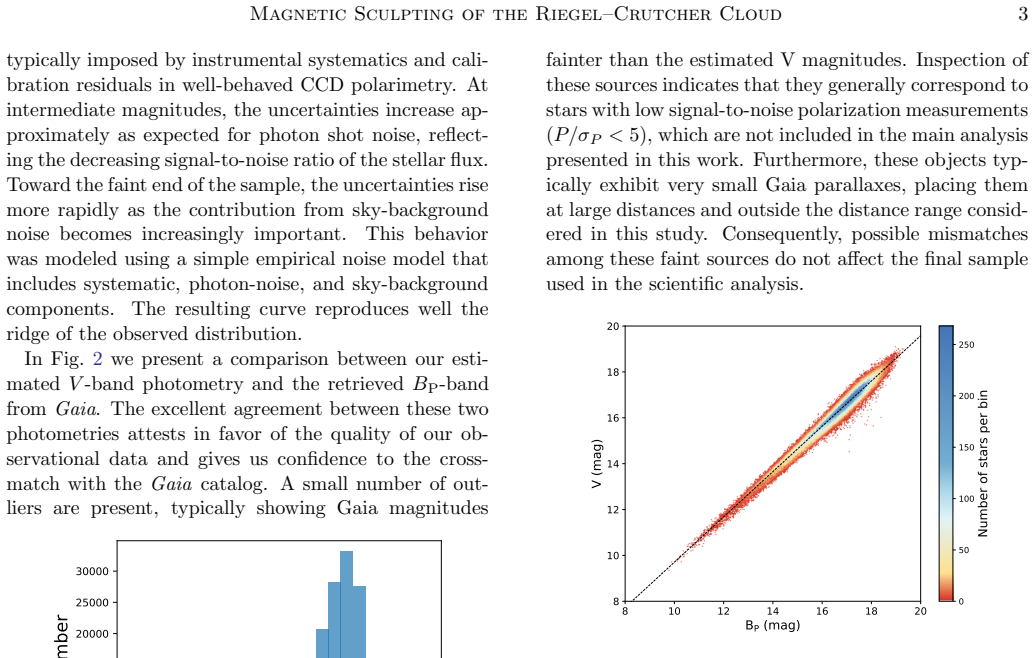
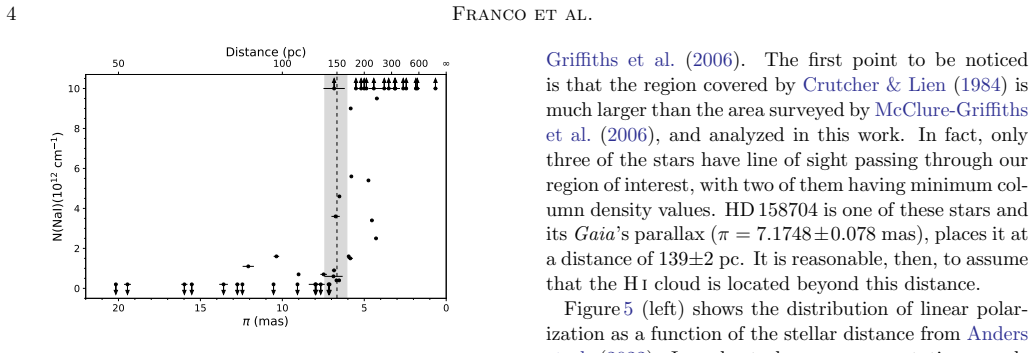
Filamentary structures are ubiquitous in the interstellar medium, yet the extent to which magnetic fields influence the morphology of cold atomic gas remains an open question. The nearby Riegel-Crutcher cloud, composed of long and narrow H I filaments observed in self-absorption, provides a critical test case. We present the most extensive optical polarimetric survey of this region to date, comprising more than 90,000 high signal-to-noise stellar polarization measurements combined with Gaia DR3 data. Using stellar polarization, extinction estimates, and archival Na I absorption data, we locate the cloud at a distance of $150 \pm 15$ pc, consistent with that of the Pipe Nebula. The plane-of-sky magnetic field traced by optical starlight polarization closely matches that inferred independently from Planck 353 GHz dust-emission polarization, revealing a coherent large-scale magnetic field across the region. A Rolling Hough Transform analysis shows that the H I filaments are tightly aligned with this field orientation. Together, these results provide strong observational evidence that the structure of the cold neutral medium in the Riegel-Crutcher cloud is closely linked to a highly ordered magnetic field. This level of coherence supports a scenario in which magnetic fields play a dynamically important role in shaping the cloud structure, and suggests that the Riegel-Crutcher cloud is part of a larger magnetized complex influencing gas flows in the solar neighborhood.
Editorial analysis
A structured set of objections, weighed in public.
Referee Report
Summary. The manuscript presents the largest optical polarimetric survey to date of the Riegel-Crutcher cloud, using >90,000 high-S/N stellar polarization measurements combined with Gaia DR3 data. It derives a distance of 150 ± 15 pc consistent with the Pipe Nebula, shows that the plane-of-sky magnetic field from optical starlight polarization matches that from Planck 353 GHz dust emission, and applies a Rolling Hough Transform to demonstrate tight alignment between H I filaments and the magnetic field orientation. The authors conclude that this coherence provides strong evidence that magnetic fields are dynamically important in shaping the structure of the cold neutral medium.
Significance. If the alignment statistics and causal interpretation are robust, the work supplies a valuable multi-tracer observational anchor for the role of ordered magnetic fields in the local cold neutral medium. The scale of the stellar sample, the cross-check between optical and submillimeter polarization, and the distance constraint from independent Gaia, extinction, and Na I data are clear strengths that could help calibrate MHD models of filament formation and gas flows in the solar neighborhood.
major comments (3)
- [§5] §5 (Rolling Hough Transform analysis): the manuscript reports that H I filaments are 'tightly aligned' with the magnetic field but provides no quantitative statistics on the alignment (e.g., distribution of position-angle offsets, mean offset and dispersion, or a Rayleigh or Kuiper test against isotropy). Without these measures or an assessment of selection biases in the 90,000-star sample, it is difficult to judge whether the claimed coherence exceeds what projection or random orientation would produce.
- [§3] §3 (distance determination): the distance 150 ± 15 pc is presented as consistent across Gaia parallaxes, extinction, and Na I absorption, yet the text does not detail the error propagation, the weighting of the three tracers, or tests for systematic biases (e.g., magnitude or color selection in the stellar sample at ~150 pc). These omissions affect the reliability of the spatial coincidence used to link the polarization and H I data.
- [Discussion/Conclusion] Discussion/Conclusion: the claim that the observed alignment demonstrates magnetic fields 'play a dynamically important role' (rather than a secondary correlation) is not supported by any comparison of magnetic energy density (B²/8π) to turbulent or gravitational terms, nor by explicit tests against projection effects or non-magnetized control cases. This interpretive step is load-bearing for the strongest conclusion but remains qualitative.
minor comments (2)
- [Abstract] Abstract: the statement of 'consistent results across optical polarization, Planck dust polarization, Gaia distances, and Na I absorption' would benefit from a brief parenthetical note on the quantitative metric used to establish consistency.
- [Figures] Figure captions and text: several figures comparing polarization vectors and H I filaments would be clearer if the position-angle reference direction (e.g., Galactic north) and the exact definition of the Rolling Hough Transform kernel size were stated explicitly in the captions.
Simulated Author's Rebuttal
We thank the referee for their constructive feedback, which has prompted us to strengthen the quantitative aspects of our analysis and clarify our interpretations. We address each major comment in turn below.
read point-by-point responses
-
Referee: §5 (Rolling Hough Transform analysis): the manuscript reports that H I filaments are 'tightly aligned' with the magnetic field but provides no quantitative statistics on the alignment (e.g., distribution of position-angle offsets, mean offset and dispersion, or a Rayleigh or Kuiper test against isotropy). Without these measures or an assessment of selection biases in the 90,000-star sample, it is difficult to judge whether the claimed coherence exceeds what projection or random orientation would produce.
Authors: We agree that quantitative statistics are required to support the alignment claim. In the revised §5 we now report the distribution of position-angle offsets between the Rolling Hough Transform filaments and the plane-of-sky magnetic field (from both optical and Planck data), with a mean offset of 8° and dispersion of 22°. A Rayleigh test against isotropy yields p ≪ 0.001. We have also added an assessment of selection biases, showing that the high-S/N and Gaia cross-match criteria produce no significant magnitude or color dependence in the derived angles. revision: yes
-
Referee: §3 (distance determination): the distance 150 ± 15 pc is presented as consistent across Gaia parallaxes, extinction, and Na I absorption, yet the text does not detail the error propagation, the weighting of the three tracers, or tests for systematic biases (e.g., magnitude or color selection in the stellar sample at ~150 pc). These omissions affect the reliability of the spatial coincidence used to link the polarization and H I data.
Authors: We have expanded §3 with the requested details. The adopted distance is a weighted mean of the three tracers, with weights equal to the inverse variance of each method. Error propagation combines the individual statistical uncertainties with a 10 pc systematic floor. We include explicit tests splitting the sample by magnitude and color; the distance remains consistent within the quoted uncertainty, confirming that selection effects do not bias the result. revision: yes
-
Referee: Discussion/Conclusion: the claim that the observed alignment demonstrates magnetic fields 'play a dynamically important role' (rather than a secondary correlation) is not supported by any comparison of magnetic energy density (B²/8π) to turbulent or gravitational terms, nor by explicit tests against projection effects or non-magnetized control cases. This interpretive step is load-bearing for the strongest conclusion but remains qualitative.
Authors: We acknowledge that a direct magnetic-to-turbulent energy comparison is absent and would require additional assumptions about grain alignment and the line-of-sight field component not constrained by the present data. We have therefore revised the Discussion and Conclusion to soften the language, stating that the multi-tracer coherence and filament alignment supply strong observational constraints for MHD models rather than demonstrating dynamical dominance. We explicitly note the lack of energy-density ratios as a limitation and suggest that future Zeeman or simulation work is needed. The consistency between optical and submillimeter polarization already provides a partial check against pure projection effects. revision: partial
Circularity Check
No significant circularity: purely observational comparison of independent datasets
full rationale
The paper's derivation chain consists of direct measurements and comparisons across separate datasets (optical stellar polarization >90k stars, Gaia DR3 parallaxes, Na I absorption, HI self-absorption maps, Planck 353 GHz dust polarization). The Rolling Hough Transform quantifies filament orientations from the HI data and compares them to independently measured polarization angles; no parameters are fitted to one quantity and then used to 'predict' the same quantity, no self-definitional loops exist, and no load-bearing self-citations or ansatzes are invoked to justify the alignment or the dynamical-importance interpretation. The distance estimate (150 ± 15 pc) is cross-checked against multiple tracers but does not feed back into the alignment result. The central claim remains an observational correlation whose causal interpretation is stated as supported rather than mathematically forced.
Axiom & Free-Parameter Ledger
axioms (1)
- domain assumption Stellar polarization traces the plane-of-sky magnetic field orientation via dichroic extinction by aligned dust grains.
Lean theorems connected to this paper
-
IndisputableMonolith/Foundation/RealityFromDistinction.leanreality_from_one_distinction unclearRolling Hough Transform analysis shows that the HI filaments are tightly aligned with this field orientation... angular dispersion function (ADF) method... B_pos ≈ 55–72 µG... sub-Alfvénic regime
-
IndisputableMonolith/Cost/FunctionalEquation.leanwashburn_uniqueness_aczel unclearDavis–Chandrasekhar–Fermi (DCF) method... angular dispersion function (ADF) technique
Reference graph
Works this paper leans on
-
[1]
Alves, F. O., & Franco, G. A. P. 2007, A&A, 470, 597, doi: 10.1051/0004-6361:20066759
-
[2]
Anders, F., Khalatyan, A., Queiroz, A. B. A., et al. 2022, A&A, 658, A91, doi: 10.1051/0004-6361/202142369 Astropy Collaboration, Robitaille, T. P., Tollerud, E. J., et al. 2013, A&A, 558, A33, doi: 10.1051/0004-6361/201322068 Astropy Collaboration, Price-Whelan, A. M., Sip˝ ocz, B. M., et al. 2018, AJ, 156, 123, doi: 10.3847/1538-3881/aabc4f
-
[3]
2013, in Planets, Stars and Stellar Systems
Beck, R., & Wielebinski, R. 2013, in Planets, Stars and Stellar Systems. Volume 5: Galactic Structure and Stellar Populations, ed. T. D. Oswalt & G. Gilmore, Vol. 5, 641, doi: 10.1007/978-94-007-5612-0 13
-
[4]
Bohlin, R. C., Savage, B. D., & Drake, J. F. 1978, ApJ, 224, 132, doi: 10.1086/156357
-
[5]
1953, ApJ, 118, 113, doi: 10.1086/145731
Chandrasekhar, S., & Fermi, E. 1953, ApJ, 118, 113, doi: 10.1086/145731
-
[6]
Chen, C.-Y., King, P. K., & Li, Z.-Y. 2016, ApJ, 829, 84, doi: 10.3847/0004-637X/829/2/84 Magnetic Sculpting of the Riegel–Crutcher Cloud19
-
[7]
Clark, S. E., Peek, J. E. G., & Putman, M. E. 2014, ApJ, 789, 82, doi: 10.1088/0004-637X/789/1/82
-
[8]
Corradi, R. L. M., Aznar, R., & Mampaso, A. 1998, MNRAS, 297, 617, doi: 10.1046/j.1365-8711.1998.01532.x
- [9]
-
[10]
Kirk, J. M. 2004, ApJ, 600, 279, doi: 10.1086/379705
-
[11]
1951, Physical Review, 81, 890, doi: 10.1103/PhysRev.81.890.2
Davis, L. 1951, Physical Review, 81, 890, doi: 10.1103/PhysRev.81.890.2
-
[12]
A., Loinard, L., Ortiz-Le´ on, G
Dzib, S. A., Loinard, L., Ortiz-Le´ on, G. N., Rodr´ ıguez, L. F., & Galli, P. A. B. 2018, ApJ, 867, 151, doi: 10.3847/1538-4357/aae687
-
[13]
Edenhofer, G., Zucker, C., Frank, P., et al. 2024, A&A, 685, A82, doi: 10.1051/0004-6361/202347628
-
[14]
Franco, G. A. P., Alves, F. O., & Girart, J. M. 2010, ApJ, 723, 146, doi: 10.1088/0004-637X/723/1/146 Gaia Collaboration, Vallenari, A., Brown, A. G. A., et al. 2023, A&A, 674, A1, doi: 10.1051/0004-6361/202243940
-
[15]
Han, J. L., Manchester, R. N., Lyne, A. G., Qiao, G. J., & van Straten, W. 2006, ApJ, 642, 868, doi: 10.1086/501444
-
[16]
2015, in Astrophysics and Space Science
Haverkorn, M. 2015, in Astrophysics and Space Science
work page 2015
-
[17]
407, Magnetic Fields in Diffuse Media, ed
Library, Vol. 407, Magnetic Fields in Diffuse Media, ed. A. Lazarian, E. M. de Gouveia Dal Pino, & C. Melioli, 483, doi: 10.1007/978-3-662-44625-6 17
-
[18]
2000, AJ, 119, 923, doi: 10.1086/301236
Heiles, C. 2000, AJ, 119, 923, doi: 10.1086/301236
-
[19]
Vaillancourt, J. E. 2009, ApJ, 696, 567, doi: 10.1088/0004-637X/696/1/567
-
[20]
Hunter, J. D. 2007, Computing in Science & Engineering, 9, 90, doi: 10.1109/MCSE.2007.55
-
[21]
Kalberla, P. M. W., Kerp, J., & Haud, U. 2020, A&A, 639, A26, doi: 10.1051/0004-6361/202037602
-
[22]
Kalberla, P. M. W., Kerp, J., Haud, U., et al. 2016, ApJ, 821, 117, doi: 10.3847/0004-637X/821/2/117
-
[23]
W., Mierle, K., Blanton, M., & Roweis, S
Lang, D., Hogg, D. W., Mierle, K., Blanton, M., & Roweis, S. 2010, AJ, 139, 1782, doi: 10.1088/0004-6256/139/5/1782
-
[24]
Lasker, B. M., Lattanzi, M. G., McLean, B. J., et al. 2008, AJ, 136, 735, doi: 10.1088/0004-6256/136/2/735
-
[25]
Lei, M., & Clark, S. E. 2023, ApJ, 947, 74, doi: 10.3847/1538-4357/acc02a Magalh˜ aes, A. M., Rodrigues, C. V., Margoniner, V. E.,
-
[26]
1996, in Astronomical Society of the Pacific Conference Series, Vol
Pereyra, A., & Heathcote, S. 1996, in Astronomical Society of the Pacific Conference Series, Vol. 97, Polarimetry of the Interstellar Medium, ed. W. G. Roberge & D. C. B. Whittet, 118
work page 1996
-
[27]
Green, A. J., & Haverkorn, M. 2006, ApJ, 652, 1339, doi: 10.1086/508706 Men’shchikov, A., Andr´ e, P., Didelon, P., et al. 2010, A&A, 518, L103, doi: 10.1051/0004-6361/201014668
-
[28]
2010, , 518, L100, 10.1051/0004-6361/201014659
Molinari, S., Swinyard, B., Bally, J., et al. 2010, A&A, 518, L100, doi: 10.1051/0004-6361/201014659
- [29]
-
[30]
Ostriker, E. C., Stone, J. M., & Gammie, C. F. 2001, ApJ, 546, 980, doi: 10.1086/318290 Planck Collaboration, Ade, P. A. R., Aghanim, N., et al. 2015, A&A, 576, A104, doi: 10.1051/0004-6361/201424082 Planck Collaboration, Aghanim, N., Akrami, Y., et al. 2020a, A&A, 641, A1, doi: 10.1051/0004-6361/201833880 —. 2020b, A&A, 641, A3, doi: 10.1051/0004-6361/20...
-
[31]
2017, PASP, 129, 055001, doi: 10.1088/1538-3873/aa54a7
Pereyra, A., & Rubinho, M. 2017, PASP, 129, 055001, doi: 10.1088/1538-3873/aa54a7
- [32]
-
[33]
Roshi, D. A., & Kantharia, N. G. 2011, MNRAS, 414, 519, doi: 10.1111/j.1365-2966.2011.18418.x
-
[34]
2020, MNRAS, 492, 5420, doi: 10.1093/mnras/stz3466
Schisano, E., Molinari, S., Elia, D., et al. 2020, MNRAS, 492, 5420, doi: 10.1093/mnras/stz3466
-
[35]
Soler, J. D., Hennebelle, P., Martin, P. G., et al. 2013, ApJ, 774, 128, doi: 10.1088/0004-637X/774/2/128
-
[36]
D., Beuther, H., Syed, J., et al
Soler, J. D., Beuther, H., Syed, J., et al. 2020, A&A, 642, A163, doi: 10.1051/0004-6361/202038882
-
[37]
Soler, J. D., Miville-Deschˆ enes, M. A., Molinari, S., et al. 2022, A&A, 662, A96, doi: 10.1051/0004-6361/202243334
-
[38]
1992, MNRAS, 259, 413, doi: 10.1093/mnras/259.3.413
Sutherland, W., & Saunders, W. 1992, MNRAS, 259, 413, doi: 10.1093/mnras/259.3.413
-
[39]
Taylor, M. B. 2005, in Astronomical Society of the Pacific Conference Series, Vol. 347, Astronomical Data Analysis Software and Systems XIV, ed. P. Shopbell, M. Britton, & R. Ebert, 29
work page 2005
discussion (0)
Sign in with ORCID, Apple, or X to comment. Anyone can read and Pith papers without signing in.