Recognition: no theorem link
GraphNetz: Statistical Benchmarking of Graph Neural Networks with Paired Tests and Rank Aggregation
Pith reviewed 2026-05-12 03:27 UTC · model grok-4.3
The pith
Four standard graph neural network encoders show no statistically significant performance differences across ten heterogeneous tasks when evaluated with proper paired tests and rank aggregation.
A machine-rendered reading of the paper's core claim, the machinery that carries it, and where it could break.
Core claim
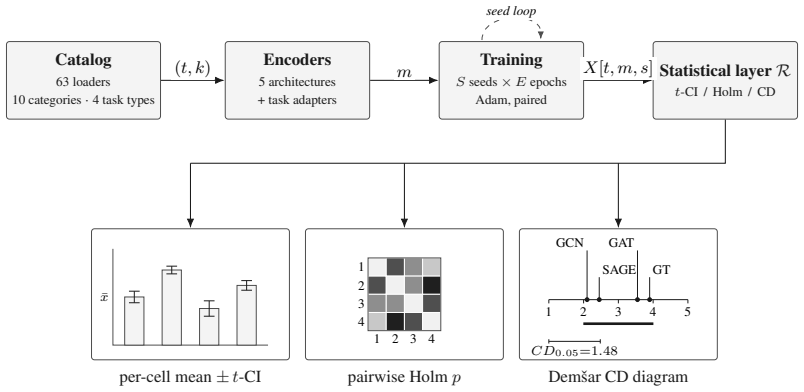
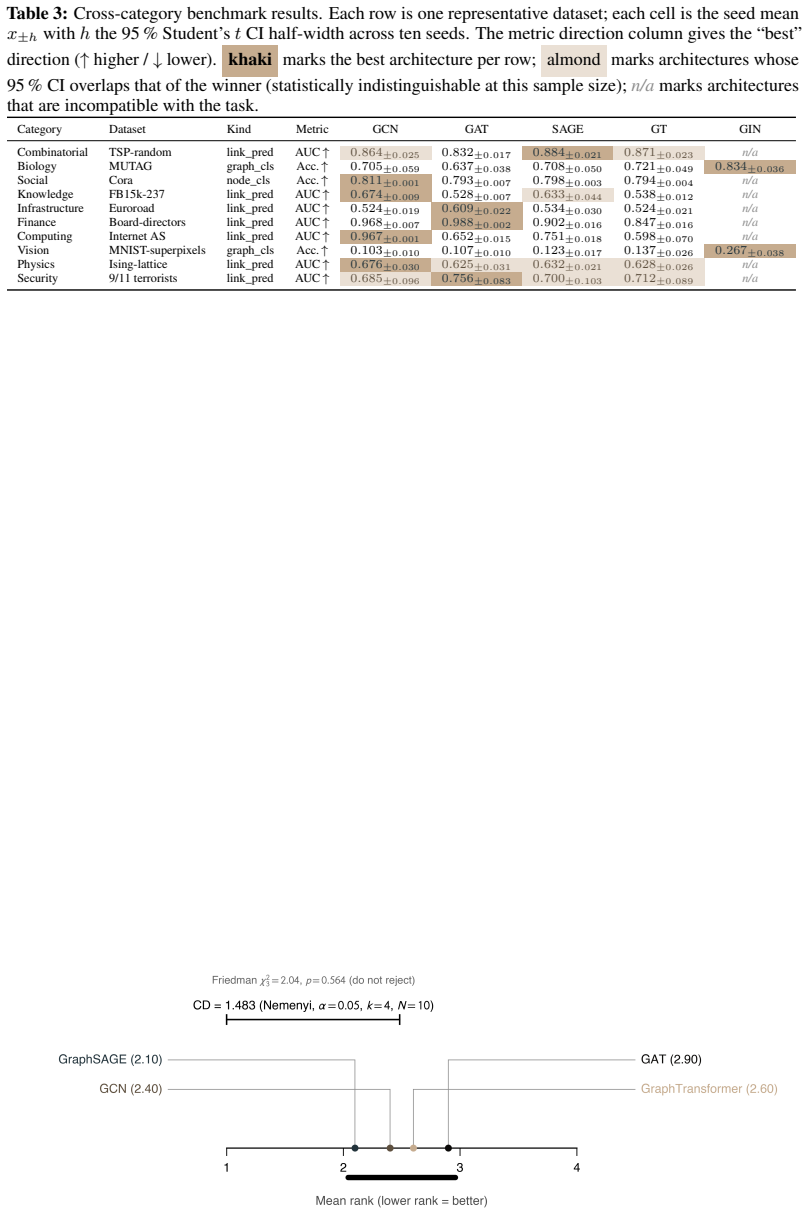
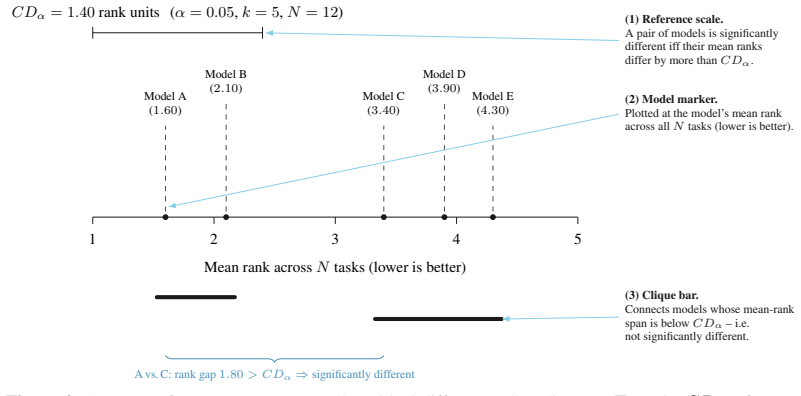
GraphNetz standardizes multi-seed evaluation across 63 dataset loaders, four task types, and five architectures while automatically returning per-cell confidence intervals, Holm-corrected paired tests, and Friedman-Nemenyi critical-difference diagrams. When applied to a cross-category benchmark of ten heterogeneous tasks, the apparent rank differences among four canonical node-level encoders fall inside one Nemenyi clique, so that none can be declared significantly better than the others at alpha equals 0.05. The framework therefore supplies researchers with a computational and statistical pipeline for comparing new graph-learning methods against standards while reporting principled evidence
What carries the argument
The integrated statistical report pipeline that produces per-cell confidence intervals, Holm-corrected paired tests, and Friedman-Nemenyi critical-difference diagrams from multi-seed runs.
If this is right
- New GNN proposals can be benchmarked against the four encoders with direct evidence on whether observed gaps exceed seed and split variation.
- Published performance tables should include multiple-comparison correction rather than raw point estimates or uncorrected p-values.
- Benchmarks that aggregate over heterogeneous tasks become more reliable when they use rank aggregation that respects within-task variance.
- The absence of detectable differences shifts attention from raw accuracy to secondary criteria such as training cost or domain fit.
Where Pith is reading between the lines
- The same statistical discipline could be applied to other high-variance machine-learning domains where single-run tables still dominate.
- Adding more tasks or architectures to the framework would test whether the single-clique pattern persists or breaks in narrower application slices.
- Community extensions of the dataset loaders would let individual papers adopt the statistical report format without rebuilding the pipeline.
Load-bearing premise
The ten chosen tasks and the four encoders are representative enough for the single-clique result to generalize beyond this specific collection.
What would settle it
Re-running the exact ten tasks with the released code and finding at least one pair of encoders placed in separate Nemenyi cliques at alpha equals 0.05 would falsify the no-significant-difference claim.
Figures

read the original abstract
Graph Neural Networks (GNNs) benchmarks often report single point estimates, even when performance differences are small relative to variation across random seeds, train/test splits, and datasets. Confidence intervals, paired comparisons, multiple-comparison correction, and rank-based aggregation are standard statistical tools, but they are rarely the default output of graph-learning benchmark suites. We introduce GraphNetz, a benchmarking framework whose default output is a structured statistical report rather than a raw accuracy table. GraphNetz currently includes 63 dataset loaders, four task types, and five canonical GNN architectures, while also supporting custom datasets and models. The framework standardizes multi-seed evaluation and automatically returns per-cell confidence intervals, Holm-corrected paired tests, and Friedman-Nemenyi critical-difference diagrams across tasks. In a cross-category benchmark over ten heterogeneous tasks, apparent rank differences among four canonical node-level encoders fall within a single Nemenyi clique, indicating that none is significantly better than the others at $\alpha = 0.05$. GraphNetz therefore provides researchers with a reproducible computational and statistical pipeline to benchmark new graph-learning methods against standard architectures, over different tasks and a wide set of applications, while reporting principled statistical evidence for benchmarking which accounts for seed uncertainty. This framework is set to serve the graph-learning community with a reproducible and honest model comparison ready to be added to papers.
Editorial analysis
A structured set of objections, weighed in public.
Referee Report
Summary. The manuscript introduces GraphNetz, a software framework for benchmarking Graph Neural Networks that emphasizes statistical rigor by providing confidence intervals, Holm-corrected paired tests, and Friedman-Nemenyi critical difference diagrams as default outputs. It includes support for 63 datasets, four task types, and five architectures, and demonstrates its use in a benchmark across ten heterogeneous tasks where four canonical node-level GNN encoders show no statistically significant performance differences at α = 0.05, as their ranks fall within one Nemenyi clique.
Significance. If validated, GraphNetz offers a valuable tool for the GNN community to conduct reproducible and statistically sound model comparisons, addressing the common issue of overinterpreting small differences in benchmarks. The empirical demonstration underscores the need for proper statistical testing, though its generalizability depends on the power and representativeness of the chosen tasks. Strengths include the automated pipeline and focus on seed uncertainty.
major comments (1)
- [Cross-category benchmark over ten heterogeneous tasks] The conclusion that none of the four node-level encoders is significantly better than the others at α=0.05 rests on the Friedman-Nemenyi test with N=10 tasks. Given that the critical difference scales with the number of datasets, this design has low statistical power, and moderate differences may go undetected. The manuscript does not include a post-hoc power analysis for the observed rank variances or a sensitivity study varying the task set, which is necessary to substantiate the no-difference claim.
minor comments (1)
- [Abstract] Clarify in the abstract or methods which four of the five canonical architectures were selected for the node-level encoder comparison and the rationale for that selection.
Simulated Author's Rebuttal
We thank the referee for the detailed review and the opportunity to clarify the statistical interpretation of our benchmark results. We address the major comment below.
read point-by-point responses
-
Referee: [Cross-category benchmark over ten heterogeneous tasks] The conclusion that none of the four node-level encoders is significantly better than the others at α=0.05 rests on the Friedman-Nemenyi test with N=10 tasks. Given that the critical difference scales with the number of datasets, this design has low statistical power, and moderate differences may go undetected. The manuscript does not include a post-hoc power analysis for the observed rank variances or a sensitivity study varying the task set, which is necessary to substantiate the no-difference claim.
Authors: We appreciate the referee's observation regarding the statistical power of the Friedman-Nemenyi test in our cross-category benchmark. With N=10 tasks, the test indeed has limited power to detect moderate effect sizes, as the critical difference threshold increases with the number of items being ranked. The manuscript's statement is carefully worded to indicate that the observed ranks fall within one Nemenyi clique, meaning no statistically significant differences were detected at α = 0.05. This does not constitute a claim of equivalence between the encoders, which would require additional evidence such as equivalence testing. The primary purpose of this benchmark is to showcase the automated pipeline provided by GraphNetz, including the generation of critical difference diagrams, rather than to draw definitive conclusions about GNN architectures. To strengthen the manuscript, we will add a paragraph in the results section discussing the limitations of the sample size (N=10) and the implications for power. We will also clarify that the 'no significant difference' finding should be interpreted in light of the test's power. A formal post-hoc power analysis is not standard practice in this domain and can be misleading without pre-specified effect sizes; however, we can report the observed rank variances if helpful. A sensitivity study varying the task set is not included in the current work as it would require a substantially larger experimental budget, but we acknowledge this as a direction for future extensions of the framework. revision: partial
Circularity Check
No circularity: empirical benchmarking framework with standard statistical tests applied to data.
full rationale
The paper introduces GraphNetz as a software framework that standardizes multi-seed GNN evaluation and outputs confidence intervals, Holm-corrected paired tests, and Friedman-Nemenyi diagrams. Its central empirical claim—that four node-level encoders fall in one Nemenyi clique across ten tasks—is the direct result of running these off-the-shelf tests on the collected performance data, not a derivation that reduces to fitted parameters or self-referential definitions. No equations are presented that equate a prediction to its own inputs by construction, and no load-bearing self-citations or uniqueness theorems are invoked to justify the statistical procedures or the no-difference conclusion. The framework is self-contained as a reproducible pipeline whose outputs depend on the chosen datasets, seeds, and models rather than on any internal tautology.
Axiom & Free-Parameter Ledger
axioms (2)
- domain assumption Performance metrics from GNN training runs satisfy the assumptions required for confidence intervals and paired t-tests.
- domain assumption The ten heterogeneous tasks and five canonical architectures are sufficient to support general claims about model ranking.
Reference graph
Works this paper leans on
-
[1]
International Conference on Learning Representations (ICLR) , year =
Semi-Supervised Classification with Graph Convolutional Networks , author =. International Conference on Learning Representations (ICLR) , year =
-
[2]
International Conference on Learning Representations (ICLR) , year =
Graph Attention Networks , author =. International Conference on Learning Representations (ICLR) , year =
-
[3]
International Conference on Learning Representations (ICLR) , year =
How Powerful are Graph Neural Networks? , author =. International Conference on Learning Representations (ICLR) , year =
-
[4]
Advances in Neural Information Processing Systems (NeurIPS) , year =
Inductive Representation Learning on Large Graphs , author =. Advances in Neural Information Processing Systems (NeurIPS) , year =
-
[5]
International Conference on Learning Representations (ICLR) , year =
Deep Graph Infomax , author =. International Conference on Learning Representations (ICLR) , year =
-
[6]
International Joint Conference on Artificial Intelligence (IJCAI) , year =
Masked Label Prediction: Unified Message Passing Model for Semi-Supervised Classification , author =. International Joint Conference on Artificial Intelligence (IJCAI) , year =
-
[7]
Fast Graph Representation Learning with PyTorch Geometric , author =. 2019 , eprint =
work page 2019
-
[8]
The Netzschleuder network catalogue and repository , author =. 2020 , doi =
work page 2020
-
[9]
Morris, Christopher and Kriege, Nils M. and Bause, Franka and Kersting, Kristian and Mutzel, Petra and Neumann, Marion , year =. 2007.08663 , archivePrefix =
-
[10]
Collective Classification in Network Data , author =. AI Magazine , volume =
-
[11]
Empirical Methods in Natural Language Processing (EMNLP) , year =
Representing Text for Joint Embedding of Text and Knowledge Bases , author =. Empirical Methods in Natural Language Processing (EMNLP) , year =
-
[12]
Anti-Money Laundering in Bitcoin: Experimenting with Graph Convolutional Networks for Financial Forensics , author =. 2019 , eprint =
work page 2019
-
[13]
Advances in Neural Information Processing Systems (NeurIPS) Datasets and Benchmarks Track , year =
A Large-Scale Database for Graph Representation Learning , author =. Advances in Neural Information Processing Systems (NeurIPS) Datasets and Benchmarks Track , year =
-
[14]
Collective dynamics of `small-world' networks , author =. Nature , volume =
-
[15]
Journal of Machine Learning Research , volume =
Statistical Comparisons of Classifiers over Multiple Data Sets , author =. Journal of Machine Learning Research , volume =
-
[16]
Scandinavian Journal of Statistics , volume =
A simple sequentially rejective multiple test procedure , author =. Scandinavian Journal of Statistics , volume =
-
[17]
Advances in Neural Information Processing Systems (NeurIPS) , year =
Open Graph Benchmark: Datasets for Machine Learning on Graphs , author =. Advances in Neural Information Processing Systems (NeurIPS) , year =
-
[18]
Workshop on Graph Representation Learning, NeurIPS , year =
Benchmarking Graph Neural Networks , author =. Workshop on Graph Representation Learning, NeurIPS , year =
-
[19]
Stoll, Timo and Qian, Chendi and Finkelshtein, Ben and others , journal =
-
[20]
Workshop on Relational Representation Learning, NeurIPS , year =
Pitfalls of graph neural network evaluation , author =. Workshop on Relational Representation Learning, NeurIPS , year =
-
[21]
International Conference on Learning Representations (ICLR) , year =
A Fair Comparison of Graph Neural Networks for Graph Classification , author =. International Conference on Learning Representations (ICLR) , year =
-
[22]
Advances in Neural Information Processing Systems (NeurIPS) , year =
Long Range Graph Benchmark , author =. Advances in Neural Information Processing Systems (NeurIPS) , year =
-
[23]
A Critical Look at the Evaluation of
Platonov, Oleg and Kuznedelev, Denis and Diskin, Mikhail and Babenko, Artem and Prokhorenkova, Liudmila , booktitle =. A Critical Look at the Evaluation of
-
[24]
Journal of Machine Learning Research , volume =
Should We Really Use Post-Hoc Tests Based on Mean-Ranks? , author =. Journal of Machine Learning Research , volume =. 2016 , url =
work page 2016
-
[25]
Artificial intelligence faces reproducibility crisis , author=. 2018 , publisher=
work page 2018
-
[26]
Forty-second International Conference on Machine Learning Position Paper Track , year=
Position: Graph Learning Will Lose Relevance Due To Poor Benchmarks , author=. Forty-second International Conference on Machine Learning Position Paper Track , year=
-
[27]
Adam: A Method for Stochastic Optimization
Adam: A method for stochastic optimization , author=. arXiv preprint arXiv:1412.6980 , year=
work page internal anchor Pith review Pith/arXiv arXiv
discussion (0)
Sign in with ORCID, Apple, or X to comment. Anyone can read and Pith papers without signing in.