Recognition: 1 theorem link
· Lean TheoremQuantifying Time-Varying Physical Activity Intervention Effects via Functional Regression
Pith reviewed 2026-05-12 02:20 UTC · model grok-4.3
The pith
A functional regression framework quantifies time-varying physical activity intervention effects by modeling full trajectories.
A machine-rendered reading of the paper's core claim, the machinery that carries it, and where it could break.
Core claim
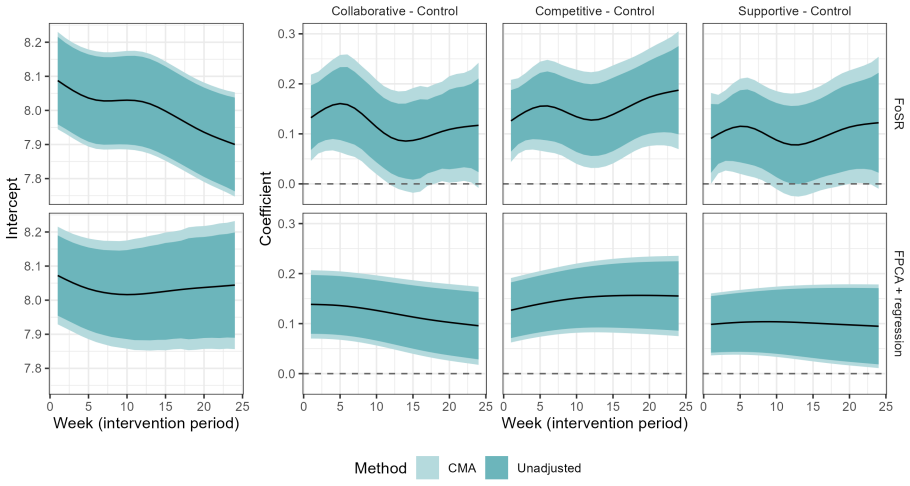
The authors establish that function-on-scalar regression applied to physical activity trajectories directly yields time-specific coefficient functions that describe how each intervention alters activity levels throughout the study period, and that extending the same framework to function-on-function regression further captures associations between activity at different times; in the STEP UP trial this produces distinct, interpretable profiles showing when and how long each of three strategies sustains increased step counts.
What carries the argument
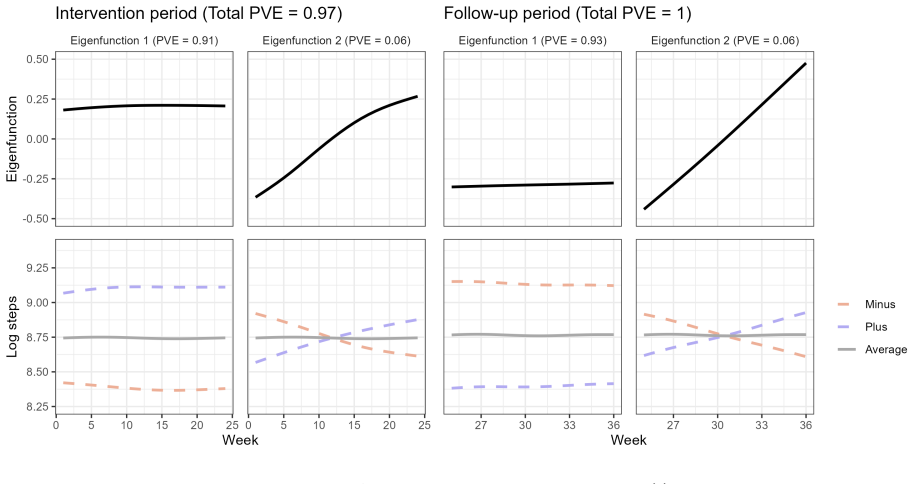
Function-on-scalar regression (FoSR), which treats the full daily activity curve as the response and estimates a separate coefficient function for each scalar covariate (intervention arm) at every time point.
If this is right
- Intervention designers can identify the exact weeks when a given strategy produces its strongest lift and when effects fade.
- The same model flags which strategies maintain elevated activity longest, informing decisions about program length and reinforcement.
- Function-on-function extension allows direct testing of whether high activity on one day predicts activity on later days differently by arm.
- Replacing scalar summaries with full trajectories avoids loss of timing information that traditional two-step FPCA-plus-regression discards.
Where Pith is reading between the lines
- The same functional setup could be applied to other continuous sensor streams such as heart-rate variability or sleep-stage proportions to locate time windows of treatment impact.
- Real-time versions of the model might support adaptive interventions that switch strategies mid-study once early-day coefficient functions indicate waning effects.
- Comparing FoSR results across multiple trials would reveal whether time-varying patterns are reproducible or study-specific.
- The framework naturally supports including time-varying covariates such as weather or calendar events as additional functional predictors.
Load-bearing premise
Daily physical activity counts can be treated as smooth functional observations whose time-varying intervention effects are adequately captured by the chosen functional regression model without substantial bias from discretization or smoothing choices.
What would settle it
Re-analyze the same step-count data after deliberately adding known constant intervention effects across all days and checking whether the estimated coefficient functions still show artificial time variation or recover the flat truth.
Figures


read the original abstract
Physical activity (PA) intervention studies often collect repeated intensity measurements over long observation periods. Quantifying the variation in intervention effects over the study period is critical to evaluating and improving intervention strategies, yet many analyses reduce PA data into scalar summary measures, resulting in limited insights. We propose a functional regression framework, which captures time-varying intervention effects by modeling the entire PA trajectory as a functional observation. From both methodological and practical perspectives, we demonstrate the advantages of function-on-scalar regression (FoSR) over the traditional two-step approach of applying functional principal components analysis (FPCA) followed by regressing scores on covariates. The FoSR is further extended to a function-on-function regression (FoFR) for studying the association of PA across time periods. Methods are applied to daily step counts from the Social incentives to Encourage Physical Activity and Understand Predictors (STEP UP) study, revealing distinct and highly interpretable time-varying effects of three intervention strategies on PA and differences in their sustainability. Our case study highlights the feasibility of functional data analysis techniques for uncovering novel insights in intervention studies with high-dimensional endpoints.
Editorial analysis
A structured set of objections, weighed in public.
Referee Report
Summary. The manuscript proposes a functional regression framework to quantify time-varying effects of physical activity interventions by modeling entire daily PA trajectories as functional observations. It claims methodological and practical advantages of function-on-scalar regression (FoSR) over the traditional two-step FPCA-plus-scalar-regression approach, extends the framework to function-on-function regression (FoFR), and applies the methods to daily step-count data from the STEP UP study to identify distinct, interpretable time-varying intervention effects and differences in sustainability across three strategies.
Significance. If the central claims hold, the work would advance analysis of high-dimensional longitudinal endpoints in intervention studies by recovering time-varying effects that scalar summaries obscure, with direct implications for evaluating and refining PA intervention strategies. The real-data case study supplies concrete, interpretable findings on intervention sustainability that scalar approaches typically miss.
major comments (2)
- [Methods and Results] The manuscript supplies neither simulation studies nor quantitative comparisons (e.g., bias, coverage, or recovery metrics) to substantiate the claimed superiority of FoSR over the FPCA two-step procedure; without these, the central methodological claim cannot be verified from the provided abstract and application alone.
- [Data preprocessing and model specification] Daily step counts are discrete, non-negative integers subject to substantial day-to-day noise; the paper does not report sensitivity analyses or diagnostics for the smoothing/basis-expansion step required to treat these trajectories as smooth functional observations, leaving open the possibility that reported time-varying coefficient estimates are materially affected by preprocessing choices.
minor comments (1)
- [Abstract] The abstract asserts 'highly interpretable' findings and 'advantages' but supplies no numerical summaries, fit statistics, or figure references to allow the reader to assess these claims directly.
Simulated Author's Rebuttal
We thank the referee for the constructive comments. We address each major point below and outline the revisions we will make to strengthen the manuscript.
read point-by-point responses
-
Referee: [Methods and Results] The manuscript supplies neither simulation studies nor quantitative comparisons (e.g., bias, coverage, or recovery metrics) to substantiate the claimed superiority of FoSR over the FPCA two-step procedure; without these, the central methodological claim cannot be verified from the provided abstract and application alone.
Authors: We acknowledge that the current version lacks dedicated simulation studies with quantitative metrics such as bias, coverage, or recovery rates. The advantages of FoSR are illustrated through the direct modeling framework and the interpretable results from the STEP UP application, where time-varying effects are recovered more clearly than with the two-step FPCA approach. To provide rigorous quantitative support for the methodological claim, we will add a simulation study in the revision comparing FoSR and the FPCA two-step procedure across scenarios with known time-varying effects, reporting bias, coverage, and recovery metrics. revision: yes
-
Referee: [Data preprocessing and model specification] Daily step counts are discrete, non-negative integers subject to substantial day-to-day noise; the paper does not report sensitivity analyses or diagnostics for the smoothing/basis-expansion step required to treat these trajectories as smooth functional observations, leaving open the possibility that reported time-varying coefficient estimates are materially affected by preprocessing choices.
Authors: We agree that the discrete and noisy nature of daily step counts makes the smoothing and basis-expansion steps important to validate. In the revised manuscript we will add a dedicated sensitivity analysis section that varies smoothing parameters and basis dimensions, reports cross-validation diagnostics, and shows the impact on the estimated time-varying coefficients. This will confirm the robustness of the reported intervention effects. revision: yes
Circularity Check
No circularity; method proposed independently then applied to external data
full rationale
The paper first defines the FoSR and FoFR models using standard functional data analysis constructions (basis expansions, smoothing), then applies them to the external STEP UP dataset. No equation reduces to a fitted parameter from the target data by construction, no self-citation is load-bearing for the core framework, and the comparison to FPCA is an external benchmark rather than a derived identity. The derivation chain is self-contained against the stated assumptions.
Axiom & Free-Parameter Ledger
axioms (1)
- domain assumption Physical activity trajectories can be modeled as smooth functional observations
Lean theorems connected to this paper
-
IndisputableMonolith/Cost/FunctionalEquation.lean; Foundation/AbsoluteFloorClosure.leanreality_from_one_distinction; washburn_uniqueness_aczel unclearWe propose a functional regression framework... function-on-scalar regression (FoSR) ... P-splines ... eigenfunctions ϕk(t) ... penalized model reduces to linear mixed effects
Reference graph
Works this paper leans on
-
[1]
Canadian Medical Association Journal , volume=
Health benefits of physical activity: the evidence , author=. Canadian Medical Association Journal , volume=. 2006 , publisher=
work page 2006
-
[2]
The physical activity guidelines for
Piercy, Katrina L and Troiano, Richard P and Ballard, Rachel M and Carlson, Susan A and Fulton, Janet E and Galuska, Deborah A and George, Stephanie M and Olson, Richard D , journal=. The physical activity guidelines for. 2018 , publisher=
work page 2018
-
[3]
Physical activity among adults aged 18 and over:
Elgaddal, Nazik and Kramarow, Ellen A and Reuben, Cynthia , year=. Physical activity among adults aged 18 and over:
-
[4]
Differences in amounts and types of physical activity by obesity status in
Spees, Colleen K and Scott, Jonathan M and Taylor, Christopher A , journal=. Differences in amounts and types of physical activity by obesity status in. 2012 , publisher=
work page 2012
-
[5]
Gamification for health promotion: systematic review of behaviour change techniques in smartphone apps , author=. BMJ open , volume=. 2016 , publisher=
work page 2016
-
[6]
Patel, Mitesh S and Benjamin, Emelia J and Volpp, Kevin G and Fox, Caroline S and Small, Dylan S and Massaro, Joseph M and Lee, Jane J and Hilbert, Victoria and Valentino, Maureen and Taylor, Devon H and others , journal=. Effect of a game-based intervention designed to enhance social incentives to increase physical activity among families: the. 2017 , publisher=
work page 2017
-
[7]
Zhang, Jingwen and Brackbill, Devon and Yang, Sijia and Becker, Joshua and Herbert, Natalie and Centola, Damon , journal=. Support or competition?. 2016 , publisher=
work page 2016
-
[8]
Effect of behaviorally designed gamification with social incentives on lifestyle modification among adults with uncontrolled diabetes: A randomized clinical trial , author=. JAMA Network Open , volume=. 2021 , publisher=
work page 2021
-
[9]
Effectiveness of a text-based gamification intervention to improve physical activity among postpartum individuals with hypertensive disorders of pregnancy: A randomized clinical trial , author=. JAMA Cardiology , volume=. 2022 , publisher=
work page 2022
- [10]
-
[11]
Introduction to Functional Data Analysis , author=. 2017 , publisher=
work page 2017
- [12]
- [13]
-
[14]
Flexible smoothing with B-splines and penalties , author=. Statistical science , volume=. 1996 , publisher=
work page 1996
-
[15]
Annual Review of Statistics and Its Application , volume=
Functional data analysis , author=. Annual Review of Statistics and Its Application , volume=. 2016 , publisher=
work page 2016
-
[16]
Annual Review of Statistics and Its Application , volume=
Functional regression , author=. Annual Review of Statistics and Its Application , volume=. 2015 , publisher=
work page 2015
-
[17]
Statistics and Computing , volume=
Fast covariance estimation for high-dimensional functional data , author=. Statistics and Computing , volume=. 2016 , publisher=
work page 2016
-
[18]
Annales Academiae Scientiarun Fennicae Series A1: Mathematia Physica , volume=
Under lineare methoden in der wahr scheinlichkeitsrechnung , author=. Annales Academiae Scientiarun Fennicae Series A1: Mathematia Physica , volume=
-
[19]
Journal of the American statistical association , volume=
Functional data analysis for sparse longitudinal data , author=. Journal of the American statistical association , volume=. 2005 , publisher=
work page 2005
-
[20]
Association between behavioral phenotypes and response to a physical activity intervention using gamification and social incentives: Secondary analysis of the. PLoS One , author=. 2020 , month=oct, pages=. doi:10.1371/journal.pone.0239288 , number=
-
[21]
Harrison, Joseph D. and Jones, Jeremy M. and Small, Dylan S. and Rareshide, Charles A.L. and Szwartz, Gregory and Steier, David and Guszcza, James and Kalra, Pameljit and Torio, Brian and Reh, Gregory and Hilbert, Victoria and Patel, Mitesh S. , year=. Social incentives to encourage physical activity and understand predictors. doi:10.1016/j.cct.2019.04.00...
-
[22]
JAMA Internal Medicine , author=
Effectiveness of Behaviorally Designed Gamification Interventions With Social Incentives for Increasing Physical Activity Among Overweight and Obese Adults Across the. JAMA Internal Medicine , author=. 2019 , month=dec, pages=. doi:10.1001/jamainternmed.2019.3505 , number=
-
[23]
Statistics in Medicine , volume=
Estimation and evaluation of individualized treatment rules following multiple imputation , author=. Statistics in Medicine , volume=. 2023 , publisher=
work page 2023
-
[24]
Buysse, Daniel J and Reynolds, Charles F and Monk, Timothy H and Berman, Susan R and Kupfer, David J , journal=. 1989 , publisher=
work page 1989
-
[25]
and Srivastava, Sanjay , year=
John, Oliver P. and Srivastava, Sanjay , year=. Handbook of Personality: Theory and research, 2nd ed , editor=
-
[26]
Research in Personnel and Human Resources Management , volume=
The Big Five personality dimensions: Implications for research and practice in human resources management , author=. Research in Personnel and Human Resources Management , volume=
-
[27]
Development and validation of the
Duckworth, Angela Lee and Quinn, Patrick D , journal=. Development and validation of the. 2009 , publisher=
work page 2009
-
[28]
Health Education Research , volume=
The development of self-efficacy scales for health-related diet and exercise behaviors , author=. Health Education Research , volume=. 1988 , publisher=
work page 1988
-
[29]
Blais, Ann Ren. A domain-specific risk-taking. Judgment and Decision Making , volume=. 2006 , publisher=
work page 2006
-
[30]
Sherbourne, Cathy Donald and Stewart, Anita L , journal=. The. 1991 , publisher=
work page 1991
-
[31]
Medicine & Science in Sports & Exercise , author=
Pedometer-Measured Physical Activity and Health Behaviors in. Medicine & Science in Sports & Exercise , author=. 2010 , pages=
work page 2010
-
[32]
Research Quarterly for Exercise and Sport , volume=
Individual information-centered approach for handling physical activity missing data , author=. Research Quarterly for Exercise and Sport , volume=. 2009 , publisher=
work page 2009
-
[33]
Mental Health and Physical Activity , volume=
Associations between daily step count trajectories and clinical outcomes among adults with comorbid obesity and depression , author=. Mental Health and Physical Activity , volume=. 2023 , publisher=
work page 2023
-
[34]
Statistics in Biosciences , volume=
Modeling temporal variation in physical activity using functional principal components analysis , author=. Statistics in Biosciences , volume=. 2019 , publisher=
work page 2019
-
[35]
The American Journal of Geriatric Psychiatry , volume=
Phenotyping apathy in individuals with Alzheimer disease using functional principal component analysis , author=. The American Journal of Geriatric Psychiatry , volume=. 2013 , publisher=
work page 2013
-
[36]
The Journals of Gerontology: Series A , volume=
Daily patterns of accelerometer activity predict changes in sleep, cognition, and mortality in older men , author=. The Journals of Gerontology: Series A , volume=. 2018 , publisher=
work page 2018
-
[37]
The effect of season and weather on physical activity: a systematic review , author=. Public Health , volume=. 2007 , publisher=
work page 2007
-
[38]
The Lancet Diabetes & Endocrinology , volume=
Effectiveness of activity trackers with and without incentives to increase physical activity (TRIPPA): a randomised controlled trial , author=. The Lancet Diabetes & Endocrinology , volume=. 2016 , publisher=
work page 2016
-
[39]
R: A Language and Environment for Statistical Computing , author =. 2023 , url =
work page 2023
- [40]
-
[41]
Fast stable restricted maximum likelihood and marginal likelihood estimation of semiparametric generalized linear models , journal =. 2011 , author =
work page 2011
-
[42]
Ulrich Halekoh and Søren Højsgaard and Jun Yan , year =. The. Journal of Statistical Software , volume =
-
[43]
Scandinavian Journal of Statistics , volume=
A simple sequentially rejective multiple test procedure , author=. Scandinavian Journal of Statistics , volume=. 1979 , publisher=
work page 1979
-
[44]
Journal of Computational and Graphical Statistics , volume=
Fast univariate inference for longitudinal functional models , author=. Journal of Computational and Graphical Statistics , volume=. 2022 , publisher=
work page 2022
-
[45]
The International Journal of Biostatistics , volume=
Fast function-on-scalar regression with penalized basis expansions , author=. The International Journal of Biostatistics , volume=. 2010 , publisher=
work page 2010
- [46]
-
[47]
Journal of Computational and Graphical Statistics , volume=
Penalized functional regression , author=. Journal of Computational and Graphical Statistics , volume=. 2011 , publisher=
work page 2011
-
[48]
Computational Statistics , volume=
Penalized function-on-function regression , author=. Computational Statistics , volume=. 2015 , publisher=
work page 2015
-
[49]
Statistical Modelling , volume=
A general framework for functional regression modelling , author=. Statistical Modelling , volume=. 2017 , publisher=
work page 2017
-
[50]
Journal of Computational and Graphical Statistics , volume=
Functional additive mixed models , author=. Journal of Computational and Graphical Statistics , volume=. 2015 , publisher=
work page 2015
-
[51]
Identifiability in penalized function-on-function regression models , author=. 2016 , eprint=
work page 2016
-
[52]
Cui, Erjia and Crainiceanu, Ciprian M and Leroux, Andrew , journal=. Additive functional. 2021 , publisher=
work page 2021
-
[53]
Evidence-based intervention in physical activity: lessons from around the world , author=. The lancet , volume=. 2012 , publisher=
work page 2012
-
[54]
Total volume of physical activity:
Varma, Vijay R and Dey, Debangan and Leroux, Andrew and Di, Junrui and Urbanek, Jacek and Xiao, Luo and Zipunnikov, Vadim , journal=. Total volume of physical activity:. 2018 , publisher=
work page 2018
-
[55]
Aguilera-Morillo, M Carmen and Bu. Variable selection with. Biometrical Journal , volume=. 2020 , publisher=
work page 2020
- [56]
-
[57]
Statistics in Medicine , volume=
Functional Principal Component Analysis as an Alternative to Mixed-Effect Models for Describing Sparse Repeated Measures in Presence of Missing Data , author=. Statistics in Medicine , volume=. 2024 , publisher=
work page 2024
discussion (0)
Sign in with ORCID, Apple, or X to comment. Anyone can read and Pith papers without signing in.