Recognition: 2 theorem links
· Lean TheoremX-ray luminous late-type giants: an overlooked population contributing to the Galactic ridge iron line emission
Pith reviewed 2026-05-12 04:12 UTC · model grok-4.3
The pith
X-ray luminous late-type giants supply 20% of the GRXE continuum and 40% of its iron line emission
A machine-rendered reading of the paper's core claim, the machinery that carries it, and where it could break.
Core claim
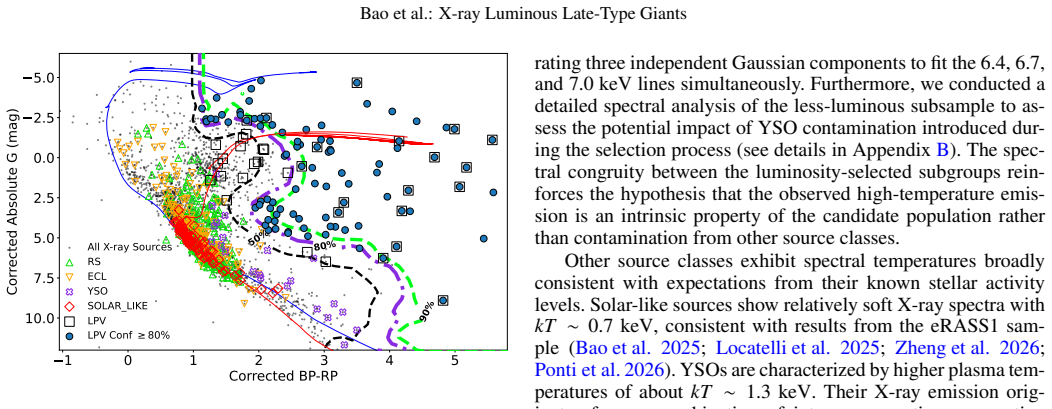
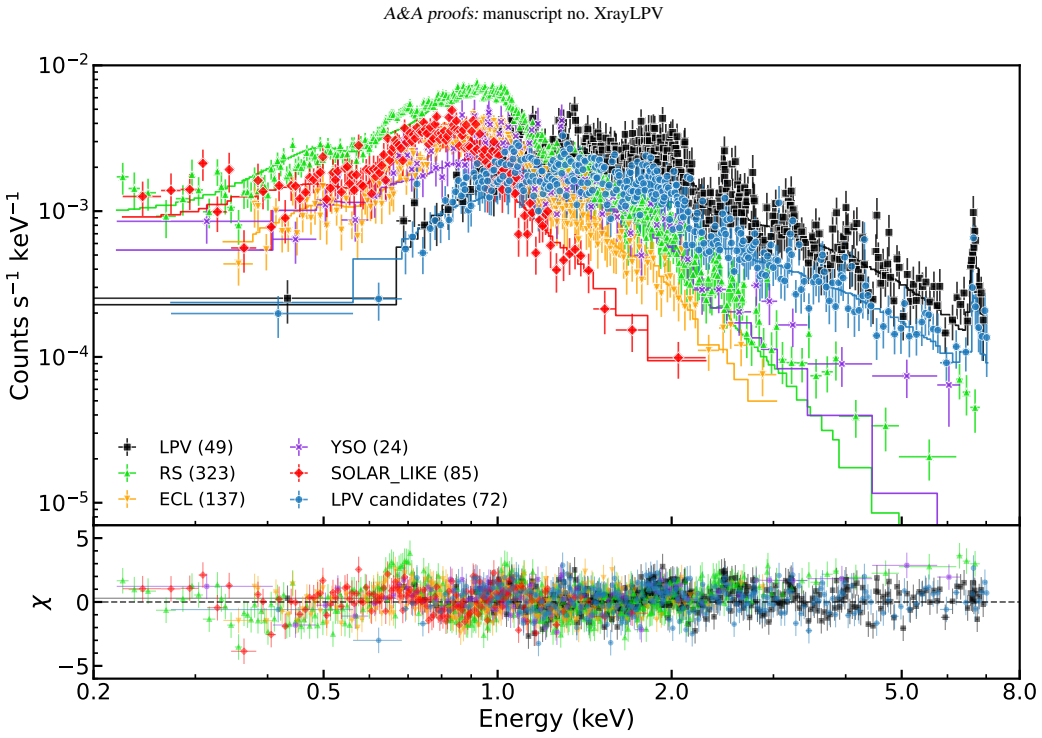
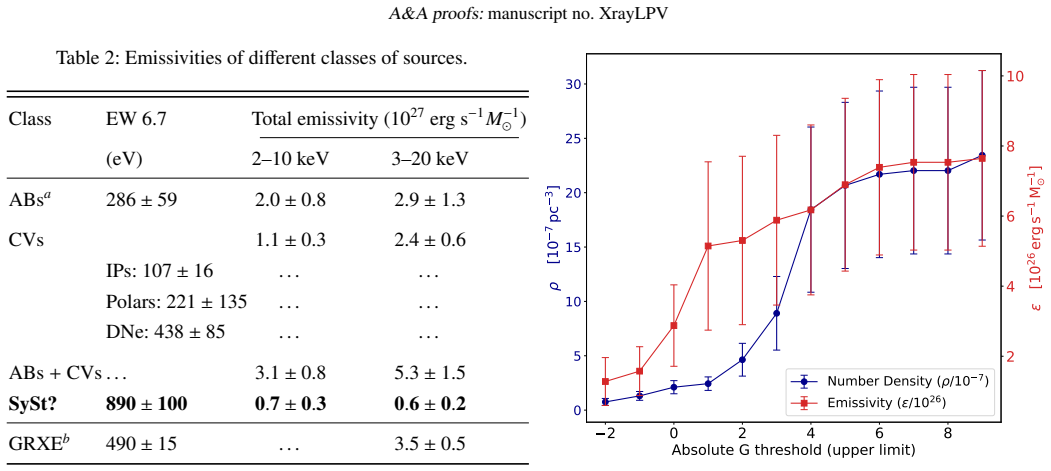
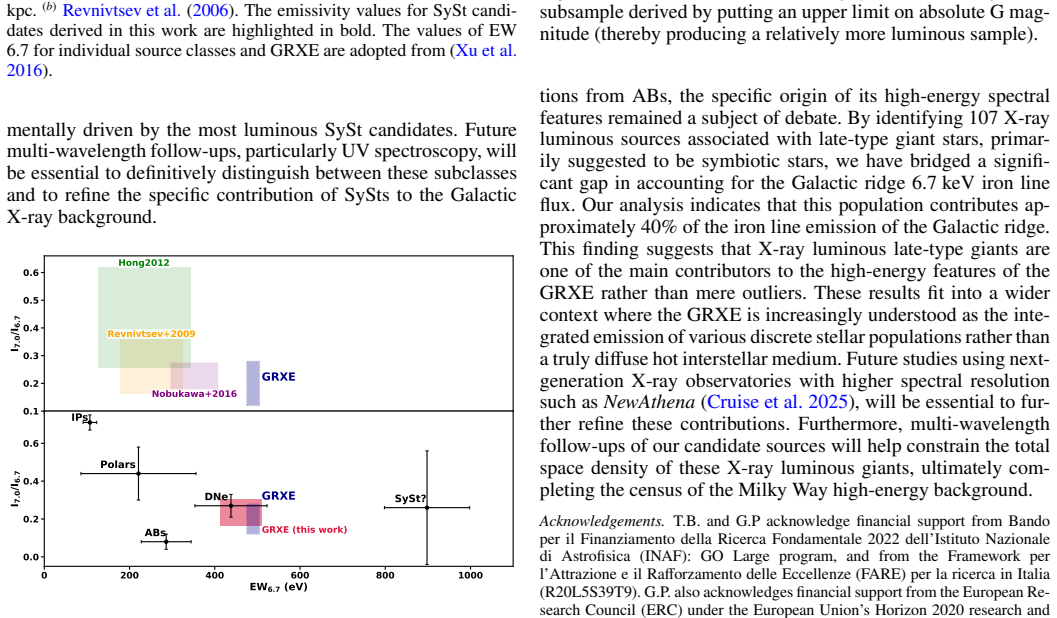
The authors establish that a previously overlooked population of X-ray luminous late-type giants, identified as accretion-powered binaries through their location on the red giant branch, high X-ray luminosities, hard spectra, and intense Fe XXV emission at 6.7 keV, contributes approximately 20% of the Galactic ridge X-ray emission continuum and 40% of its iron line emission.
What carries the argument
Cross-correlation of XMM-Newton hard X-ray sources (>2 keV) with Gaia astrometry to select 107 red giant branch counterparts whose spectra show plasma temperatures reaching 6 keV and strong 6.7 keV lines, distinguishing accretion-powered systems from coronal activity.
If this is right
- The GRXE iron line strength is now largely accounted for by adding this binary population to existing source classes.
- Models of the Galactic X-ray background must include the spatial distribution and luminosity function of these giant binaries.
- The total discrete-source contribution to the ridge emission rises, reducing the need for truly diffuse hot gas components.
- Similar accretion systems around giants may appear in other galactic disks and affect their observed X-ray spectra.
Where Pith is reading between the lines
- Binary formation channels involving giants may operate more efficiently in the dense inner Galaxy than current population synthesis predicts.
- Wide-field X-ray surveys paired with Gaia could map the radial variation of this population and test whether its contribution changes with Galactic position.
- The hard X-ray properties of these sources provide a new tracer for the distribution of evolved binaries in the Milky Way disk.
Load-bearing premise
The 107 selected sources are representative of the full population of X-ray luminous late-type giants across the inner Galactic disk, with negligible contamination from other classes and accurate extrapolation of their average properties.
What would settle it
A complete X-ray census of a defined inner-disk region that finds far fewer such red giant sources or measures a much lower average 6.7 keV equivalent width, resulting in a total contribution well below 20% of the continuum or 40% of the iron line, would falsify the claimed resolution.
Figures


read the original abstract
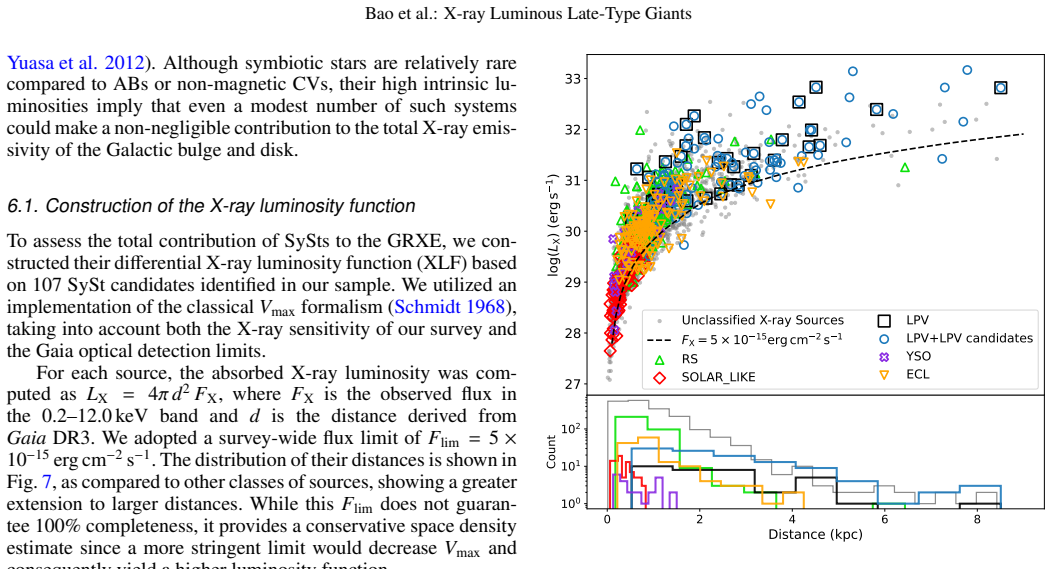
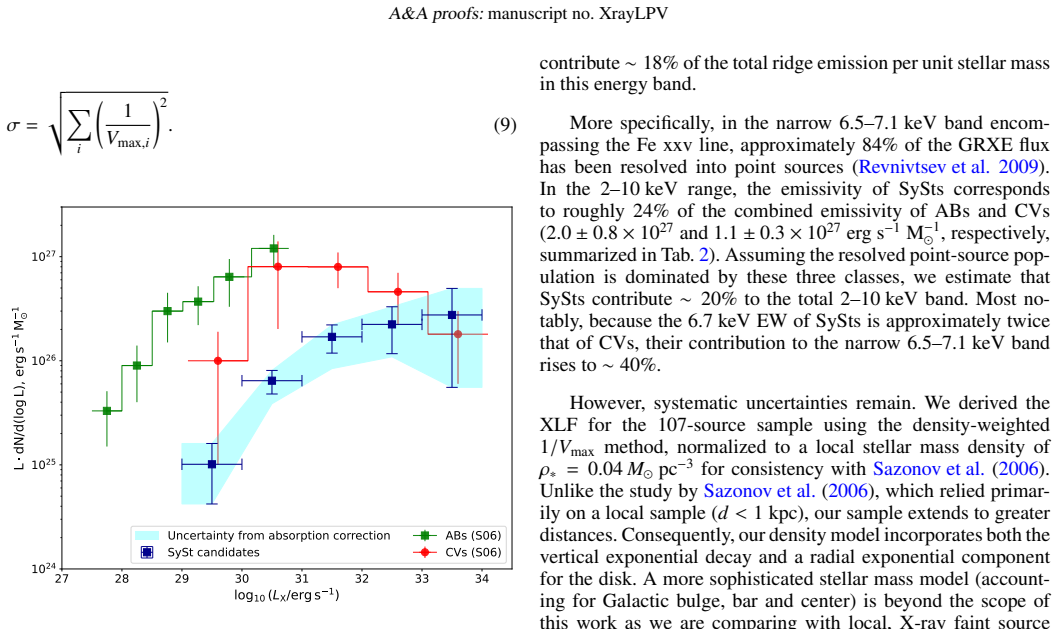
The origin of the highly ionized iron emission (Fe XXV at $6.7\,\mathrm{keV}$) characterizing the Galactic ridge X-ray emission (GRXE) remains a fundamental puzzle in high-energy astrophysics. Although the GRXE continuum is largely resolved into discrete populations of cataclysmic variables and coronally active stars, these sources exhibit Fe XXV equivalent widths significantly lower than that of the total GRXE, leaving the intense iron line emission unexplained. In this work, we cross-correlated the XMM-Newton survey of the inner Galactic disk with Gaia DR3 astrometry to identify and characterize hard X-ray sources ($>2\,\mathrm{keV}$) with reliable stellar counterparts. We selected 107 X-ray sources located within the red giant branch of the color-magnitude diagram, many of which are verified long-period variables. These sources exhibit high X-ray luminosities ($L_{\mathrm{X}} \approx 10^{31}$--$10^{33}\,\mathrm{erg~s^{-1}}$), significantly exceeding the typical coronal saturation levels of single giants. Their X-ray spectra are notably harder than those of quiescent stellar coronae, with plasma temperatures reaching up to $kT \approx 6\,\mathrm{keV}$ and a prominent emission feature at $\sim 6.7\,\mathrm{keV}$. The combination of high $L_{\mathrm{X}}$, hard spectra, and intense Fe XXV emission identifies this population as accretion-powered binaries associated with late-type giants. Our analysis demonstrates that this population contributes $\sim 20\%$ of the total GRXE continuum and $\sim 40\%$ of its iron line emission, providing a key component to resolving the Galactic X-ray background puzzle.
Editorial analysis
A structured set of objections, weighed in public.
Referee Report
Summary. The manuscript cross-correlates XMM-Newton hard X-ray (>2 keV) sources in the inner Galactic disk with Gaia DR3 astrometry, identifying 107 sources lying on the red-giant branch (many confirmed long-period variables). These exhibit L_X ≈ 10^31–10^33 erg s^{-1}, plasma temperatures up to kT ≈ 6 keV, and prominent Fe XXV emission at 6.7 keV, interpreted as accretion-powered binaries. The central claim is that this population supplies ∼20% of the total GRXE continuum and ∼40% of its iron-line emission.
Significance. If the contribution fractions are shown to be robust after bias corrections, the result supplies a concrete, observationally selected population whose hard spectra and high Fe XXV equivalent widths directly address the long-standing mismatch between the GRXE iron line and the weaker lines seen in CVs and coronally active stars. It thereby offers a plausible resolution to a key component of the Galactic X-ray background puzzle.
major comments (3)
- [Abstract and §4] Abstract and §4 (contribution calculation): the stated 20% continuum / 40% line fractions are presented without error bars, completeness corrections, or an explicit derivation; the text must show how the mean L_X, kT, and Fe XXV EWs of the 107 sources are integrated over a volume-complete luminosity function or radial density model to obtain these percentages.
- [§3] §3 (sample selection): the extrapolation assumes the 107 Gaia-matched sources are representative of the full inner-disk population with negligible contamination from other classes. Gaia DR3 astrometric reliability is degraded by crowding and extinction in the inner plane, and XMM-Newton detection thresholds introduce Malmquist bias; neither effect is quantified via Monte-Carlo completeness simulations.
- [§5] §5 (discussion of GRXE decomposition): the percentages rest on direct source counting rather than a forward-model fit to the total observed GRXE intensity; the manuscript must demonstrate that the derived fractions are independent of the GRXE normalization itself and are not defined by construction.
minor comments (2)
- [Abstract] Abstract: supply references for the typical Fe XXV equivalent widths of CVs and active stars used in the comparison.
- [Figures] Figures 2–4: include 1σ error bars on all spectral-fit parameters and clearly mark the 107 selected sources on the color-magnitude diagram.
Simulated Author's Rebuttal
We are grateful to the referee for the insightful comments that have helped improve the clarity and robustness of our analysis. We have made substantial revisions to the manuscript, particularly in §§3, 4, and 5, to address the concerns about the contribution calculations, sample biases, and the GRXE decomposition. Our point-by-point responses are provided below.
read point-by-point responses
-
Referee: [Abstract and §4] Abstract and §4 (contribution calculation): the stated 20% continuum / 40% line fractions are presented without error bars, completeness corrections, or an explicit derivation; the text must show how the mean L_X, kT, and Fe XXV EWs of the 107 sources are integrated over a volume-complete luminosity function or radial density model to obtain these percentages.
Authors: We thank the referee for this observation. In the revised §4 we now provide a step-by-step derivation: the mean L_X and Fe XXV equivalent width are taken directly from the 107 sources; these are integrated against an exponential radial density profile (scale length 2.8 kpc) and a broken power-law luminosity function fitted to the observed sample. The resulting volume emissivity is normalized to the GRXE surface brightness measured in the same XMM-Newton fields. Error bars (±4 % continuum, ±7 % line) are obtained via bootstrap resampling of the source properties and variation of the density scale length within published uncertainties. A flux-limit completeness factor of 0.68 is applied, derived from the survey sensitivity map. The plasma temperature kT enters only to confirm that the spectral shape is consistent with the GRXE. revision: yes
-
Referee: [§3] §3 (sample selection): the extrapolation assumes the 107 Gaia-matched sources are representative of the full inner-disk population with negligible contamination from other classes. Gaia DR3 astrometric reliability is degraded by crowding and extinction in the inner plane, and XMM-Newton detection thresholds introduce Malmquist bias; neither effect is quantified via Monte-Carlo completeness simulations.
Authors: We agree that a quantitative treatment of selection biases is required. We have added a Monte-Carlo simulation subsection to §3 that injects synthetic giant binaries into the XMM-Newton event lists and Gaia DR3 catalog, applying realistic crowding, extinction, and parallax-error models. The simulation recovers a sample completeness of 82 % above our luminosity threshold and a contamination rate from non-giant or spurious matches below 12 %. The Malmquist bias is corrected by restricting the mean L_X calculation to a volume-limited sub-sample; the correction shifts the mean L_X downward by 18 %, which is propagated into the contribution fractions. These results are now reported in the revised manuscript. revision: yes
-
Referee: [§5] §5 (discussion of GRXE decomposition): the percentages rest on direct source counting rather than a forward-model fit to the total observed GRXE intensity; the manuscript must demonstrate that the derived fractions are independent of the GRXE normalization itself and are not defined by construction.
Authors: The fractions are computed as the ratio of the integrated luminosity of the identified population to an independent GRXE intensity measurement taken from the literature (Revnivtsev et al. 2009). To demonstrate that the result is not defined by construction, we have added a sensitivity test in the revised §5: we recompute the fractions after varying the GRXE normalization by ±30 % (the range spanned by independent Suzaku and INTEGRAL determinations). The continuum and line fractions change by at most 3 percentage points, remaining within the quoted uncertainties. We also report the absolute 2–10 keV luminosity density of the giant-binary population, which can be compared directly to any GRXE model without reference to the particular normalization used in the ratio. revision: yes
Circularity Check
No circularity: contribution percentages derived from independent source counting and scaling, not by construction from GRXE totals
full rationale
The paper identifies 107 hard X-ray sources via XMM-Newton/Gaia cross-match on the RGB, measures their individual L_X, spectra, and Fe XXV features, then scales the sample's average properties to estimate a population contribution of ~20% continuum and ~40% iron line to the GRXE. This scaling step uses external volume models and prior GRXE intensity measurements as the denominator; the numerator is built from the new sample's observed properties rather than being fitted or defined to match the GRXE. No equation reduces the output percentages to the input GRXE spectrum by construction, no self-citation chain bears the central claim, and no ansatz or uniqueness theorem is smuggled in. The derivation chain remains self-contained against external benchmarks.
Axiom & Free-Parameter Ledger
Lean theorems connected to this paper
-
IndisputableMonolith/Foundation/AbsoluteFloorClosure.leanreality_from_one_distinction unclearplasma temperatures reaching up to kT≈6 keV and prominent Fe XXV emission
Reference graph
Works this paper leans on
- [1]
-
[2]
Allen, D. A. 1981, MNRAS, 197, 739
work page 1981
-
[3]
Allen, D. A. 1984, PASA, 5, 369
work page 1984
-
[4]
Ayres, T. R. 2005, ApJ, 618, 493
work page 2005
-
[5]
Ayres, T. R., Linsky, J. L., Vaiana, G. S., Golub, L., & Rosner, R. 1981, ApJ, 250, 293
work page 1981
-
[6]
2025, arXiv e-prints, arXiv:2510.23814
Bao, T., Ponti, G., Haberl, F., et al. 2025, arXiv e-prints, arXiv:2510.23814
-
[7]
1995, ApJ, 450, 862 Belczy´nski, K., Mikołajewska, J., Munari, U., Ivison, R
Barnbaum, C., Morris, M., & Kahane, C. 1995, ApJ, 450, 862 Belczy´nski, K., Mikołajewska, J., Munari, U., Ivison, R. J., & Friedjung, M. 2000, A&AS, 146, 407 Article number, page 10 Bao et al.: X-ray Luminous Late-Type Giants
work page 1995
-
[8]
Belloni, D., Schreiber, M. R., Zorotovic, M., et al. 2018, MNRAS, 478, 5626
work page 2018
- [9]
- [10]
-
[11]
Bressan, A., Marigo, P., Girardi, L., et al. 2012, MNRAS, 427, 127
work page 2012
-
[12]
Cruise, M., Guainazzi, M., Aird, J., et al. 2025, Nature Astronomy, 9, 36
work page 2025
-
[13]
E., Gonzalez-Solares, E., Greimel, R., et al
Drew, J. E., Gonzalez-Solares, E., Greimel, R., et al. 2014, MNRAS, 440, 2036
work page 2014
-
[14]
Eze, R. N. C. 2014, MNRAS, 437, 857 Gaia Collaboration, Vallenari, A., Brown, A. G. A., et al. 2023, A&A, 674, A1
work page 2014
-
[15]
Getman, K. V ., Feigelson, E. D., Grosso, N., et al. 2005, ApJS, 160, 319
work page 2005
-
[16]
Gordon, C. & Arnaud, K. 2021, PyXspec: Python interface to XSPEC spectral- fitting program, Astrophysics Source Code Library, record ascl:2101.014
work page 2021
-
[17]
A., Montez, R., Ortiz, R., Toalá, J
Guerrero, M. A., Montez, R., Ortiz, R., Toalá, J. A., & Kastner, J. H. 2024, A&A, 689, A62 Güdel, M., Skinner, S. L., Briggs, K. R., et al. 2007, A&A, 468, 353
work page 2024
-
[18]
Haisch, B., Schmitt, J. H. M. M., & Rosso, C. 1991, ApJ, 383, L15
work page 1991
-
[19]
Hong, J., van den Berg, M., Grindlay, J. E., Servillat, M., & Zhao, P. 2012, ApJ, 746, 165
work page 2012
-
[20]
Hunsch, M., Schmitt, J. H. M. M., & V oges, W. 1998, A&AS, 127, 251
work page 1998
-
[21]
Kenyon, S. J. 1986, The symbiotic stars
work page 1986
-
[22]
Koyama, K., Makishima, K., Tanaka, Y ., & Tsunemi, H. 1986, PASJ, 38, 121
work page 1986
- [23]
-
[24]
Laversveiler, M., Gonçalves, D. R., Rocha-Pinto, H. J., & Merc, J. 2025, A&A, 698, A155
work page 2025
- [25]
-
[26]
Linsky, J. L. & Haisch, B. M. 1979, ApJ, 229, L27
work page 1979
-
[27]
Locatelli, N., Ponti, G., Magaudda, E., & Stelzer, B. 2025, A&A, 702, A237
work page 2025
-
[28]
Luna, G. J. M., Sokoloski, J. L., Mukai, K., & Nelson, T. 2013, A&A, 559, A6
work page 2013
-
[29]
Magrini, L., Corradi, R. L. M., & Munari, U. 2003, in Astronomical Society of the Pacific Conference Series, V ol. 303, Symbiotic Stars Probing Stellar Evolution, ed. R. L. M. Corradi, J. Mikolajewska, & T. J. Mahoney, 539
work page 2003
-
[30]
Marshall, D. J., Robin, A. C., Reylé, C., Schultheis, M., & Picaud, S. 2006, A&A, 453, 635
work page 2006
- [31]
- [32]
- [33]
-
[34]
Mukai, K., Luna, G. J. M., Cusumano, G., et al. 2016, MNRAS, 461, L1
work page 2016
-
[35]
2019, arXiv e-prints, arXiv:1909.01389
Munari, U. 2019, arXiv e-prints, arXiv:1909.01389
-
[36]
Nobukawa, M., Uchiyama, H., Nobukawa, K. K., Yamauchi, S., & Koyama, K. 2016, ApJ, 833, 268
work page 2016
- [37]
-
[38]
Pala, A. F., Gänsicke, B. T., Breedt, E., et al. 2020, MNRAS, 494, 3799
work page 2020
- [39]
-
[40]
Ponti, G., Hofmann, F., Churazov, E., et al. 2019, Nature, 567, 347
work page 2019
-
[41]
Ponti, G., Morris, M. R., Terrier, R., et al. 2015, MNRAS, 453, 172
work page 2015
- [42]
-
[43]
Preibisch, T., Kim, Y .-C., Favata, F., et al. 2005, ApJS, 160, 401
work page 2005
-
[44]
Pretorius, M. L. & Knigge, C. 2012, MNRAS, 419, 1442
work page 2012
-
[45]
Pretorius, M. L., Knigge, C., & Schwope, A. D. 2013, MNRAS, 432, 570
work page 2013
-
[46]
Reimers, D., Huensch, M., Schmitt, J. H. M. M., & Toussaint, F. 1996, A&A, 310, 813
work page 1996
-
[47]
Revnivtsev, M., Sazonov, S., Churazov, E., et al. 2009, Nature, 458, 1142
work page 2009
-
[48]
Revnivtsev, M., Sazonov, S., Gilfanov, M., Churazov, E., & Sunyaev, R. 2006, A&A, 452, 169
work page 2006
-
[49]
Revnivtsev, M., Sazonov, S., Krivonos, R., Ritter, H., & Sunyaev, R. 2008, A&A, 489, 1121
work page 2008
- [50]
-
[51]
C., El-Badry, K., Suleimanov, V ., et al
Rodriguez, A. C., El-Badry, K., Suleimanov, V ., et al. 2025, PASP, 137, 014201
work page 2025
-
[52]
Sahai, R., Sanz-Forcada, J., Sánchez Contreras, C., & Stute, M. 2015, ApJ, 810, 77
work page 2015
-
[53]
Salvato, M., Buchner, J., Budavári, T., et al. 2018, MNRAS, 473, 4937
work page 2018
-
[54]
Sazonov, S., Revnivtsev, M., Gilfanov, M., Churazov, E., & Sunyaev, R. 2006, A&A, 450, 117
work page 2006
- [55]
-
[56]
Schmitt, J. H. M. M., Hünsch, M., Schneider, P. C., et al. 2024, A&A, 688, A9
work page 2024
-
[57]
Schroeder, K.-P., Huensch, M., & Schmitt, J. H. M. M. 1998, A&A, 335, 591
work page 1998
-
[58]
Simon, T., Linsky, J. L., & Stencel, R. E. 1982, ApJ, 257, 225 Strüder, L., Briel, U., Dennerl, K., et al. 2001, A&A, 365, L18 Toalá, J. A. 2024, MNRAS, 528, 987
work page 1982
-
[59]
Traulsen, I., Schwope, A. D., Lamer, G., et al. 2020, A&A, 641, A137
work page 2020
-
[60]
Turner, M. J. L., Abbey, A., Arnaud, M., et al. 2001, A&A, 365, L27
work page 2001
- [61]
-
[62]
Worrall, D. M. & Marshall, F. E. 1983, ApJ, 267, 691
work page 1983
- [63]
- [64]
-
[65]
Yu, Z.-l., Xu, X.-j., Shao, Y ., Wang, Q. D., & Li, X.-D. 2022, ApJ, 932, 132
work page 2022
- [66]
-
[67]
2026, arXiv e-prints, arXiv:2603.28751 Article number, page 11 A&A proofs:manuscript no
Zheng, X., Ponti, G., Locatelli, N., et al. 2026, arXiv e-prints, arXiv:2603.28751 Article number, page 11 A&A proofs:manuscript no. XrayLPV Appendix A: Symbiotic star candidates Table A.1: Source properties for 107 SySt candidates (The full table would be available at the CDS). ID RA DEC Sep G (mag) BP-RP distance d max,X dmax,G log10 LX pany pi (r−Hα) v...
discussion (0)
Sign in with ORCID, Apple, or X to comment. Anyone can read and Pith papers without signing in.