Recognition: unknown
Interactively visualizing biological multilayer networks using MiRA
Pith reviewed 2026-05-14 21:12 UTC · model grok-4.3
The pith
MiRA is a browser-based tool that supplies seven complementary visualization modes to let researchers interactively navigate biological multilayer networks.
A machine-rendered reading of the paper's core claim, the machinery that carries it, and where it could break.
Core claim
MiRA is a browser-based, installation-free web application that offers seven complementary visualization modes and interactive features specifically tailored for biological multilayer networks, enabling visual navigation of their high complexity.
What carries the argument
Seven complementary visualization modes together with interactive features inside a browser-based application that allow switching views to manage multilayer complexity.
Load-bearing premise
The seven visualization modes and interactive features are effective and sufficient for navigating multilayer network complexity.
What would settle it
A user study in which biologists complete standard multilayer analysis tasks no faster or more accurately with MiRA than with existing static or alternative visualization methods.
Figures


read the original abstract
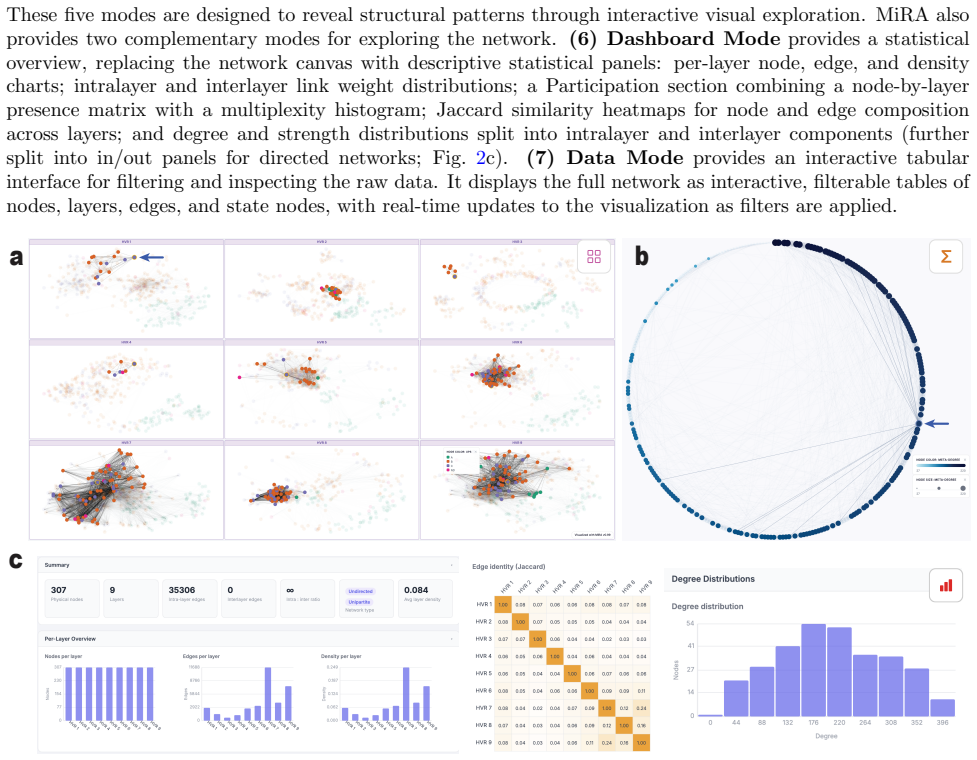
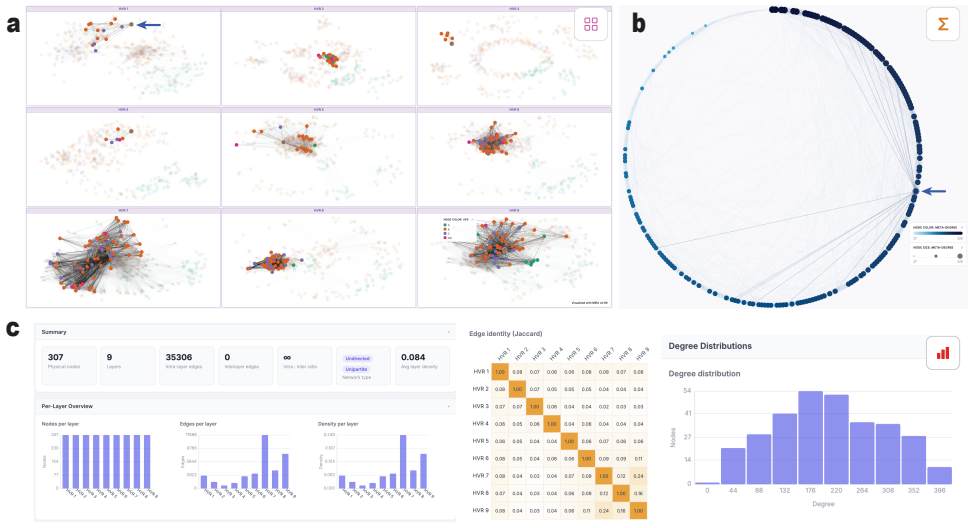
Multilayer networks are widely used across biology to represent systems in which complex networks vary across space, time, or interaction types. However, interactive visualization tools remain limited. We present MiRA (Multilayer Interactive Rendering Application), a browser-based, installation-free web application for visualizing biological multilayer networks. MiRA offers seven complementary visualization modes and interactive features that enable researchers to visually navigate the high complexity of multilayer networks for research and education.
Editorial analysis
A structured set of objections, weighed in public.
Referee Report
Summary. The paper presents MiRA, a browser-based, installation-free web application for visualizing biological multilayer networks. It offers seven complementary visualization modes and interactive features to enable researchers to visually navigate the high complexity of multilayer networks for research and education.
Significance. If the tool functions as described, it provides a useful, accessible platform for exploring multilayer biological networks, addressing the limited availability of interactive visualization tools in this area. This could aid both research and educational efforts in understanding complex biological systems.
major comments (1)
- Abstract and §3: The claim that the seven visualization modes and interactive features enable researchers to visually navigate the high complexity of multilayer networks lacks supporting evidence such as user studies, benchmarks, or comparisons to existing tools. This makes the effectiveness an unverified assumption rather than a demonstrated result.
minor comments (1)
- Consider including screenshots or figures demonstrating each of the seven visualization modes with a sample biological multilayer network to improve clarity of the described features.
Simulated Author's Rebuttal
We thank the referee for the positive assessment and the recommendation for minor revision. We address the single major comment point by point below.
read point-by-point responses
-
Referee: [—] Abstract and §3: The claim that the seven visualization modes and interactive features enable researchers to visually navigate the high complexity of multilayer networks lacks supporting evidence such as user studies, benchmarks, or comparisons to existing tools. This makes the effectiveness an unverified assumption rather than a demonstrated result.
Authors: We appreciate the referee highlighting this point. The manuscript is a tool-description paper whose primary contribution is the presentation of MiRA’s seven complementary visualization modes and their interactive controls, each motivated by specific challenges in biological multilayer data (e.g., cross-layer navigation, temporal slicing, and attribute filtering). The claim in the abstract and §3 is therefore grounded in the design rationale rather than in new empirical validation. We did not perform user studies or formal benchmarks, as these fall outside the scope of the current work. In the revised manuscript we will (i) add a concise comparison subsection that situates MiRA against existing multilayer visualization systems, (ii) include additional usage examples that illustrate how the modes jointly reduce visual complexity, and (iii) soften the wording to indicate that the modes are intended to enable navigation on the basis of their complementary design. These changes constitute a partial revision. revision: partial
Circularity Check
No circularity in software tool presentation
full rationale
The paper is a direct description of the MiRA web application and its seven visualization modes plus interactive features. No equations, derivations, parameter fits, predictions, or self-citation chains appear in the provided text. The central claim enumerates implemented capabilities without reducing any result to its own inputs by construction. This matches the expected non-finding for a tool paper lacking mathematical structure.
Axiom & Free-Parameter Ledger
Reference graph
Works this paper leans on
-
[1]
Complex Netw.2,203–271 (2014)
Kivela, Met al.Multilayer networks.J. Complex Netw.2,203–271 (2014)
2014
-
[2]
A., Pascual, M
Pilosof, S., Porter, M. A., Pascual, M. & K´ efi, S. The multilayer nature of ecological networks.Nat. Ecol. Evol.1,101 (2017)
2017
-
[3]
& Muldoon, S
Vaiana, M. & Muldoon, S. F. Multilayer brain networks.J. Nonlinear Sci.30,2147–2169 (2020)
2020
-
[4]
Sood, M.et al.Spreading processes with mutations over multilayer networks.Proc. Natl. Acad. Sci. U. S. A.120,e2302245120 (2023)
2023
-
[5]
T.et al.Multilayer networks of plasmid genetic similarity reveal potential pathways of gene transmission.ISME J.17,649–659 (2023)
Shapiro, J. T.et al.Multilayer networks of plasmid genetic similarity reveal potential pathways of gene transmission.ISME J.17,649–659 (2023)
2023
-
[6]
& Kramer, F
Hammoud, Z. & Kramer, F. Multilayer networks: aspects, implementations, and application in biomedicine. Big Data Anal.5,2 (2020)
2020
-
[7]
& Pilosof, S
Galai, G., He, X., Rotblat, B. & Pilosof, S. Ecological network analysis reveals cancer-dependent chaperone- client interaction structure and robustness.Nat. Commun.14,1–11 (2023)
2023
-
[8]
Aleta, A.et al.Multilayer network science: theory, methods, and applications.arXiv [physics.soc-ph] (2026)
2026
-
[9]
More is different in real-world multilayer networks.Nat
De Domenico, M. More is different in real-world multilayer networks.Nat. Phys.19,1247–1262 (2023)
2023
-
[10]
The state of the art in multilayer network visualization.Comput
McGee, F, Ghoniem, M, Melan¸ con, G, Otjacques, B & Pinaud, B. The state of the art in multilayer network visualization.Comput. Graph. Forum38,125–149 (2019)
2019
-
[11]
D., Porter, M
De Domenico, M. D., Porter, M. A. & Arenas, A. MuxViz: a tool for multilayer analysis and visualization of networks.J. Complex Networks3,159–176 (2015)
2015
-
[12]
(Springer Nature, Cham, Switzerland, 2022)
De Domenico, M.Multilayer networks: Analysis and visualization: Introduction to muxViz with R2021st ed. (Springer Nature, Cham, Switzerland, 2022)
2022
-
[13]
A., Panayiotou, N
Karatzas, E., Baltoumas, F. A., Panayiotou, N. A., Schneider, R. & Pavlopoulos, G. A. Arena3Dweb: interactive 3D visualization of multilayered networks.Nucleic Acids Res.49,W36–W45 (2021)
2021
-
[14]
Bioinform
Kokoli, M.et al.Arena3Dweb: interactive 3D visualization of multilayered networks supporting multiple directional information channels, clustering analysis and application integration.NAR Genom. Bioinform. 5,lqad053 (2023)
2023
-
[15]
& Pilosof, S
Frydman, N., Freilikhman, S., Talpaz, I. & Pilosof, S. Practical guidelines and the EMLN R package for handling ecological multilayer networks.Methods Ecol. Evol.14,2964–2973 (2023)
2023
-
[16]
& Pilosof, S
Farage, C., Edler, D., Ekl¨ of, A., Rosvall, M. & Pilosof, S. Identifying flow modules in ecological networks using Infomap.Methods Ecol. Evol.12,778–786 (2021)
2021
-
[17]
Rep.544,1–122 (2014)
Boccaletti, Set al.The structure and dynamics of multilayer networks.Phys. Rep.544,1–122 (2014)
2014
-
[18]
De Domenico, M.et al.Mathematical formulation of multilayer networks.Phys. Rev. X3,041022 (2013). 7
2013
discussion (0)
Sign in with ORCID, Apple, or X to comment. Anyone can read and Pith papers without signing in.