Recognition: no theorem link
The Geometric Wall: Manifold Structure Predicts Layerwise Sparse Autoencoder Scaling Laws
Pith reviewed 2026-05-12 04:44 UTC · model grok-4.3
The pith
Manifold geometry of activations sets the per-layer width scaling of sparse autoencoders.
A machine-rendered reading of the paper's core claim, the machinery that carries it, and where it could break.
Core claim
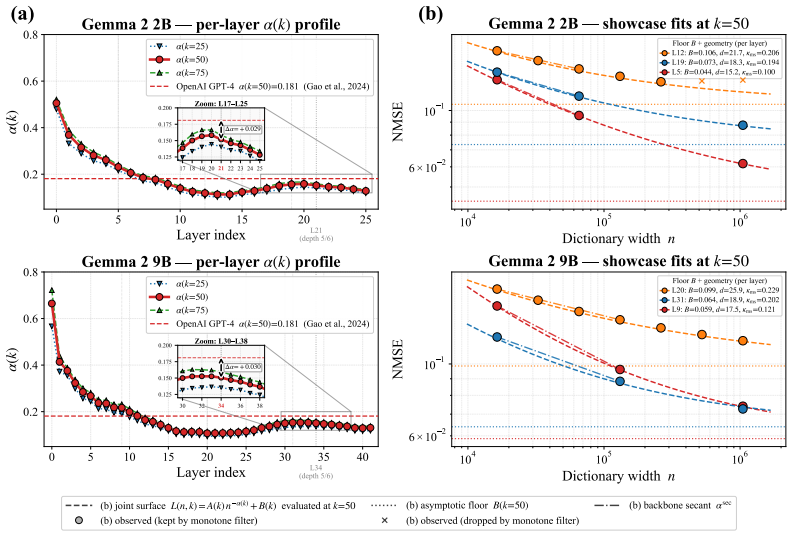
The paper establishes that SAE width-sparsity scaling is a layer-dependent function of manifold structure rather than a universal law. Fitting per-layer scaling-law surfaces on 844 Gemma Scope checkpoints and regressing the derived width exponents on four layerwise geometric summaries yields strong prediction in both models, with coefficients learned on one model transferring to the other. Where richer width grids allow identification of the asymptotic floor, this floor tracks the geometric ordering: higher curvature and intrinsic dimension produce higher floors, matching the second-order residual expected from linear approximations of curved manifolds.
What carries the argument
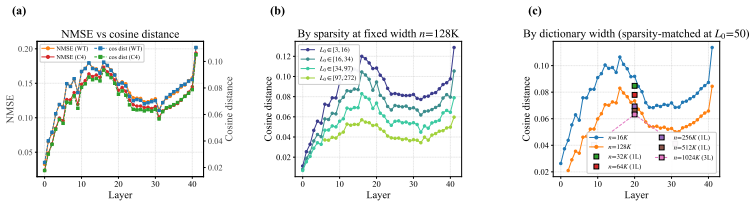
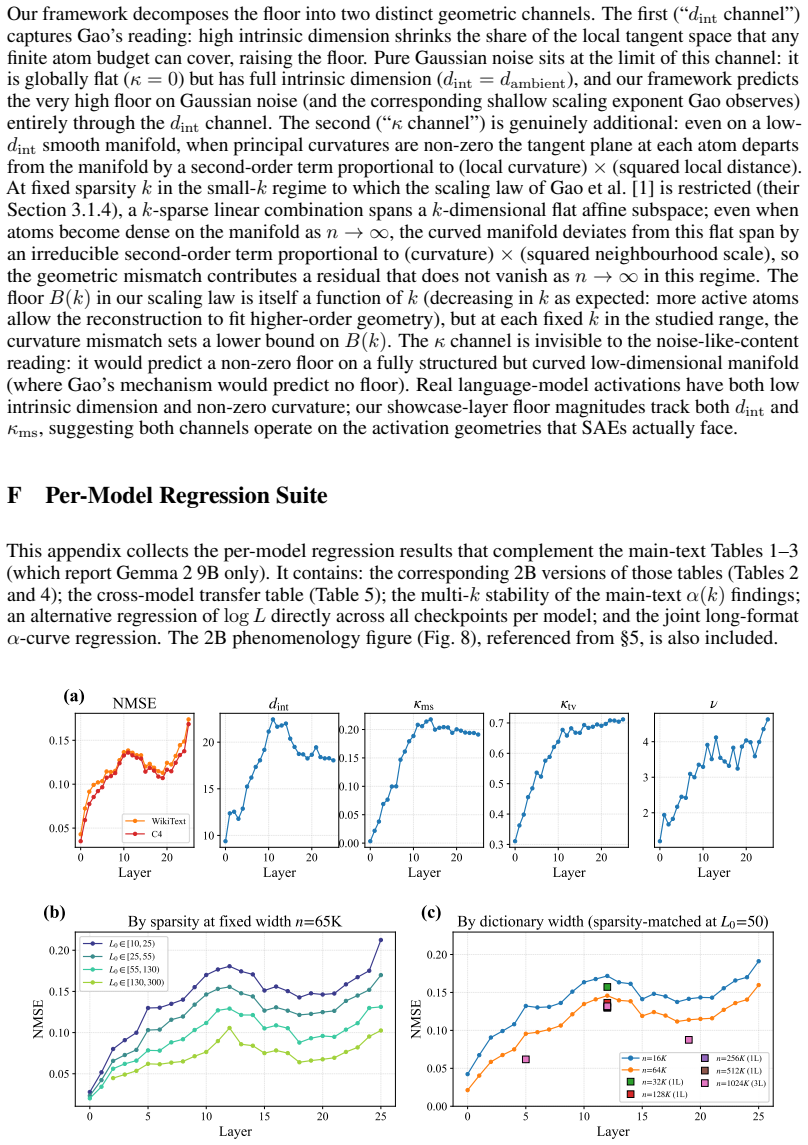
Regression of per-layer SAE scaling-law parameters (width exponent and asymptotic floor) onto four geometric summaries of the activation manifold, chiefly curvature and intrinsic dimension.
If this is right
- Scaling laws for SAEs must be treated as layer-specific rather than universal across a model.
- The asymptotic reconstruction floor rises with layerwise curvature and intrinsic dimension.
- Regression coefficients learned on one model transfer to predict exponents in another model.
- SAEs encounter a geometry-dependent wall set by the manifold they reconstruct, not solely a finite-resource ceiling.
Where Pith is reading between the lines
- If geometry drives the scaling, then interventions that flatten manifolds or reduce curvature could lower the effective width needed for good SAE performance.
- The same geometric predictors may apply to other interpretability methods that assume globally linear structure in activation space.
- Testing the regression on models trained on different data or with different architectures would reveal how general the geometric law is.
- Layer selection for efficient SAE training could be guided by measuring curvature and dimension first.
Load-bearing premise
The four chosen geometric summaries of each layer's activation manifold are the causally relevant properties and are measured independently of the SAE fitting process itself.
What would settle it
Apply the fitted regression coefficients to predict width exponents on a third model or architecture whose measured curvature and intrinsic dimension are known, then check whether the actual fitted SAE scaling exponents deviate systematically from those predictions.
Figures


read the original abstract
Sparse autoencoders (SAEs) operationalise the linear representation hypothesis: they reconstruct model activations as sparse linear combinations of interpretable dictionary atoms, on the implicit assumption that activation space is well approximated by a globally linear structure. Their reconstruction error varies sharply across layers in ways that existing scaling laws, fitted at single layers, do not explain. We argue that this variation is the empirical trace of a geometric mismatch: where the activation manifold is curved and its intrinsic dimension varies across layers, no sparse linear dictionary can match it uniformly, and the SAE's width-sparsity scaling becomes a layer-dependent function of manifold structure rather than a single universal law. We conduct the first cross-layer SAE scaling study, fitting and regressing on 844 residual-stream Gemma Scope SAE checkpoints across 68 layers of Gemma 2 2B and 9B. Stage 1 fits a per-layer scaling-law surface; Stage 2 regresses the fitted parameters and the derived per-layer width exponents on four layerwise geometric summaries. We find that manifold geometry predicts the per-layer width exponent in both models, and that the same regression coefficients learnt on one model predict the other model's per-layer exponents under cross-model transfer, indicating a transferable geometric law. At the showcase layers where richer width grids permit identification of the asymptotic floor, we find that the fitted floor tracks the layerwise geometric ordering: higher curvature and intrinsic dimension correspond to higher floor, consistent with the irreducible second-order residual that any sparse linear approximation of a curved manifold must leave behind. SAEs thus encounter not a finite-resource ceiling but a geometry-dependent wall, set by the manifold they are trying to reconstruct.
Editorial analysis
A structured set of objections, weighed in public.
Referee Report
Summary. The paper claims that activation manifold geometry (via four layerwise summaries: curvature, intrinsic dimension, and two others) predicts per-layer SAE width exponents and asymptotic floors. Using a two-stage procedure on 844 residual-stream SAEs across 68 layers of Gemma 2 2B and 9B, Stage 1 fits per-layer scaling surfaces while Stage 2 regresses the extracted exponents/floors on the geometric summaries. Key results include successful prediction within each model and cross-model transfer of regression coefficients, plus correlation of the asymptotic floor with geometric ordering at showcase layers, framing SAE limits as a 'geometric wall' rather than a universal scaling law.
Significance. If the geometric summaries are shown to be independent of the SAE fitting process, the work would meaningfully advance understanding of why SAE reconstruction error varies across layers by tying it to intrinsic manifold properties. The cross-model transfer result is a clear strength, supporting generality beyond single-model correlations. This could inform SAE architecture choices and layer selection for interpretability work, moving the field from purely empirical scaling laws toward geometry-aware predictions.
major comments (3)
- [Abstract] Abstract and Stage 2 description: The geometric summaries are computed from the identical residual-stream activations used to train and evaluate the 844 SAEs. This creates a circularity risk in the regression, as both the width exponents (fitted quantities) and the predictors derive from the same activation statistics; the cross-model transfer provides partial mitigation but does not address whether the summaries are independent of SAE loss or activation norm/sparsity confounders.
- [Stage 2] Stage 2 regression: No details are supplied on how the four geometric summaries are estimated (e.g., estimators used, held-out data, random seeds), error-bar propagation from Stage 1 fits into the regression, or controls for multiple comparisons across 68 layers and two models. These omissions make it impossible to assess whether the reported predictive power is robust or overfit.
- [Showcase layers] Showcase layers analysis: The claim that the fitted asymptotic floor 'tracks the layerwise geometric ordering' (higher curvature/intrinsic dimension yields higher floor) is presented qualitatively. Without reported R² values, p-values, or controls for other layerwise covariates, it is unclear whether this supports the irreducible second-order residual interpretation or could arise from other activation properties.
minor comments (2)
- [Introduction] The introduction of the term 'geometric wall' is evocative but would benefit from a precise mathematical definition distinguishing it from standard scaling-law ceilings.
- [Figures] Figures showing per-layer exponent vs. geometric summary regressions should include confidence intervals derived from the Stage 1 surface fits to allow visual assessment of uncertainty.
Simulated Author's Rebuttal
We thank the referee for their constructive review and for highlighting areas where additional rigor and clarity would strengthen the work. We respond to each major comment below. Revisions have been made to expand methodological details, add statistical controls and quantifications, and address potential confounders, while preserving the core claim that manifold geometry provides a transferable predictor of layerwise SAE scaling behavior.
read point-by-point responses
-
Referee: [Abstract] Abstract and Stage 2 description: The geometric summaries are computed from the identical residual-stream activations used to train and evaluate the 844 SAEs. This creates a circularity risk in the regression, as both the width exponents (fitted quantities) and the predictors derive from the same activation statistics; the cross-model transfer provides partial mitigation but does not address whether the summaries are independent of SAE loss or activation norm/sparsity confounders.
Authors: The geometric summaries are computed directly from the raw activation vectors prior to any SAE training and do not depend on the SAE loss, dictionary atoms, or reconstruction error; they are intrinsic manifold descriptors (curvature via local tangent-space approximations and intrinsic dimension via maximum-likelihood estimators). The width exponents, by contrast, are derived from the scaling of SAE reconstruction error across widths. While both quantities are obtained from the same activation dataset, this is intentional: the geometry is the property the SAEs attempt to approximate. To address possible confounding by activation norm or sparsity, the revised manuscript includes partial-correlation controls for these quantities in Stage 2; the reported predictive power and cross-model transfer coefficients remain stable under these controls. We have updated the abstract and Stage 2 description to make this independence explicit. revision: partial
-
Referee: [Stage 2] Stage 2 regression: No details are supplied on how the four geometric summaries are estimated (e.g., estimators used, held-out data, random seeds), error-bar propagation from Stage 1 fits into the regression, or controls for multiple comparisons across 68 layers and two models. These omissions make it impossible to assess whether the reported predictive power is robust or overfit.
Authors: We agree that these details are essential for reproducibility and robustness assessment. The revised Methods section now specifies: (i) the exact estimators (local PCA for curvature, MLE for intrinsic dimension, plus the two additional summaries), (ii) use of held-out activation batches for summary computation, (iii) fixed random seeds for all sampling and fitting steps, and (iv) Bonferroni correction for the 68-layer × 2-model comparisons. Regarding error propagation, Stage 1 fits exhibit low variance given the dense width grids; we have added a sensitivity analysis showing that plausible perturbations of the Stage 1 exponents do not alter the significance or direction of the Stage 2 coefficients. These additions allow readers to evaluate whether the predictive power is overfit. revision: yes
-
Referee: [Showcase layers] Showcase layers analysis: The claim that the fitted asymptotic floor 'tracks the layerwise geometric ordering' (higher curvature/intrinsic dimension yields higher floor) is presented qualitatively. Without reported R² values, p-values, or controls for other layerwise covariates, it is unclear whether this supports the irreducible second-order residual interpretation or could arise from other activation properties.
Authors: We accept that the original presentation was qualitative. The revised showcase-layers section now reports Pearson R² and associated p-values for the relationship between each geometric summary and the fitted asymptotic floor. In addition, we include partial-correlation analyses that control for layerwise activation norm and mean sparsity. These quantitative results remain consistent with the geometric-wall interpretation: the floor correlates with curvature and intrinsic dimension even after covariate adjustment, supporting the view that the residual is irreducible for any sparse linear dictionary on a curved manifold. revision: yes
Circularity Check
No significant circularity; empirical two-stage regression on distinct computations
full rationale
The derivation consists of Stage 1 (fitting per-layer scaling surfaces to SAE reconstruction metrics across widths) followed by Stage 2 (regressing the resulting exponents and floors on separately computed geometric summaries of the activation manifold). These are distinct operations: the scaling-law parameters are derived from SAE training outcomes, while curvature and intrinsic dimension are manifold estimators applied to the same activations but not defined in terms of the SAE fits or exponents. The cross-model transfer test further separates the regression coefficients from any single model's data. No equation reduces to its input by construction, no self-citation chain bears the central claim, and no ansatz or uniqueness theorem is smuggled in. The result is an observed correlation, not a definitional equivalence.
Axiom & Free-Parameter Ledger
free parameters (2)
- per-layer width exponent
- asymptotic floor
axioms (1)
- domain assumption Activation manifolds possess measurable curvature and intrinsic dimension that determine the quality of any sparse linear approximation.
invented entities (1)
-
geometric wall
no independent evidence
Reference graph
Works this paper leans on
-
[1]
Scaling and evaluating sparse autoencoders
Leo Gao, Tom Dupré la Tour, Henk Tillman, Gabriel Goh, Rajan Troll, Alec Radford, Ilya Sutskever, Jan Leike, and Jeffrey Wu. Scaling and evaluating sparse autoencoders. InInterna- tional Conference on Learning Representations (ICLR), 2025. Oral
work page 2025
-
[2]
The linear representation hypothesis and the geometry of large language models
Kiho Park, Yo Joong Choe, and Victor Veitch. The linear representation hypothesis and the geometry of large language models. InInternational Conference on Machine Learning (ICML), 2024
work page 2024
-
[3]
Toy models of superposition.Transformer Circuits Thread, 2022
Nelson Elhage, Tristan Hume, Catherine Olsson, Nicholas Schiefer, Tom Henighan, Shauna Kravec, Zac Hatfield-Dodds, Robert Lasenby, Dawn Drain, Carol Chen, Roger Grosse, Sam McCandlish, Jared Kaplan, Dario Amodei, Martin Wattenberg, and Christopher Olah. Toy models of superposition.Transformer Circuits Thread, 2022. URL https: //transformer-circuits.pub/20...
work page 2022
-
[4]
Sparse autoencoders find highly interpretable features in language models
Hoagy Cunningham, Aidan Ewart, Logan Riggs, Robert Huben, and Lee Sharkey. Sparse autoencoders find highly interpretable features in language models. InInternational Conference on Learning Representations (ICLR), 2024
work page 2024
-
[5]
Trenton Bricken, Adly Templeton, Joshua Batson, Brian Chen, Adam Jermyn, Tom Conerly, Nicholas L. Turner, Cem Anil, Carson Denison, Amanda Askell, Robert Lasenby, Yifan Wu, Shauna Kravec, Nicholas Schiefer, Tim Maxwell, Nicholas Joseph, Alex Tamkin, Karina Nguyen, Brayden McLean, Josiah E. Burke, Tristan Hume, Shan Carter, Tom Henighan, and Chris Olah. To...
work page 2023
-
[6]
Adly Templeton, Tom Conerly, Jonathan Marcus, Jack Lindsey, Trenton Bricken, Brian Chen, Adam Pearce, Craig Citro, Emmanuel Ameisen, Andy Jones, Hoagy Cunningham, Nicholas L. Turner, Callum McDougall, Monte MacDiarmid, Alex Tamkin, Esin Durmus, Tristan Hume, Francesco Mosconi, C. Daniel Freeman, Theodore R. Sumers, Edward Rees, Joshua Batson, Adam Jermyn,...
work page 2024
-
[7]
Gemma Scope: Open Sparse Autoencoders Everywhere All At Once on Gemma 2
Tom Lieberum, Senthooran Rajamanoharan, Arthur Conmy, Lewis Smith, Nicolas Sonnerat, Vikrant Varma, János Kramár, Anca Dragan, Rohin Shah, and Neel Nanda. Gemma scope: Open sparse autoencoders everywhere all at once on Gemma 2. InProceedings of the 7th BlackboxNLP Workshop: Analyzing and Interpreting Neural Networks for NLP, pages 278– 300, Miami, Florida...
-
[8]
Michaud, Isaac Liao, Wes Gurnee, and Max Tegmark
Joshua Engels, Eric J. Michaud, Isaac Liao, Wes Gurnee, and Max Tegmark. Not all lan- guage model features are one-dimensionally linear. InInternational Conference on Learning Representations (ICLR), 2025
work page 2025
-
[9]
Yuxiao Li, Eric J. Michaud, David D. Baek, Joshua Engels, Xiaoqing Sun, and Max Tegmark. The geometry of concepts: Sparse autoencoder feature structure.Entropy, 27(4):344, 2025. arXiv:2410.19750, 2024
-
[10]
The geometry of categorical and hierarchical concepts in large language models
Kiho Park, Yo Joong Choe, Yibo Jiang, and Victor Veitch. The geometry of categorical and hierarchical concepts in large language models. InInternational Conference on Learning Representations (ICLR), 2025. 10
work page 2025
-
[11]
Chris Olah and Adam Jermyn. What is a linear representation? what is a multidimen- sional feature? Transformer Circuits Thread, July 2024 update, 2024. URL https: //transformer-circuits.pub/2024/july-update/index.html
work page 2024
-
[12]
Michaud, Liv Gorton, and Tom McGrath
Eric J. Michaud, Liv Gorton, and Tom McGrath. Understanding sparse autoencoder scaling in the presence of feature manifolds, 2025
work page 2025
-
[13]
The origins of representation manifolds in large language models, 2025
Alexander Modell, Patrick Rubin-Delanchy, and Nick Whiteley. The origins of representation manifolds in large language models, 2025
work page 2025
-
[14]
When models manipulate manifolds: The geometry of a counting task
Wes Gurnee, Emmanuel Ameisen, Isaac Kauvar, Julius Tarng, Adam Pearce, Chris Olah, and Joshua Batson. When models manipulate manifolds: The geometry of a counting task. Transformer Circuits Thread, 2026
work page 2026
-
[15]
Decomposing the dark matter of sparse autoencoders.Transactions on Machine Learning Research, 2025
Joshua Engels, Logan Riggs, and Max Tegmark. Decomposing the dark matter of sparse autoencoders.Transactions on Machine Learning Research, 2025. arXiv:2410.14670
-
[16]
SAE reconstruction errors are (empirically) pathological
Wes Gurnee. SAE reconstruction errors are (empirically) pathological. AI Align- ment Forum, 2024. URL https://www.lesswrong.com/posts/rZPiuFxESMxCDHe4B/ sae-reconstruction-errors-are-empirically-pathological
work page 2024
-
[17]
Alessio Ansuini, Alessandro Laio, Jakob H. Macke, and Davide Zoccolan. Intrinsic dimension of data representations in deep neural networks. InAdvances in Neural Information Processing Systems (NeurIPS), volume 32, 2019
work page 2019
-
[18]
The geometry of hidden representations of large transformer models
Lucrezia Valeriani, Diego Doimo, Francesca Cuturello, Alessandro Laio, Alessio Ansuini, and Alberto Cazzaniga. The geometry of hidden representations of large transformer models. In Advances in Neural Information Processing Systems (NeurIPS), volume 36, 2023
work page 2023
-
[19]
Mohamed A. Mabrok. Latent semantic manifolds in large language models, 2026
work page 2026
-
[20]
The information geometry of softmax: Probing and steering, 2026
Kiho Park, Todd Nief, Yo Joong Choe, and Victor Veitch. The information geometry of softmax: Probing and steering, 2026
work page 2026
-
[21]
Jumping ahead: Improving reconstruction fidelity with JumpReLU sparse autoencoders, 2024
Senthooran Rajamanoharan, Tom Lieberum, Nicolas Sonnerat, Arthur Conmy, Vikrant Varma, János Kramár, and Neel Nanda. Jumping ahead: Improving reconstruction fidelity with JumpReLU sparse autoencoders, 2024
work page 2024
-
[22]
Shun-ichi Amari.Information Geometry and Its Applications, volume 194 ofApplied Mathe- matical Sciences. Springer, Tokyo, 2016
work page 2016
-
[23]
N. N. Cencov.Statistical Decision Rules and Optimal Inference, volume 53 ofTranslations of Mathematical Monographs. American Mathematical Society, Providence, RI, 1982
work page 1982
-
[24]
A. Bhattacharyya. On a measure of divergence between two statistical populations defined by their probability distributions.Bulletin of the Calcutta Mathematical Society, 35:99–109, 1943
work page 1943
-
[25]
Elena Facco, Maria d’Errico, Alex Rodriguez, and Alessandro Laio. Estimating the intrinsic dimension of datasets by a minimal neighborhood information.Scientific Reports, 7:12140, 2017
work page 2017
-
[26]
Gemma 2: Improving open language models at a practical size, 2024
Gemma Team. Gemma 2: Improving open language models at a practical size, 2024
work page 2024
-
[27]
Colin Raffel, Noam Shazeer, Adam Roberts, Katherine Lee, Sharan Narang, Michael Matena, Yanqi Zhou, Wei Li, and Peter J. Liu. Exploring the limits of transfer learning with a unified text-to-text transformer.Journal of Machine Learning Research, 21(140):1–67, 2020
work page 2020
-
[28]
Pointer sentinel mixture models
Stephen Merity, Caiming Xiong, James Bradbury, and Richard Socher. Pointer sentinel mixture models. InInternational Conference on Learning Representations (ICLR), 2017
work page 2017
-
[29]
F. N. Fritsch and R. E. Carlson. Monotone piecewise cubic interpolation.SIAM Journal on Numerical Analysis, 17(2):238–246, 1980
work page 1980
-
[30]
D. M. Allen. The relationship between variable selection and data augmentation and a method for prediction.Technometrics, 16(1):125–127, 1974. 11
work page 1974
-
[31]
M. Stone. Cross-validatory choice and assessment of statistical predictions.Journal of the Royal Statistical Society. Series B (Methodological), 36(2):111–133, 1974
work page 1974
-
[32]
J. A. Nelder and R. Mead. A simplex method for function minimization.The Computer Journal, 7(4):308–313, 1965
work page 1965
-
[33]
Lee.Introduction to Riemannian Manifolds, volume 176 ofGraduate Texts in Mathe- matics
John M. Lee.Introduction to Riemannian Manifolds, volume 176 ofGraduate Texts in Mathe- matics. Springer, Cham, 2nd edition, 2018
work page 2018
-
[34]
Manfredo P. do Carmo.Riemannian Geometry. Birkhäuser, Boston, MA, 1992
work page 1992
-
[35]
Nihat Ay, Jürgen Jost, Hông Vân Lê, and Lorenz Schwachhöfer.Information Geometry, volume 64 ofErgebnisse der Mathematik und ihrer Grenzgebiete. Springer, Cham, 2017
work page 2017
-
[36]
Little, Mauro Maggioni, and Lorenzo Rosasco
Anna V . Little, Mauro Maggioni, and Lorenzo Rosasco. Multiscale geometric methods for data sets I: Multiscale SVD, noise and curvature.Applied and Computational Harmonic Analysis, 43(3):504–567, 2017
work page 2017
-
[37]
Alan Edelman, Tomás A. Arias, and Steven T. Smith. The geometry of algorithms with orthogonality constraints.SIAM Journal on Matrix Analysis and Applications, 20(2):303–353,
-
[38]
doi: 10.1137/S0895479895290954
- [39]
-
[40]
The Annals of Mathe- matical Statistics22(1), 79–86 (1951) https://doi.org/10.1214/aoms/1177729694
doi: 10.1214/aoms/1177729893. A Differential-Geometric Foundations This appendix provides the full differential-geometric development summarised in Section 2.4. Standard references are Lee [33], do Carmo [34] for Riemannian geometry and Amari [22], Ay et al
-
[41]
the activations are made of a spectrum of components with different amount of structure
for information geometry. Smooth manifolds.Asmooth manifold M of dimension m is a space that locally resembles Rm: it is covered by coordinate charts (Uα, φα), each mapping an open patch of M smoothly onto a region of Rm, with smooth (C ∞) transition functions on overlaps. At each point q∈ M , thetangent space TqM collects all velocity vectors of smooth c...
work page 2000
discussion (0)
Sign in with ORCID, Apple, or X to comment. Anyone can read and Pith papers without signing in.