Recognition: 2 theorem links
· Lean TheoremScaling Vision Models Does Not Consistently Improve Localisation-Based Explanation Quality
Pith reviewed 2026-05-12 04:11 UTC · model grok-4.3
The pith
Scaling up vision models does not consistently improve the quality of their post-hoc explanations.
A machine-rendered reading of the paper's core claim, the machinery that carries it, and where it could break.
Core claim
Across datasets and methods, increasing architectural depth and parameter count does not improve explanation quality in most statistical comparisons, and smaller models often match or exceed deeper variants. Pretraining typically improves predictive performance and increases dependence on learned weights, yet does not consistently increase localisation scores. Models can reach strong predictive performance while localisation precision remains near zero.
What carries the argument
The localisation metrics Relevance Rank Accuracy and Dual-Polarity Precision, which measure how well positive attributions fall inside class masks and negative attributions fall outside them.
If this is right
- Model selection for safety-sensitive uses cannot rely on scale alone and must include explicit checks of explanation quality.
- High predictive accuracy does not ensure that a model bases its decisions on the annotated object regions.
- Pretraining benefits for explanations are separate from its benefits for accuracy and must be verified independently.
- Smaller models remain competitive options when explanation alignment is a priority.
- Explainability should be assessed as a distinct criterion during deployment decisions.
Where Pith is reading between the lines
- Scaling trends observed for accuracy may not apply to interpretability, so future scaling studies should track explanation metrics separately.
- Current post-hoc methods may require adaptation to maintain effectiveness as model complexity grows.
- The results motivate targeted comparisons of architectural choices other than size on explanation behaviour.
- Similar patterns could appear in non-vision domains where scale is assumed to improve trustworthiness.
Load-bearing premise
Alignment with ground-truth segmentation masks, as measured by the two localisation metrics, provides a valid general indicator of explanation quality for downstream safety or human understanding.
What would settle it
A new experiment on additional datasets or with further explanation methods in which larger models produce statistically higher scores on both Relevance Rank Accuracy and Dual-Polarity Precision would falsify the central claim.
Figures


read the original abstract
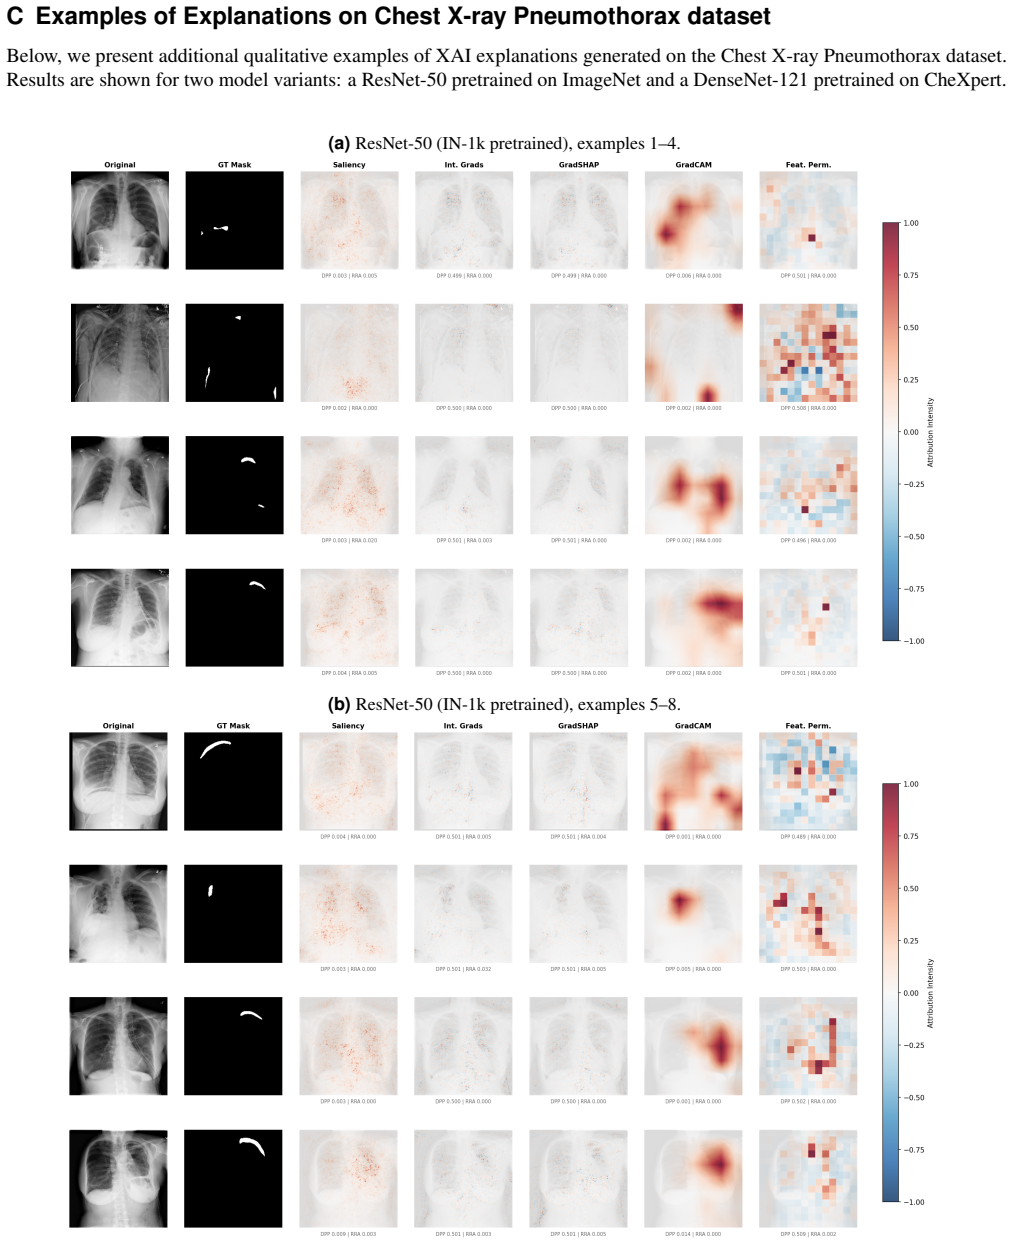
Artificial intelligence models are increasingly scaled to improve predictive accuracy, yet it remains unclear whether scale improves the quality of post-hoc explanations. We investigate this relationship by evaluating 11 computer vision models representing increasing levels of depth and complexity within the ResNet, DenseNet, and Vision Transformer families, trained from scratch or pretrained, across three image datasets with ground-truth segmentation masks. For each model, we generate explanations using five post-hoc explainable AI methods and quantify mask alignment using two localisation metrics: Relevance Rank Accuracy (Arras et al., 2022) and the proposed Dual-Polarity Precision, which measures positive attributions inside the class mask and negative attributions outside it. Across datasets and methods, increasing architectural depth and parameter count does not improve explanation quality in most statistical comparisons, and smaller models often match or exceed deeper variants. While pretraining typically improves predictive performance and increases the dependence of explanations on learned weights, it does not consistently increase localisation scores. We also observe scenarios in which models achieve strong predictive performance while localisation precision is near zero, suggesting that performance metrics alone may not indicate whether predictions are based on the annotated regions. These results indicate that larger models do not reliably provide higher-quality explanations, and that explainability should therefore be assessed explicitly during model selection for safety-sensitive deployments.
Editorial analysis
A structured set of objections, weighed in public.
Referee Report
Summary. The paper conducts a comprehensive empirical evaluation of 11 vision models from ResNet, DenseNet, and Vision Transformer families with varying depths and parameter counts on three datasets equipped with ground-truth segmentation masks. Using five post-hoc XAI methods, it measures explanation quality via Relevance Rank Accuracy and the newly proposed Dual-Polarity Precision metric, which assesses positive attributions within the mask and negative attributions outside it. The main conclusion is that increasing model scale does not consistently enhance localisation-based explanation quality, with smaller models frequently performing on par or better, and pretraining improving predictive accuracy but not reliably boosting localisation scores. The study also identifies instances where high predictive performance is accompanied by near-zero localisation, underscoring the need for explicit explainability assessment.
Significance. If these findings hold, they challenge the prevailing assumption in the field that larger, more accurate models inherently produce better explanations. This has significant implications for the deployment of AI in safety-critical domains, where both performance and interpretability are crucial. The broad scope across architectures, datasets, and methods strengthens the generalizability of the results. The introduction of Dual-Polarity Precision provides a new tool for the community. The paper's own acknowledgment of the disconnect between performance and localisation adds nuance and prevents overinterpretation. The stress-test concern about mask validity does not land as a reason to doubt the central claim, because the work is explicitly framed around localisation-based metrics and already flags the performance-localisation disconnect.
major comments (3)
- The claim that scaling does not improve explanation quality 'in most statistical comparisons' is load-bearing for the title and abstract conclusions. The specific tests (e.g., paired t-tests or Wilcoxon), effect sizes, and any multiple-comparison corrections applied across the 11 models × 5 methods × 3 datasets × 2 metrics grid should be reported explicitly with raw distributions or supplementary tables to allow assessment of robustness.
- Dual-Polarity Precision is introduced as a contribution that captures both polarities of attribution. Its exact formula, normalization, and handling of zero-attribution cases (likely in the methods) must be given as an equation, together with a direct comparison or correlation analysis against Relevance Rank Accuracy on the same explanations to demonstrate incremental value.
- The observation of strong predictive performance with near-zero localisation is highlighted in the abstract. A quantitative breakdown by dataset and model family (e.g., percentage of cases or average localisation scores for top-accuracy models) would strengthen the interpretation that performance metrics alone are insufficient.
minor comments (3)
- Figure captions should explicitly state the number of runs or seeds used and whether error bars represent standard deviation or standard error to improve clarity of the scaling trends.
- The reference list should confirm that Arras et al. (2022) and all five XAI method citations are complete and consistently formatted.
- A short paragraph in the discussion on potential dataset-specific biases in the segmentation masks (e.g., annotation quality or class-specific challenges) would aid readers in generalizing the results.
Simulated Author's Rebuttal
We thank the referee for the positive assessment of our work and the constructive suggestions for improvement. We address each major comment below with clarifications and revisions.
read point-by-point responses
-
Referee: The claim that scaling does not improve explanation quality 'in most statistical comparisons' is load-bearing for the title and abstract conclusions. The specific tests (e.g., paired t-tests or Wilcoxon), effect sizes, and any multiple-comparison corrections applied across the 11 models × 5 methods × 3 datasets × 2 metrics grid should be reported explicitly with raw distributions or supplementary tables to allow assessment of robustness.
Authors: We agree that greater transparency on the statistical procedures is warranted. The manuscript already employs Wilcoxon signed-rank tests (chosen for non-normality of localisation scores) with Bonferroni correction across the full grid of comparisons, and reports effect sizes via rank-biserial correlation. To strengthen the claim, the revised version will add an explicit methods subsection detailing these choices and will include supplementary tables with all raw p-values, effect sizes, and per-comparison score distributions. revision: yes
-
Referee: Dual-Polarity Precision is introduced as a contribution that captures both polarities of attribution. Its exact formula, normalization, and handling of zero-attribution cases (likely in the methods) must be given as an equation, together with a direct comparison or correlation analysis against Relevance Rank Accuracy on the same explanations to demonstrate incremental value.
Authors: We accept this request for formalization. The revised manuscript will present the Dual-Polarity Precision formula as an explicit equation in the methods, including the normalization (division by total attribution mass) and the convention for zero-attribution cases (score set to 0.5 when both polarities are absent). We will also add a supplementary correlation analysis (Pearson r and agreement rates) between Dual-Polarity Precision and Relevance Rank Accuracy across all generated explanations to quantify its added value. revision: yes
-
Referee: The observation of strong predictive performance with near-zero localisation is highlighted in the abstract. A quantitative breakdown by dataset and model family (e.g., percentage of cases or average localisation scores for top-accuracy models) would strengthen the interpretation that performance metrics alone are insufficient.
Authors: We will incorporate this quantitative support. The revised results section will include a new table (or supplementary table) reporting, for each dataset and model family, (i) the percentage of top-quartile accuracy models that exhibit near-zero localisation (<0.1) and (ii) the mean localisation scores for the highest-accuracy models. This will provide concrete numbers backing the abstract statement. revision: yes
Circularity Check
No circularity: purely empirical evaluation with direct measurements
full rationale
This paper performs an empirical comparison of explanation quality across model scales using two localisation metrics (one cited, one newly proposed) applied to generated attributions on datasets with segmentation masks. No mathematical derivations, parameter fits, or predictions are claimed; results consist of statistical comparisons of measured scores. No self-citations are load-bearing for any central claim, and the analysis does not reduce any quantity to a definition or fit by construction. The study is self-contained against external benchmarks.
Axiom & Free-Parameter Ledger
axioms (1)
- domain assumption Localisation to ground-truth segmentation masks is a meaningful proxy for explanation quality
invented entities (1)
-
Dual-Polarity Precision
no independent evidence
Reference graph
Works this paper leans on
-
[1]
Arras, L., Osman, A. & Samek, W. Ground Truth Evaluation of Neural Network Explanations with CLEVR-XAI.Inf. Fusion81, 14–40, DOI: 10.1016/j.inffus.2021.11.008 (2022). ArXiv:2003.07258 [cs, eess]
-
[2]
Morch, N. J. S.et al.Visualization of neural networks using saliency maps. InProceedings of ICNN’95 - International Conference on Neural Networks, vol. 4, 2085–2090, DOI: 10.1109/ICNN.1995.488997 (IEEE, Perth, W A, Australia, 1995)
-
[3]
Baehrens, D., Schroeter, T., Harmeling, S., Kawanabe, M. & Hansen, K. How to explain individual classification decisions (2010). ArXiv preprint
work page 2010
-
[4]
Deep Inside Convolutional Networks: Visualising Image Classification Models and Saliency Maps
Simonyanet al.Deep Inside Convolutional Networks: Visualising Image Classification Models and Saliency Maps (2013). ArXiv:1312.6034 [cs]. 5.Lundberg, S. & Lee, S.-I. A Unified Approach to Interpreting Model Predictions (2017). ArXiv:1705.07874 [cs, stat]
work page internal anchor Pith review Pith/arXiv arXiv 2013
- [5]
-
[6]
PMID: 41047921, https://doi.org/10.1080/07853890.2025.2568119
Dobrzycka, M.et al.Machine learning-based identification of small rna signatures in aqueous humor as a step toward precision diagnosis of glaucoma.Annals Medicine57, 2568119, DOI: 10.1080/07853890.2025.2568119 (2025). PMID: 41047921, https://doi.org/10.1080/07853890.2025.2568119
-
[7]
Surv.51, 1–42, DOI: 10.1145/3236009 (2019)
Guidotti, R.et al.A Survey of Methods for Explaining Black Box Models.ACM Comput. Surv.51, 1–42, DOI: 10.1145/3236009 (2019)
-
[8]
``why should i trust you?": Explaining the predictions of any classifier
Ribeiro, M. T., Singh, S. & Guestrin, C. "Why Should I Trust You?": Explaining the Predictions of Any Classifier (2016). ArXiv:1602.04938 [cs, stat]
-
[9]
Apley, D. W. & Zhu, J. Visualizing the Effects of Predictor Variables in Black Box Supervised Learning Models.J. Royal Stat. Soc. Ser. B: Stat. Methodol.82, 1059–1086, DOI: 10.1111/rssb.12377 (2020)
-
[10]
An Image is Worth 16x16 Words: Transformers for Image Recognition at Scale
Dosovitskiy, A. An image is worth 16x16 words: Transformers for image recognition at scale.arXiv preprint arXiv:2010.11929(2020)
work page internal anchor Pith review Pith/arXiv arXiv 2010
-
[11]
Hedström, A.et al.Quantus: An explainable ai toolkit for responsible evaluation of neural network explanations and beyond.J. Mach. Learn. Res.24, 1–11 (2023). 18/28
work page 2023
-
[12]
Samek, W., Montavon, G., Vedaldi, A., Hansen, L. K. & Müller, K.-R. (eds.)Explainable AI: Interpreting, Explaining and Visualizing Deep Learning, vol. 11700 ofLecture Notes in Computer Science(Springer International Publishing, Cham, 2019)
work page 2019
-
[13]
Molnar, C., Casalicchio, G. & Bischl, B. Interpretable machine learning – a brief history, state-of-the-art and challenges. vol. 1323, 417–431, DOI: 10.1007/978-3-030-65965-3_28 (2020). ArXiv:2010.09337 [cs, stat]
-
[14]
Sanity checks for saliency maps, 2020
Cedro, M. & Martens, D. GraphXAIN: Narratives to Explain Graph Neural Networks. In Guidotti, R., Schmid, U. & Longo, L. (eds.)Explainable Artificial Intelligence, 91–114 (Springer Nature Switzerland, Cham, 2026). 17.Miller, T. Explanation in artificial intelligence: Insights from the social sciences.Artif. intelligence267, 1–38 (2019). 18.Adebayo, J.et al...
-
[15]
Shrikumar, A., Greenside, P. & Kundaje, A. Learning Important Features Through Propagating Activation Differences (2019). ArXiv:1704.02685 [cs]
-
[16]
PLOS ONE10(7), e0130140 (Jul 2015).https://doi.org/ 10.1371/journal.pone.0130140
Bach, S.et al.On Pixel-Wise Explanations for Non-Linear Classifier Decisions by Layer-Wise Relevance Propagation. PLOS ONE10, e0130140, DOI: 10.1371/journal.pone.0130140 (2015). 22.Shapley, L. S.Contributions to the Theory of Games(1953). “A value for n-person games”, pp. 307–317
-
[17]
SmoothGrad: removing noise by adding noise
Smilkov, D., Thorat, N., Kim, B., Viégas, F. & Wattenberg, M. SmoothGrad: removing noise by adding noise (2017). ArXiv:1706.03825 [cs, stat]
work page Pith review arXiv 2017
-
[18]
Bykov, K., Hedström, A., Nakajima, S. & Höhne, M. M.-C. NoiseGrad: Enhancing Explanations by Introducing Stochasticity to Model Weights (2022). ArXiv:2106.10185 [cs]
-
[19]
R.et al.Grad-cam: Visual explanations from deep networks via gradient-based localization
Selvaraju, R. R.et al.Grad-cam: Visual explanations from deep networks via gradient-based localization. InProceedings of the IEEE international conference on computer vision, 618–626 (2017)
work page 2017
-
[20]
Hooker, S., Erhan, D., Kindermans, P.-J. & Kim, B. A Benchmark for Interpretability Methods in Deep Neural Networks (2019). ArXiv:1806.10758 [cs, stat]. 27.LeCun, Y ., Bengio, Y . & Hinton, G. Deep learning.Nature521, 436–444, DOI: 10.1038/nature14539 (2015)
-
[21]
WIREs Data Mining and Knowledge Discovery , volume =
Holzinger, A., Langs, G., Denk, H., Zatloukal, K. & Müller, H. Causability and explainability of artificial intelligence in medicine.WIREs Data Min. Knowl. Discov.9, e1312, DOI: 10.1002/widm.1312 (2019). 29.Cabitza, F., Rasoini, R. & Gensini, G. F. Unintended Consequences of Machine Learning in Medicine (2017)
-
[22]
Rajkomar, A., Dean, J. & Kohane, I. Machine Learning in Medicine.New Engl. J. Medicine380, 1347–1358, DOI: 10.1056/NEJMra1814259 (2019). 31.Katuwal, G. J. & Chen, R. Machine Learning Model Interpretability for Precision Medicine (2016). 32.Che, Z., Purushotham, S., Khemani, R. & Liu, Y . Interpretable Deep Models for ICU Outcome Prediction (2017)
-
[23]
Hinton, G. Deep Learning—A Technology With the Potential to Transform Health Care.JAMA320, 1101, DOI: 10.1001/jama.2018.11100 (2018)
-
[24]
Wu, Z., Shen, C. & Hengel, A. v. d. Wider or Deeper: Revisiting the ResNet Model for Visual Recognition (2016). ArXiv:1611.10080 [cs]. 35.Zhao, H.et al.Understanding scene in the wild (2016). 36.Brown, T. B.et al.Language models are few-shot learners.CoRRabs/2005.14165(2020). 2005.14165
-
[25]
Menghani, G. Efficient Deep Learning: A Survey on Making Deep Learning Models Smaller, Faster, and Better.ACM Comput. Surv.55, 1–37, DOI: 10.1145/3578938 (2023). 38.Davenport, T. & Kalakota, R. The potential for artificial intelligence in healthcare (2019)
-
[26]
Secinaro, S., Calandra, D., Secinaro, A., Muthurangu, V . & Biancone, P. The role of artificial intelligence in healthcare: a structured literature review.BMC Med. Informatics Decis. Mak.21, 125, DOI: 10.1186/s12911-021-01488-9 (2021). 40.Chowdhury, M. E. H.et al.Can AI help in screening viral and COVID-19 Pneumonia?IEEE Access8, 132665–132676, DOI: 10.11...
-
[27]
Degerli, A.et al.COVID-19 infection map generation and detection from chest X-ray images.Heal. Inf. Sci. Syst.9, 15, DOI: 10.1007/s13755-021-00146-8 (2021). 19/28
-
[28]
Rahman, T.et al.Exploring the effect of image enhancement techniques on COVID-19 detection using chest X-ray images. Comput. Biol. Medicine132, 104319, DOI: 10.1016/j.compbiomed.2021.104319 (2021). 43.He, K., Zhang, X., Ren, S. & Sun, J. Deep Residual Learning for Image Recognition (2015). ArXiv:1512.03385 [cs]
-
[29]
Showkat, S. & Qureshi, S. Efficacy of Transfer Learning-based ResNet models in Chest X-ray image classification for detecting COVID-19 Pneumonia.Chemom. Intell. Lab. Syst.224, 104534, DOI: 10.1016/j.chemolab.2022.104534 (2022)
-
[30]
Saporta, A.et al.Benchmarking saliency methods for chest X-ray interpretation.Nat. Mach. Intell.4, 867–878, DOI: 10.1038/s42256-022-00536-x (2022)
-
[31]
Eigen, D., Rolfe, J., Fergus, R. & LeCun, Y . Understanding Deep Architectures using a Recursive Convolutional Network (2014). ArXiv:1312.1847 [cs]
-
[32]
Khan, R. U., Zhang, X., Kumar, R. & Aboagye, E. O. Evaluating the Performance of ResNet Model Based on Image Recognition. InProceedings of the 2018 International Conference on Computing and Artificial Intelligence, 86–90, DOI: 10.1145/3194452.3194461 (ACM, Chengdu China, 2018)
-
[33]
Sarwinda, D., Paradisa, R. H., Bustamam, A. & Anggia, P. Deep learning in image classification using residual network (resnet) variants for detection of colorectal cancer.Procedia Comput. Sci.179, 423–431, DOI: 10.1016/j.procs.2021.01.025 (2021)
-
[34]
Brigato, L. & Iocchi, L. A close look at deep learning with small data. In2020 25th international conference on pattern recognition (ICPR), 2490–2497 (IEEE, 2021)
work page 2021
-
[35]
Guo, M. & Du, Y . Classification of Thyroid Ultrasound Standard Plane Images using ResNet-18 Networks. In2019 IEEE 13th International Conference on Anti-counterfeiting, Security, and Identification (ASID), 324–328, DOI: 10.1109/ICASID. 2019.8925267 (IEEE, Xiamen, China, 2019). 51.Hestness, J.et al.Deep learning scaling is predictable, empirically.arXiv pr...
-
[36]
Bahri, Y ., Dyer, E., Kaplan, J., Lee, J. & Sharma, U. Explaining neural scaling laws.Proc. Natl. Acad. Sci.121, e2311878121 (2024)
work page 2024
- [38]
-
[39]
InProceedings of the AAAI conference on artificial intelligence, vol
Irvin, J.et al.Chexpert: A large chest radiograph dataset with uncertainty labels and expert comparison. InProceedings of the AAAI conference on artificial intelligence, vol. 33, 590–597 (2019). 56.Breiman, L. Random forests.Mach. learning45, 5–32 (2001)
work page 2019
-
[40]
Fisher, A., Rudin, C. & Dominici, F. All models are wrong, but many are useful: Learning a variable’s importance by studying an entire class of prediction models simultaneously.J. Mach. Learn. Res.20, 1–81 (2019). 58.Tahir, A.et al.Covid-qu-ex dataset, DOI: 10.34740/kaggle/dsv/3122958 (2021). Accessed: 2022-12-01
-
[41]
Huang, G., Liu, Z., Van Der Maaten, L. & Weinberger, K. Q. Densely connected convolutional networks. InProceedings of the IEEE conference on computer vision and pattern recognition, 4700–4708 (2017)
work page 2017
-
[42]
In2009 IEEE conference on computer vision and pattern recognition, 248–255 (Ieee, 2009)
Deng, J.et al.Imagenet: A large-scale hierarchical image database. In2009 IEEE conference on computer vision and pattern recognition, 248–255 (Ieee, 2009)
work page 2009
-
[43]
Irvin, J.et al.Chexpert: A large chest radiograph dataset with uncertainty labels and expert comparison.CoRR abs/1901.07031(2019). 1901.07031
- [44]
- [45]
-
[46]
Balogh, G., McLaughlin, N. & Rainer, A. Evaluation of explainable ai localisation performance using relevance f-score. In 25th Irish Machine Vision and Image Processing Conference 2023, 96–103 (Irish Pattern Recognition & Classification Society, 2023)
work page 2023
-
[47]
In International conference on machine learning, 2668–2677 (PMLR, 2018)
Kim, B.et al.Interpretability beyond feature attribution: Quantitative testing with concept activation vectors (tcav). In International conference on machine learning, 2668–2677 (PMLR, 2018). 20/28
work page 2018
-
[48]
neural information processing systems32(2019)
Chen, C.et al.This looks like that: deep learning for interpretable image recognition.Adv. neural information processing systems32(2019)
work page 2019
-
[49]
Armato III, S. G.et al.The lung image database consortium (lidc) and image database resource initiative (idri): a completed reference database of lung nodules on ct scans.Med. physics38, 915–931 (2011). A Statistical Significance Tests This section describes the statistical procedures used to compare explanation quality across model variants. We use non- ...
work page 2011
discussion (0)
Sign in with ORCID, Apple, or X to comment. Anyone can read and Pith papers without signing in.