Recognition: no theorem link
ASD-Bench: A Four-Axis Comprehensive Benchmark of AI Models for Autism Spectrum Disorder
Pith reviewed 2026-05-13 07:18 UTC · model grok-4.3
The pith
A benchmark of AI models for autism screening shows near-perfect adult performance but lower results for adolescents, with accuracy often unrelated to calibration quality.
A machine-rendered reading of the paper's core claim, the machinery that carries it, and where it could break.
Core claim
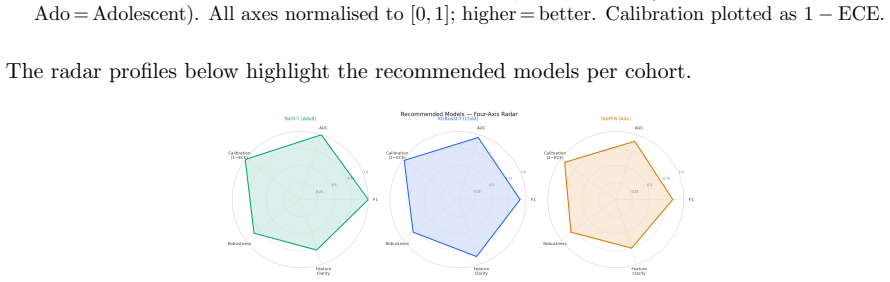
The paper claims that applying a four-axis benchmark to 4,068 AQ-10 records across three age cohorts demonstrates high performance for adult classification with many models achieving perfect F1 and AUC scores, a lower ceiling for adolescents at F1 of 0.837, shifting dominant features by age group, and a clear dissociation between accuracy and calibration as seen in models like AdaBoost.
What carries the argument
The ASD-Bench framework that assesses models on predictive performance, calibration, interpretability, and adversarial robustness, supported by the Heuristic Aggregate Penalty metric which weights false negatives and cross-validation variance.
If this is right
- Deployment decisions for ASD screening should account for age-specific performance differences rather than aggregate scores.
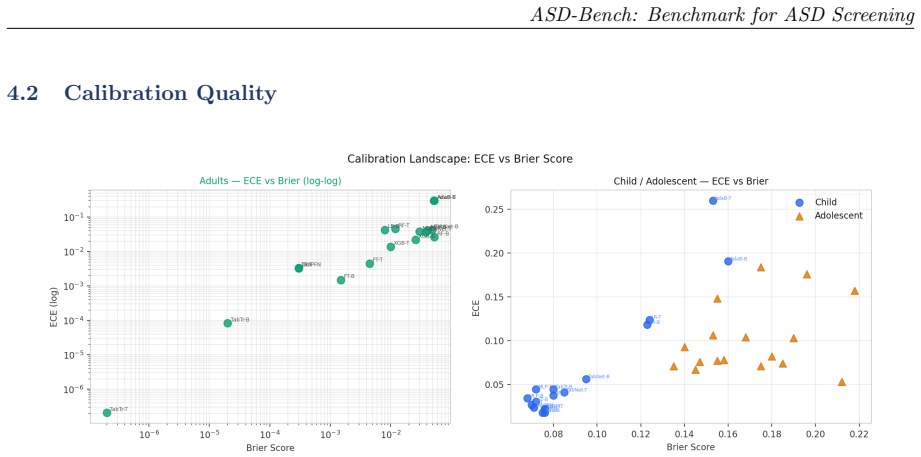
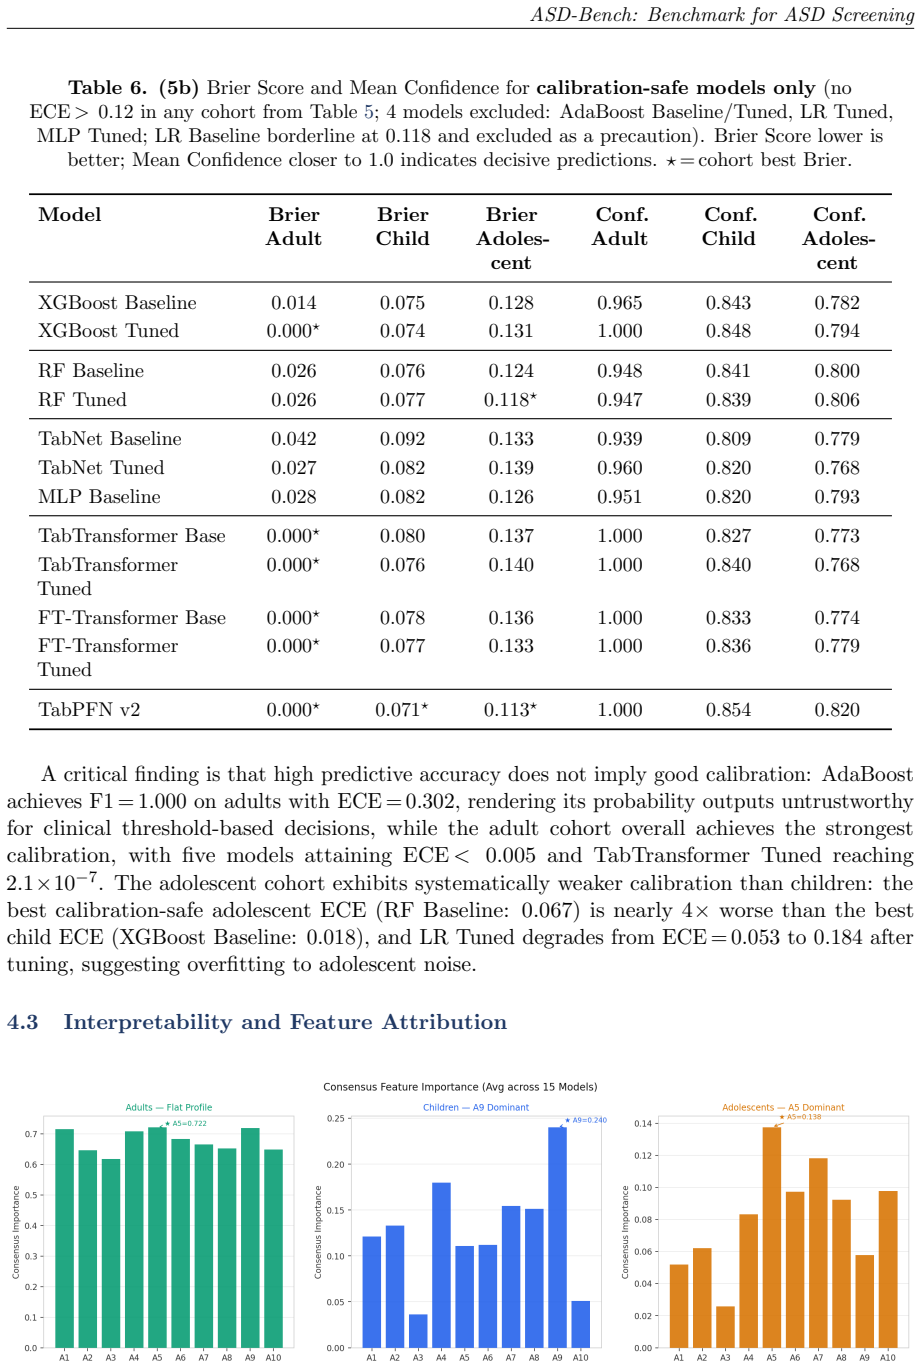
- Calibration metrics must be checked independently because high accuracy does not ensure reliable probability estimates.
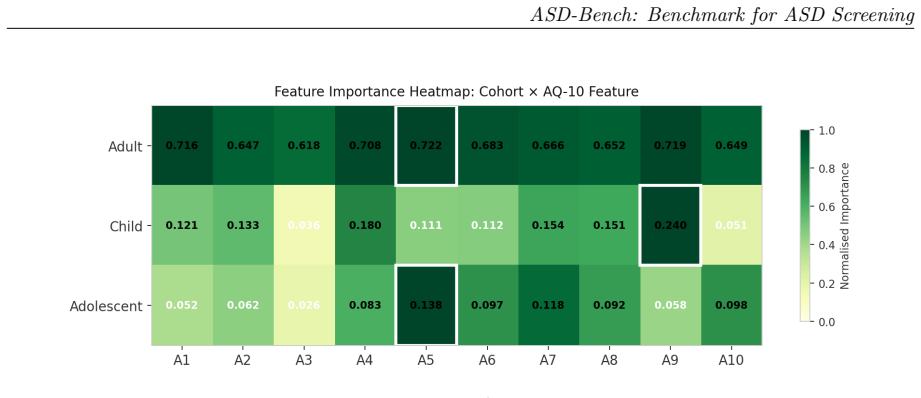
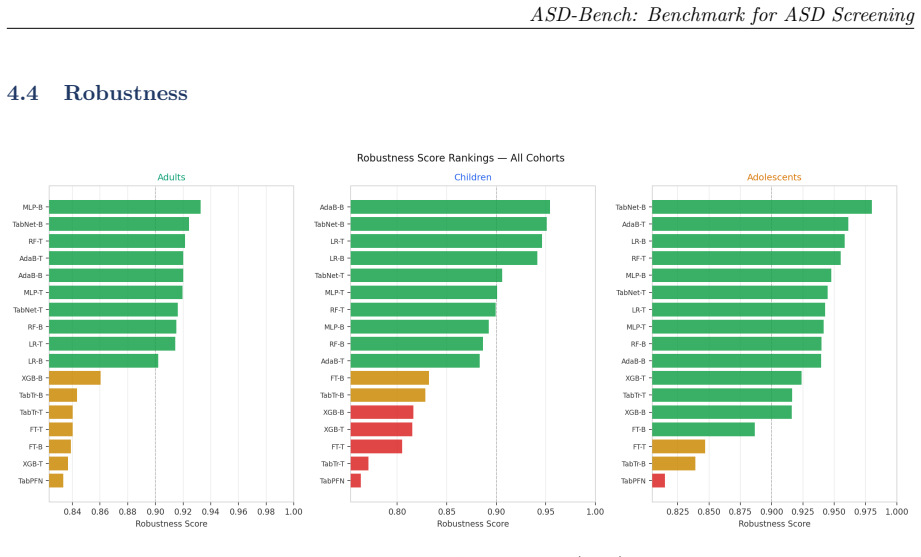
- Interpretability analysis reveals that different questionnaire items matter most for each age cohort.
- Adversarial testing is required to confirm model stability before any real-world use.
- Cohort-specific recommendations can guide selection of models for children, adolescents, or adults.
Where Pith is reading between the lines
- These age patterns might reflect developmental changes in how autism traits appear, suggesting screening questions could be adapted by age.
- Extending similar multi-axis benchmarks to other diagnostic questionnaires could identify comparable limitations in single-metric evaluations.
- If clinical validation confirms the calibration issues, hybrid human-AI systems may be needed to handle uncertain cases.
- Future work could test whether adding more data sources beyond questionnaires improves robustness across all ages.
Load-bearing premise
That the AQ-10 questionnaire responses serve as dependable ground-truth labels for autism spectrum disorder, allowing conclusions about model suitability for clinical use.
What would settle it
Collecting model outputs on a new dataset where autism diagnoses come from independent clinical assessments instead of questionnaire scores, and checking whether the age performance gaps and calibration mismatches remain.
Figures


read the original abstract
Automated ASD screening tools remain limited by single-architecture evaluations, axis-restricted assessment, and near-exclusive focus on adult cohorts, obscuring age-specific diagnostic patterns critical for early intervention. We introduce ASD-Bench, a systematic tabular benchmark evaluating ML, deep learning, and foundation model configurations across three age cohorts (children 1-11 yr, adolescents 12-16 yr, adults 17-64 yr) on four axes: predictive performance, calibration, interpretability, and adversarial robustness. Applied to a curated v3 dataset of 4,068 AQ-10 records, our benchmark spans classical models (XGBoost, AdaBoost, Random Forest, Logistic Regression), neural networks (MLP), deep tabular transformers (TabNet, TabTransformer, FT-Transformer), and TabPFN v2. We introduce the Heuristic Aggregate Penalty (HAP): a cost-sensitive metric penalising false negatives more heavily and incorporating cross-validation variance for deployment stability. Adult classification yields high performance (10/17 models achieve perfect F1 and AUC), while adolescents present a harder task (F1 ceiling 0.837 vs. 0.915 for children). Feature hierarchies shift across cohorts: A9 (social motivation) dominates for children, A5 (pattern recognition) leads for adolescents, and adults exhibit a flatter importance profile consistent with developmental social masking. Accuracy and calibration are dissociated: AdaBoost achieves F1=1.000 on adults with ECE=0.302, confirming single-metric evaluation is insufficient for clinical AI. Cohort-specific deployment recommendations are provided. All findings should be interpreted as proof-of-concept evidence on questionnaire-derived labels rather than clinically validated diagnostic performance.
Editorial analysis
A structured set of objections, weighed in public.
Referee Report
Summary. The manuscript introduces ASD-Bench, a systematic tabular benchmark evaluating 17 ML, neural, and foundation models (XGBoost, AdaBoost, TabNet, TabPFN v2, etc.) on ASD classification using a curated dataset of 4,068 AQ-10 questionnaire records across three age cohorts (children 1-11, adolescents 12-16, adults 17-64). It assesses four axes—predictive performance, calibration, interpretability, and adversarial robustness—introduces the Heuristic Aggregate Penalty (HAP) metric that penalizes false negatives and incorporates CV variance, reports perfect F1/AUC for 10/17 models on adults (F1 ceiling 0.837 on adolescents), notes shifting feature importances (A9 for children, A5 for adolescents) and accuracy-calibration dissociation (AdaBoost F1=1.000 with ECE=0.302), and offers cohort-specific deployment recommendations while framing all results as proof-of-concept on questionnaire-derived labels.
Significance. If the label-construction issue is resolved, the benchmark would usefully demonstrate the value of multi-axis evaluation for clinical tabular tasks and the insufficiency of single-metric assessment. The age-cohort feature-importance shifts and explicit HAP formulation are concrete contributions that could inform more deployment-aware model selection in questionnaire-based screening.
major comments (2)
- [Abstract] Abstract and dataset section: the binary labels are a deterministic function of the sum of the same 10 AQ-10 items supplied as features (standard AQ-10 scoring threshold). Consequently the reported perfect F1=1.000 and AUC=1.000 for 10/17 models on adults, the cohort performance gap, and the feature-importance shifts are expected artifacts of recovering the fixed scoring rule rather than evidence of ASD detection capability. This circularity directly undermines the central claims of clinical utility and cohort-specific deployment recommendations.
- [§3] §3 (dataset and label construction): the manuscript must explicitly state the exact rule used to derive the binary ground-truth label from the AQ-10 responses and quantify how much of the reported performance is attributable to this deterministic mapping. Without that disclosure the HAP metric and calibration results cannot be interpreted as measures of model quality for the intended clinical task.
minor comments (2)
- [Abstract] Abstract: the phrase 'v3 dataset' is undefined; clarify its provenance and any filtering steps applied to the 4,068 records.
- [Tables 2-4] Tables reporting F1/AUC/ECE: include per-fold standard deviations or confidence intervals so that 'perfect' scores can be assessed for stability rather than treated as point estimates.
Simulated Author's Rebuttal
We thank the referee for the detailed and constructive feedback. We agree that the label construction must be made fully explicit and that the implications for interpreting the benchmark results need to be clarified to prevent overstatement of clinical applicability. We will revise the manuscript accordingly to address these points.
read point-by-point responses
-
Referee: [Abstract] Abstract and dataset section: the binary labels are a deterministic function of the sum of the same 10 AQ-10 items supplied as features (standard AQ-10 scoring threshold). Consequently the reported perfect F1=1.000 and AUC=1.000 for 10/17 models on adults, the cohort performance gap, and the feature-importance shifts are expected artifacts of recovering the fixed scoring rule rather than evidence of ASD detection capability. This circularity directly undermines the central claims of clinical utility and cohort-specific deployment recommendations.
Authors: We acknowledge this observation and agree that the task reduces to recovering the standard AQ-10 scoring rule (positive if sum of the 10 item scores meets or exceeds the established threshold) from the individual item responses provided as features. The perfect performance observed for several models on the adult cohort is indeed consistent with their capacity to approximate this deterministic function. However, the benchmark retains value in demonstrating architectural differences on other axes, such as calibration (where even perfect-accuracy models like AdaBoost show high ECE) and adversarial robustness, as well as cohort-specific variations in feature importance and task difficulty. We will revise the abstract to explicitly describe the label derivation process and to emphasize that all results are to be interpreted as proof-of-concept evaluations on questionnaire-derived labels, not as validated ASD diagnostic tools. This will also temper the deployment recommendations to reflect the benchmark nature of the study. revision: yes
-
Referee: [§3] §3 (dataset and label construction): the manuscript must explicitly state the exact rule used to derive the binary ground-truth label from the AQ-10 responses and quantify how much of the reported performance is attributable to this deterministic mapping. Without that disclosure the HAP metric and calibration results cannot be interpreted as measures of model quality for the intended clinical task.
Authors: We will revise §3 to include the precise label construction rule: the binary label is set to 1 (ASD positive screen) if the total AQ-10 score, computed as the sum of the 10 item responses (each scored 0-3), is greater than or equal to 6, following the standard AQ-10 protocol. To quantify the contribution of this mapping, we will add an analysis showing that a simple threshold-on-sum baseline achieves the same performance ceiling as the best models on adults, confirming that the high performance is largely due to rule recovery. For the adolescent cohort, where performance is lower, we will discuss potential factors such as data noise or developmental variability that prevent perfect recovery. This addition will allow readers to properly contextualize the HAP metric and calibration results as measures of how well models implement the screening rule rather than novel diagnostic capability. revision: yes
Circularity Check
No significant circularity; standard benchmark on external AQ-10 dataset with explicit caveats.
full rationale
The paper is an empirical benchmark evaluating 17 models across performance, calibration, interpretability, and robustness on a curated dataset of 4,068 AQ-10 records for three age cohorts. It introduces the HAP metric and reports cohort-specific results while explicitly stating all findings are proof-of-concept evidence on questionnaire-derived labels rather than clinically validated diagnoses. No derivation chain, equations, or central claims reduce by construction to self-defined quantities, fitted parameters renamed as predictions, or self-citation load-bearing steps. Evaluations rely on standard cross-validation applied to an external dataset; the setup is self-contained against external benchmarks with no load-bearing self-referential elements.
Axiom & Free-Parameter Ledger
free parameters (1)
- HAP penalty weights
axioms (1)
- domain assumption AQ-10 questionnaire responses provide sufficiently reliable labels for benchmarking ASD classification models
Reference graph
Works this paper leans on
-
[1]
Yi Fang, Huiyu Duan, Fangyu Shi, Xiongkuo Min, and Guangtao Zhai
doi: 10.3389/fninf.2020.575999. Yi Fang, Huiyu Duan, Fangyu Shi, Xiongkuo Min, and Guangtao Zhai. Identifying children with autism spectrum disorder based on gaze-following. In2020 IEEE International Conference on Image Processing (ICIP), pages 423–427,
-
[2]
Yoav Freund and Robert E Schapire
doi: 10.1109/ICIP40778.2020.9190831. Yoav Freund and Robert E Schapire. A decision-theoretic generalization of on-line learning and an application to boosting.Journal of Computer and System Sciences, 55(1):119–139,
-
[3]
Goodfellow, Jonathon Shlens, and Christian Szegedy
Ian J. Goodfellow, Jonathon Shlens, and Christian Szegedy. Explaining and harnessing adversarial examples. In3rd International Conference on Learning Representations, ICLR 2015, San Diego, CA, USA, May
work page 2015
-
[4]
Explaining and Harnessing Adversarial Examples
URLhttps://arxiv.org/abs/1412.6572. Yury Gorishniy et al. Revisiting deep learning models for tabular data. InAdvances in Neural Information Processing Systems, volume 34, pages 18932–18943,
work page internal anchor Pith review Pith/arXiv arXiv
-
[5]
URLhttps://arxiv.org/abs/2207.08815. Afarinbar Grizan. ASD questionnaires – final,
-
[6]
TabTransformer: Tabular data modeling using contextual embeddings,
Xin Huang et al. TabTransformer: Tabular data modeling using contextual embeddings.arXiv preprint arXiv:2012.06678,
-
[7]
doi: https://doi.org/ 10.1016/j.neucom.2018.04.080
ISSN 0925-2312. doi: https://doi.org/ 10.1016/j.neucom.2018.04.080. URL https://www.sciencedirect.com/science/article/ pii/S0925231218306234. Deep Learning for Biological/Clinical Data. 19 ASD-Bench: Benchmark for ASD Screening Balaji Lakshminarayanan, Alexander Pritzel, and Charles Blundell. Simple and scalable predictive uncertainty estimation using dee...
-
[8]
Scott M Lundberg and Su-In Lee
doi: 10.1145/3556677.3556694. Scott M Lundberg and Su-In Lee. A unified approach to interpreting model predictions. In Advances in Neural Information Processing Systems, volume 30,
-
[9]
doi: 10.1177/13623613251375199. URLhttps://doi.org/10.1177/13623613251375199. Marco Tulio Ribeiro, Sameer Singh, and Carlos Guestrin. “Why should I trust you?”: Explaining the predictions of any classifier. InProceedings of the 22nd ACM SIGKDD International Conference on Knowledge Discovery and Data Mining, pages 1135–1144,
-
[10]
Christian Szegedy, Wojciech Zaremba, Ilya Sutskever, Joan Bruna, Dumitru Erhan, Ian J. Goodfellow, and Rob Fergus. Intriguing properties of neural networks. In2nd International Conference on Learning Representations, ICLR 2014, Banff, AB, Canada, April
work page 2014
-
[11]
Intriguing properties of neural networks
URL https://arxiv.org/abs/1312.6199. Qandeel Tariq, Jena Daniels, Jessica N Schwartz, Peter Washington, Haik Kalantarian, and Dennis P Wall. Mobile detection of autism through machine learning on home video: A development and prospective validation study.PLOS Medicine, 15(11):e1002705,
work page internal anchor Pith review Pith/arXiv arXiv
-
[12]
doi: 10.1371/journal.pmed.1002705. Fadi Thabtah. Autism spectrum disorder screening dataset. UCI Machine Learning Repository,
-
[13]
URL https://bmcmedicine.biomedcentral
doi: 10.1186/s12916-019-1466-7. URL https://bmcmedicine.biomedcentral. com/articles/10.1186/s12916-019-1466-7. World Health Organization. Autism spectrum disorders. https://www.who.int/news-room/ fact-sheets/detail/autism-spectrum-disorders,
-
[14]
Understanding deep learning requires rethinking generalization
Chiyuan Zhang, Samy Bengio, Moritz Hardt, Benjamin Recht, and Oriol Vinyals. Understanding deep learning requires rethinking generalization. In5th International Conference on Learning Representations, ICLR 2017, Toulon, France, April
work page 2017
-
[15]
URL https://arxiv.org/abs/ 1611.03530. 20
work page internal anchor Pith review arXiv
discussion (0)
Sign in with ORCID, Apple, or X to comment. Anyone can read and Pith papers without signing in.