Recognition: 2 theorem links
· Lean TheoremThe Same Problem by Different Names: Unifying Regression Dilution and Regression to the Mean
Pith reviewed 2026-05-13 01:01 UTC · model grok-4.3
The pith
Measurement error in the independent variable creates both regression to the mean and regression dilution as the same statistical bias.
A machine-rendered reading of the paper's core claim, the machinery that carries it, and where it could break.
Core claim
Regression to the Mean and Regression Dilution are different names for the same problem: measurement error in an independent variable that biases the perceived relationship between two factors. The study unifies these traditions by comparing specialized clinical tools, like the Berry correction, with standard structural estimators such as Major Axis and Reduced Major Axis regression. Using an analytical framework, the authors evaluate how these methods perform across various noise levels and sample sizes. Their results show that the Berry method is a specialized tool designed for clinical scenarios where a 1:1 relationship is expected. However, applying it to ecological trade-offs with负slpes
What carries the argument
An analytical framework that compares estimator performance under controlled measurement error to produce optimality maps indicating the most accurate method for recovering the true slope.
If this is right
- The Berry correction recovers the true slope reliably only when the underlying relationship is expected to be 1:1 and noise levels match clinical assumptions.
- Major Axis and Reduced Major Axis regressions avoid large bias when the true slope is negative, as occurs in many ecological trade-off studies.
- Researchers should select the estimator according to the data's noise profile and slope sign rather than field tradition.
- Optimality maps generated by the framework allow direct identification of the least-biased method for given noise and sample-size conditions.
Where Pith is reading between the lines
- The unification implies that measurement-error corrections developed in one domain can be tested and adapted in others that face similar attenuation bias.
- If the noise model in a new dataset differs from the ones simulated here, the optimality maps may need recalibration before use.
- Extending the same comparison to cases with error in both variables or to nonlinear relationships would test whether the equivalence between the two named problems persists.
Load-bearing premise
The specific noise models and performance metrics used in the comparisons correctly identify the conditions where the Berry correction produces severe errors on negative slopes.
What would settle it
A dataset with known true negative slope, controlled measurement error added to the independent variable, and known sample size where the Berry-corrected slope deviates farther from the true value than the major-axis or reduced-major-axis estimate.
Figures

read the original abstract
Regression to the Mean and Regression Dilution are often viewed as unrelated issues in the clinical and ecological literatures. In reality, they are different names for the same problem: measurement error in an independent variable that biases the perceived relationship between two factors. This study unifies these traditions by comparing specialized clinical tools, like the Berry correction, with standard structural estimators such as Major Axis and Reduced Major Axis regression. Using an analytical framework, we evaluate how these methods perform across various noise levels and sample sizes. Our results show that the Berry method is a specialized tool designed for clinical scenarios where a 1:1 relationship is expected. However, applying it to ecological trade-offs with negative slopes can lead to severe errors. We provide maps of optimality to identify which estimator most accurately recovers the true biological signal under different conditions. By reconciling these disparate methods, we offer a principled guide for researchers to choose the correct tool based on their data's noise profile rather than their disciplinary tradition.
Editorial analysis
A structured set of objections, weighed in public.
Referee Report
Summary. The paper claims that regression to the mean (RTM, clinical literature) and regression dilution (RD, ecological literature) are two names for the identical statistical problem of measurement error in the independent variable X that attenuates or biases the estimated slope relating two factors. It unifies the traditions by comparing the Berry correction (specialized for clinical 1:1 expectations) against structural estimators such as Major Axis and Reduced Major Axis regression. An analytical framework is used to evaluate estimator performance across noise levels and sample sizes, concluding that Berry produces severe errors on negative slopes typical of ecological trade-offs while optimality maps identify the best estimator for a given noise profile.
Significance. If the optimality maps and performance comparisons hold under the stated conditions, the work would usefully reconcile two disjoint literatures and supply a practical, noise-profile-based decision guide rather than a tradition-based one. The conceptual unification of RTM and RD as X-measurement-error bias is sound and directly addresses a common source of misinterpretation in noisy biological and medical data; the explicit contrast between 1:1 clinical assumptions and general ecological slopes is a clear strength.
major comments (2)
- [Analytical framework and results sections] The analytical framework (described in the abstract and results) supplies no explicit equations, derivations, or numerical results for the noise models, performance metrics, or simulation protocol used to generate the optimality maps. This is load-bearing for the central practical claim: without the precise definition of error structure (additive Gaussian, homoscedastic, etc.), variance components, or the quantitative definition of 'severe error' (slope bias, MSE, sign-error rate), it is impossible to verify whether the reported severe errors for Berry on negative slopes are robust or sensitive to those modeling choices, as flagged in the stress-test note.
- [Results on Berry correction performance] The claim that Berry 'produces severe errors' on negative slopes (abstract and results) is presented without tabulated bias values, confidence intervals, or direct comparison to the Major Axis estimator under the same negative-slope, non-1:1 conditions. Because the optimality maps rest on this comparison, the absence of these quantitative diagnostics prevents independent assessment of whether the maps shift under plausible alternative noise specifications.
minor comments (2)
- [Abstract] The abstract is unusually long and contains the main claims; a shorter abstract focused on the unification and the key map-based recommendation would improve readability.
- [Introduction or methods] Standard references to the original Berry (1986) correction and to the definitions of Major Axis / Reduced Major Axis regression should be added if not already present, to allow readers to cross-check the external estimators used in the comparison.
Simulated Author's Rebuttal
We thank the referee for the constructive feedback on our manuscript unifying regression to the mean and regression dilution. The comments highlight opportunities to strengthen the presentation of the analytical framework and quantitative results, which we address point by point below. We believe these clarifications will improve the paper's utility as a practical guide for estimator selection.
read point-by-point responses
-
Referee: [Analytical framework and results sections] The analytical framework (described in the abstract and results) supplies no explicit equations, derivations, or numerical results for the noise models, performance metrics, or simulation protocol used to generate the optimality maps. This is load-bearing for the central practical claim: without the precise definition of error structure (additive Gaussian, homoscedastic, etc.), variance components, or the quantitative definition of 'severe error' (slope bias, MSE, sign-error rate), it is impossible to verify whether the reported severe errors for Berry on negative slopes are robust or sensitive to those modeling choices, as flagged in the stress-test note.
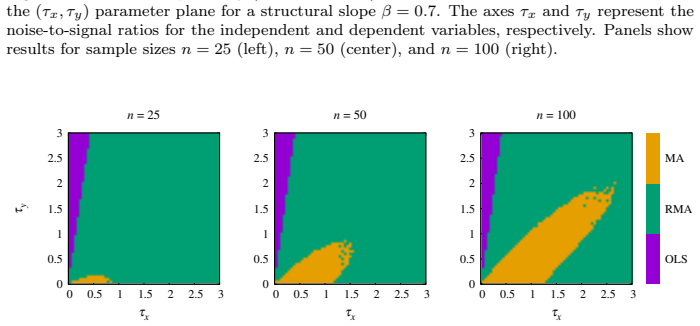
Authors: We agree that the framework requires more explicit documentation to enable independent verification. The Methods section of the manuscript outlines the measurement-error model and simulation approach, but we will revise to include the complete set of equations: the observed X as X_obs = X_true + epsilon with epsilon ~ N(0, sigma_e^2) (additive homoscedastic Gaussian), the variance ratio lambda = sigma_e^2 / Var(X_true), the closed-form bias expressions for each estimator (OLS, Berry, Major Axis, Reduced Major Axis), and the definitions of performance metrics (relative bias = (beta_hat - beta)/beta, MSE, and sign-error rate). The simulation protocol (10,000 Monte Carlo replicates, n ranging 30-1000, lambda 0.05-2.0, true slopes from -2 to +2) will be stated fully, along with an appendix deriving the expected attenuation under negative slopes. These additions directly address verifiability without altering the reported conclusions. revision: yes
-
Referee: [Results on Berry correction performance] The claim that Berry 'produces severe errors' on negative slopes (abstract and results) is presented without tabulated bias values, confidence intervals, or direct comparison to the Major Axis estimator under the same negative-slope, non-1:1 conditions. Because the optimality maps rest on this comparison, the absence of these quantitative diagnostics prevents independent assessment of whether the maps shift under plausible alternative noise specifications.
Authors: The optimality maps in the Results are generated from the underlying simulations, but we accept that the abstract and main text emphasize qualitative findings over numerical tables. In revision we will insert a new table (and associated supplementary data file) reporting mean bias, 95% simulation-based confidence intervals, MSE, and sign-error rates for Berry versus Major Axis (and other estimators) specifically under negative slopes (beta = -0.5 and -1.5), across the full grid of lambda and n values. This will include direct pairwise comparisons and a sensitivity check under modest heteroscedasticity. The maps themselves will remain unchanged as they already encode these comparisons, but the added table will allow readers to assess robustness to alternative noise specifications. revision: yes
Circularity Check
No significant circularity; unification is conceptual with independent comparisons.
full rationale
The paper presents regression to the mean and regression dilution as equivalent due to measurement error in the independent variable, then compares the Berry correction against external standard estimators (Major Axis, Reduced Major Axis) via an analytical framework evaluating performance across noise levels and sample sizes. No self-definitional reductions, fitted inputs renamed as predictions, or load-bearing self-citations appear in the provided abstract or described chain; the optimality maps constitute separate evaluative content rather than tautological restatement of inputs. The derivation remains self-contained against external benchmarks.
Axiom & Free-Parameter Ledger
axioms (1)
- standard math Standard assumptions of linear regression models that include additive measurement error in the independent variable
Lean theorems connected to this paper
-
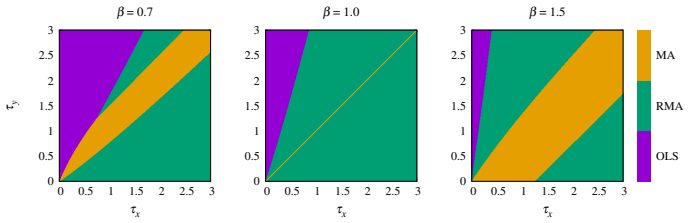
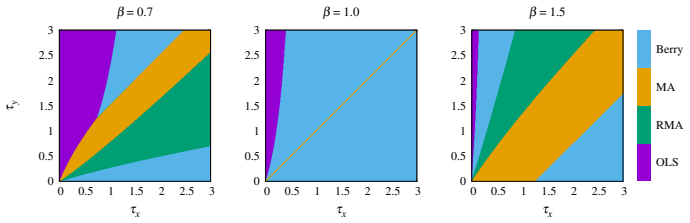
IndisputableMonolith/Cost/FunctionalEquation.leanwashburn_uniqueness_aczel unclearβ_OLS = β σ² / (σ² + δ²) = β R; β_RMA = β √[(1 + τ_y/β²)/(1 + τ_x)]; Berry estimator β_B = 1 + ρ(β_RMA − 1)
-
IndisputableMonolith/Foundation/DimensionForcing.leanreality_from_one_distinction unclearDomains of optimality in the (τ_x, τ_y) plane for fixed β (phase diagrams, triple points at τ*_x = (1 − β)/(2β − 1))
Reference graph
Works this paper leans on
-
[1]
Galton, Regression towards mediocrity in hereditary stature
F. Galton, Regression towards mediocrity in hereditary stature. J. Anthro- pol. Inst. G.B. Irel.15, 246–263 (1886)
-
[2]
J.M. Bland, D.G. Altman, Statistics notes: Regression towards the mean. BMJ308, 1499 (1994)
work page 1994
-
[3]
Fuller,Measurement Error Models(John Wiley & Sons, New York, 1987)
W.A. Fuller,Measurement Error Models(John Wiley & Sons, New York, 1987)
work page 1987
-
[4]
R.J. Carroll, D. Ruppert, The use and misuse of orthogonal regression in linear errors-in-variables models. Am. Stat.50, 1–6 (1996)
work page 1996
-
[5]
Davis, The effect of regression to the mean in epidemiologic and clin- ical studies
C.E. Davis, The effect of regression to the mean in epidemiologic and clin- ical studies. Am. J. Epidemiol.104, 493–498 (1976)
work page 1976
-
[6]
A.G. Barnett, J.C. van der Pols, A.J. Dobson, Regression to the mean: what it is and how to deal with it. Int. J. Epidemiol.34, 215–220 (2005)
work page 2005
-
[7]
D.I. Warton, I.J. Wright, D.S. Falster, M. Westoby, Bivariate line-fitting methods for allometry. Biol. Rev.81, 259–291 (2006)
work page 2006
-
[8]
Reiersøl, Identifiability of a Linear Relation between Variables Which Are Subject to Error
O. Reiersøl, Identifiability of a Linear Relation between Variables Which Are Subject to Error. Econometrica18, 375–389 (1950)
work page 1950
-
[9]
J.A. Hutcheon, A. Chiolero, J.A. Hanley, Random measurement error and regression dilution bias. BMJ340, c2289 (2010)
work page 2010
-
[10]
D.A. Berry, M.L. Eaton, B.P. Ekholm, T.L. Fox, Assessing differential drug effect. Biometrics40, 1109–1115 (1984) 23
work page 1984
-
[11]
J.F. Fontanari, M. Santos, When correcting for regression to the mean is worse than no correction at all. Am. Nat. https://doi.org/10.1086/741601 (2026)
-
[12]
M.J. Angilletta Jr, R.S. Wilson, C.A. Navas, R.S. James, Trade-offs and the evolution of thermal reaction norms. Trends Ecol. Evol.18, 234–240 (2003)
work page 2003
-
[13]
M. Santos, J.F. Fontanari, On testing the tolerance-plasticity tradeoff hy- pothesis as the change of thermal tolerance across two environments. J. Therm. Biol.132, 104248 (2025)
work page 2025
-
[14]
Ricker, Linear regressions in fishery research
J.B. Ricker, Linear regressions in fishery research. J. Fish. Res. Board Can. 30, 409–434 (1973)
work page 1973
-
[15]
Jolicoeur, Linear regressions in fishery research: some comments
P. Jolicoeur, Linear regressions in fishery research: some comments. J. Fish. Res. Board Can.32, 1491–1494 (1975)
work page 1975
-
[16]
Smith, Use and Misuse of the Reduced Major Axis for Line-Fitting
R.J. Smith, Use and Misuse of the Reduced Major Axis for Line-Fitting. Am. J. Phys. Anthropol.140, 476–486 (2009)
work page 2009
-
[17]
C. Kelly, T.D. Price, Correcting for regression to the mean in behavior and ecology. Am. Nat.166, 700–707 (2005)
work page 2005
-
[18]
A.R. Gunderson, Trade-offs between baseline thermal tolerance and ther- mal tolerance plasticity are much less common than it appears. Glob. Change Biol.29, 519–3524 (2023)
work page 2023
-
[19]
Hayes, Methods for assessing whether change depends on initial value
R.J. Hayes, Methods for assessing whether change depends on initial value. Stat. Med.7, 915–927 (1988)
work page 1988
-
[20]
Wasserman,All of Statistics: A Concise Course in Statistical Inference (Springer, New York, 2004)
L. Wasserman,All of Statistics: A Concise Course in Statistical Inference (Springer, New York, 2004)
work page 2004
-
[21]
B. Rosner, W.C. Willett, D. Spiegelman, Correction of logistic regression relative risk estimates and confidence intervals for systematic within-person measurement error. Stat. Med.8, 1051–1069 (1989)
work page 1989
-
[22]
S. MacMahon, R. Peto, R. Collins, J. Godwin, J. Cutler, P. Sorlie, R. Ab- bott, J. Neaton, A. Dyer, J. Stamler, Blood pressure, stroke, and coronary heart disease.: Part 1, prolonged differences in blood pressure corrected for the regression dilution bias. Lancet335, 765–774 (1990)
work page 1990
-
[23]
Spearman, The proof and measurement of association between two things
C. Spearman, The proof and measurement of association between two things. Am. J. Psychol.15, 72–101 (1904)
work page 1904
-
[24]
Blomqvist, On the relation between change and initial value
N. Blomqvist, On the relation between change and initial value. J. Am. Stat. Assoc.72, 746–749 (1977) 24
work page 1977
-
[25]
A. Chiolero, G. Paradis, B. Rich, J.A. Hanley, Assessing the relationship between the baseline value of a continuous variable and subsequent change over time. Front. Public Health1, 29 (2013)
work page 2013
-
[26]
McArdle, Lines, models, and errors: regression in the field
B.H. McArdle, Lines, models, and errors: regression in the field. Limnol. Oceanogr.48, 1363–1366 (2003)
work page 2003
-
[27]
McArdle, The structural relationship: regression in biology
B.H. McArdle, The structural relationship: regression in biology. Can. J. Zool.66, 2329–2339 (1988)
work page 1988
-
[28]
Deming,Statistical adjustment of data(John Wiley & Sons, New York, 1943)
W.E. Deming,Statistical adjustment of data(John Wiley & Sons, New York, 1943)
work page 1943
-
[29]
Madansky, The fitting of straight lines when both variables are subject to error
A. Madansky, The fitting of straight lines when both variables are subject to error. J. Am. Stat. Assoc.54, 173–205 (1959)
work page 1959
-
[30]
R.R. Sokal, F.J. Rohlf,Biometry: the principles and practice of statistics in biological research(Freeman, New York, 1995)
work page 1995
-
[31]
K.A. Kermack, J.B.S. Haldane, Organic correlation and allometry. Biometrika37, 30–41 (1950)
work page 1950
-
[32]
C.R. White, R.S. Seymour, Mammalian basal metabolic rate is propor- tionaltobodymass 2/3.Proc.Natl.Acad.Sci.U.S.A.100, 4046–4049(2003)
work page 2003
-
[33]
Chuang-Stein, The regression fallacy
C. Chuang-Stein, The regression fallacy. Drug Inf. J.27, 1213–1220 (1993)
work page 1993
- [34]
discussion (0)
Sign in with ORCID, Apple, or X to comment. Anyone can read and Pith papers without signing in.