Quantifying Rodda and Graham Gait Classification from 3D Markerless Kinematics derived from a Single-view Video in a Heterogeneous Pediatric Clinical Cohort
Pith reviewed 2026-05-22 10:14 UTC · model grok-4.3
The pith
Single-view video analysis recovers knee and ankle z-scores for Rodda and Graham gait classification in children.
A machine-rendered reading of the paper's core claim, the machinery that carries it, and where it could break.
Core claim
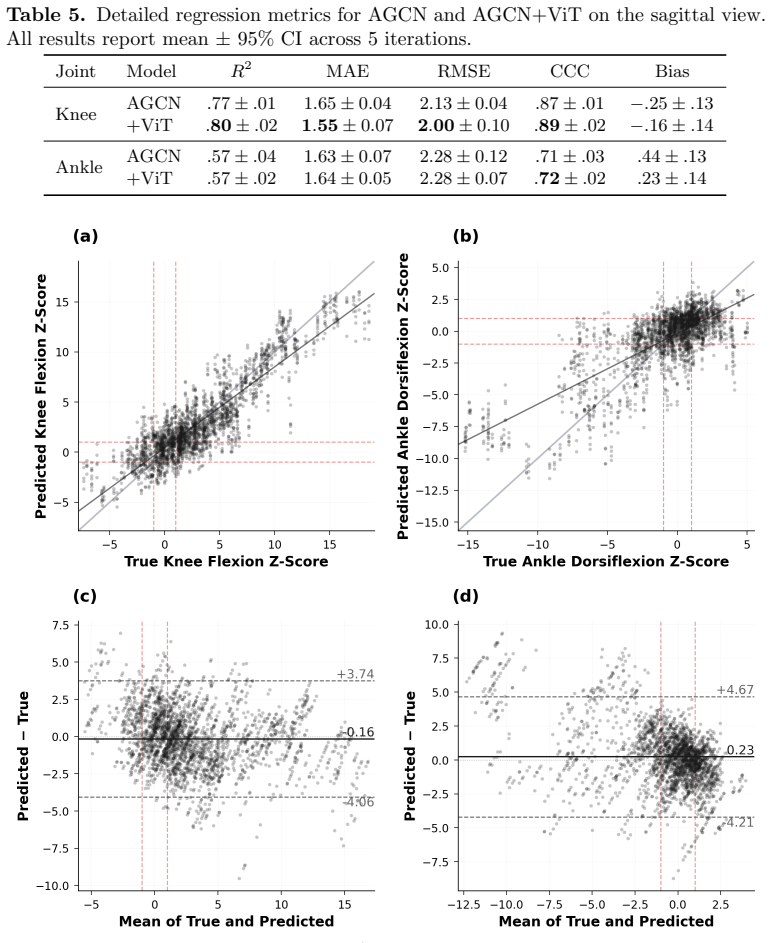
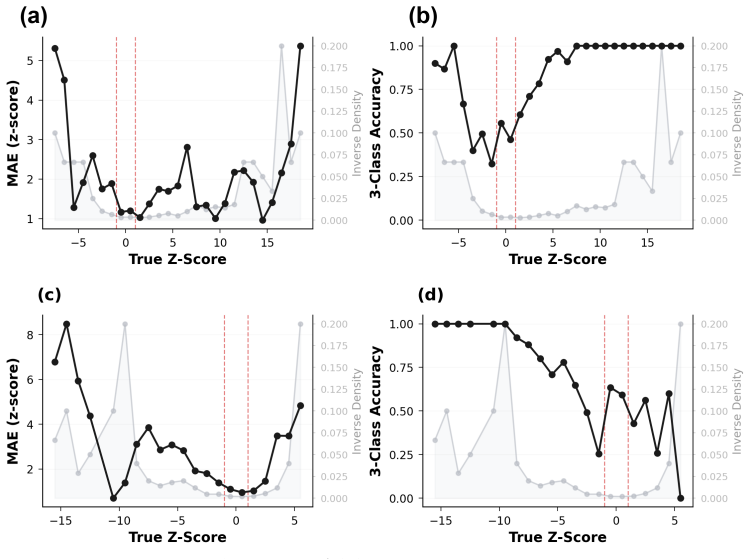
Across 1,058 bilateral limb samples from 529 trials of 152 children with 60 distinct primary diagnoses, the sagittal-view model achieved R² = 0.80 ± 0.02 and CCC = 0.89 ± 0.02 for knee z-scores and R² = 0.57 ± 0.02 and CCC = 0.72 ± 0.02 for ankle z-scores against 3D-IGA. Binary screening for excess knee flexion achieves AUROC = 0.88, correctly identifying 83% of affected children, and applying Rodda and Graham rules yields 43 ± 1% 7-class accuracy with macro-AUROC = 0.78 ± 0.01, with ankle prediction error remaining the primary bottleneck.
What carries the argument
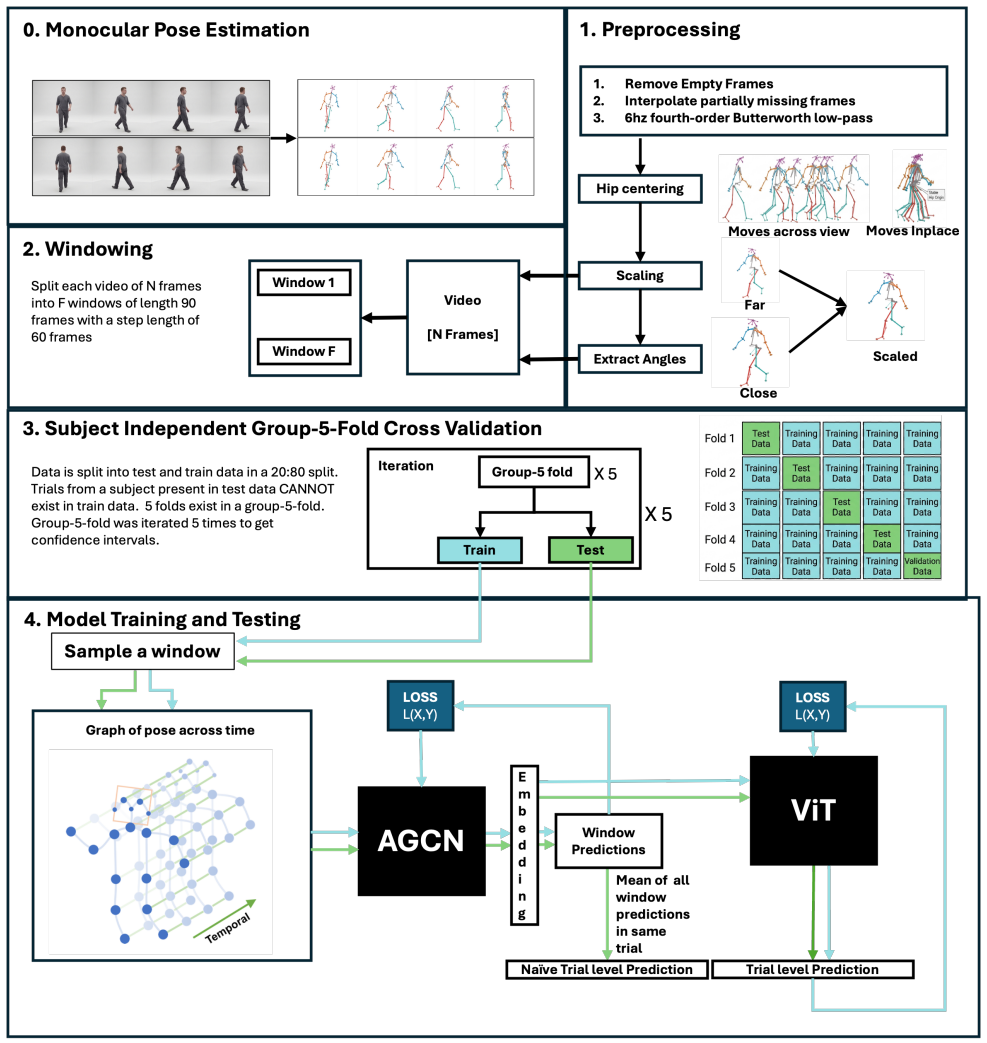
Markerless gait analysis pipeline that derives 3D kinematics from single-view video and maps them to Rodda and Graham knee and ankle z-scores.
If this is right
- Continuous z-scores enable longitudinal trajectory tracking across multiple patient visits.
- Quantitative measures provide a substrate for monitoring disease progression and treatment response.
- Binary screening identifies 83% of children with excess knee flexion.
- The approach supports scalable objective gait assessment in low-resource clinical settings without 3D equipment.
Where Pith is reading between the lines
- Adding a second camera angle could reduce the ankle z-score error that currently limits overall classification accuracy.
- Routine clinic videos could be processed automatically to create standardized gait records for any child who can walk.
- The same pipeline might be tested on adults with similar gait deviations to check whether the learned mapping holds outside pediatrics.
- Error patterns in ankle predictions could guide targeted improvements in how the model extracts foot and shank motion.
Load-bearing premise
A single sagittal-view video contains enough information to recover the specific sagittal-plane deviations that define the Rodda and Graham z-scores, and the learned mapping generalizes to new patients and recording conditions.
What would settle it
Retesting the pipeline on an independent set of 100 children from a different clinic yields R² below 0.6 for knee z-scores or AUROC below 0.75 for excess-flexion screening.
Figures


read the original abstract
Cerebral Palsy (CP) is a neurological disorder of movement and the most common cause of lifelong physical disability in childhood. Approximately 75% of children with CP are ambulatory, and accurate gait assessment is central to preserving walking function, which deteriorates by mid-adulthood in a quarter to half of adults with CP. The Rodda and Graham classification system quantifies sagittal-plane gait deviations using ankle and knee z-scores derived from 3D Instrumented Gait Analysis (3D-IGA), but 3D-IGA is expensive and limited to specialized centers, while observational assessment shows only moderate inter-rater agreement. We developed a markerless gait analysis pipeline that quantifies Rodda and Graham knee and ankle z-scores directly from single-view clinical gait videos. Across 1,058 bilateral limb samples from 529 trials of 152 children (88 male, 63 female; age 12.1 $\pm$ 4.0 years; 60 distinct primary diagnoses, cerebral palsy the most common at $n=54$), the sagittal-view model achieved $R^2 = 0.80 \pm 0.02$ and CCC $= 0.89 \pm 0.02$ for knee z-scores and $R^2 = 0.57 \pm 0.02$ and CCC $= 0.72 \pm 0.02$ for ankle z-scores against 3D-IGA. Binary screening for excess knee flexion achieves AUROC $= 0.88$, correctly identifying 83% of affected children, and applying Rodda and Graham rules yields $43 \pm 1$% 7-class accuracy with macro-AUROC $= 0.78 \pm 0.01$, ankle prediction error remaining the primary bottleneck. Beyond cross-sectional screening, continuous z-scores support longitudinal trajectory tracking across visits, providing a quantitative substrate for monitoring disease progression and treatment response unavailable from observational scales. These results demonstrate the feasibility of video-based z-score estimation, excess-flexion screening, and longitudinal trajectory tracking as a path toward scalable, objective gait assessment in low-resource clinical settings.
Editorial analysis
A structured set of objections, weighed in public.
Referee Report
Summary. The manuscript describes the development of a markerless gait analysis pipeline that estimates Rodda and Graham knee and ankle z-scores from single-view clinical gait videos in a heterogeneous cohort of 152 children with 60 distinct primary diagnoses. Using data from 1,058 bilateral limb samples across 529 trials, the sagittal-view model reports R² = 0.80 ± 0.02 and CCC = 0.89 ± 0.02 for knee z-scores and R² = 0.57 ± 0.02 and CCC = 0.72 ± 0.02 for ankle z-scores when compared to 3D-IGA. It also evaluates binary screening for excess knee flexion (AUROC = 0.88) and 7-class classification accuracy (43 ± 1%).
Significance. If the reported performance generalizes, the work could enable more accessible quantitative gait assessment in low-resource clinical settings without 3D-IGA. The heterogeneous cohort spanning 60 diagnoses and the large sample size (1,058 limbs) are strengths that support broader applicability. Reporting continuous z-scores for potential longitudinal tracking, along with multiple metrics (R², CCC, AUROC), provides a useful quantitative substrate beyond observational scales.
major comments (1)
- [Abstract] The abstract and results reporting do not specify the cross-validation partitioning strategy (e.g., subject-wise vs. trial-wise splits). With 529 trials drawn from only 152 children, this detail is load-bearing for the central generalization claim: without subject-stratified splits, the model could exploit child-specific gait signatures or session artifacts rather than recovering sagittal-plane deviations from video, undermining the reported R² = 0.80 ± 0.02 and CCC = 0.89 ± 0.02 for knee z-scores.
minor comments (1)
- [Abstract] The abstract states performance numbers but omits any description of model architecture, training procedure, or video quality handling; adding these would improve reproducibility assessment without altering the core claims.
Simulated Author's Rebuttal
We thank the referee for the positive assessment of our work's potential impact and for the constructive major comment. We address it directly below and will revise the manuscript to improve clarity on this point.
read point-by-point responses
-
Referee: [Abstract] The abstract and results reporting do not specify the cross-validation partitioning strategy (e.g., subject-wise vs. trial-wise splits). With 529 trials drawn from only 152 children, this detail is load-bearing for the central generalization claim: without subject-stratified splits, the model could exploit child-specific gait signatures or session artifacts rather than recovering sagittal-plane deviations from video, undermining the reported R² = 0.80 ± 0.02 and CCC = 0.89 ± 0.02 for knee z-scores.
Authors: We agree that explicit reporting of the partitioning strategy is essential given the multi-trial structure (529 trials from 152 children). Our experiments used subject-wise partitioning via leave-one-subject-out cross-validation: all trials from any given child were assigned entirely to training or held-out test folds. This design was chosen precisely to prevent leakage of child-specific gait signatures or session artifacts and to support the generalization claims. We will revise the abstract to state: 'using subject-wise cross-validation across 152 children' and will add a corresponding sentence in the Methods and Results sections describing the strategy and its rationale. This change directly addresses the concern without altering the reported metrics. revision: yes
Circularity Check
No circularity: predictions evaluated against independent external ground truth
full rationale
The paper trains a markerless pipeline to regress Rodda-Graham knee and ankle z-scores from single-view video and reports R², CCC, and AUROC against 3D-IGA measurements obtained from the same subjects. No equations, fitted parameters, or self-citations are presented that would make the reported z-score outputs definitionally identical to any internal model quantity or training target. The performance numbers are therefore empirical comparisons to an external reference standard rather than tautological self-consistency checks. Because the derivation chain contains no self-definitional, fitted-input-renamed-as-prediction, or load-bearing self-citation steps, the result is self-contained.
Axiom & Free-Parameter Ledger
free parameters (1)
- deep learning model weights and hyperparameters
axioms (1)
- domain assumption Single-view clinical gait videos contain sufficient sagittal-plane information to recover Rodda and Graham z-scores
discussion (0)
Sign in with ORCID, Apple, or X to comment. Anyone can read and Pith papers without signing in.