Recognition: 2 theorem links
· Lean TheoremPhotometric determination of the mass accretion rates of pre-main sequence stars. IX. Recent star formation in the periphery of NGC 346
Pith reviewed 2026-05-13 03:03 UTC · model grok-4.3
The pith
Mass accretion rates of young stars fall with proximity to hot massive stars, implying their ultraviolet light erodes gas discs.
A machine-rendered reading of the paper's core claim, the machinery that carries it, and where it could break.
Core claim
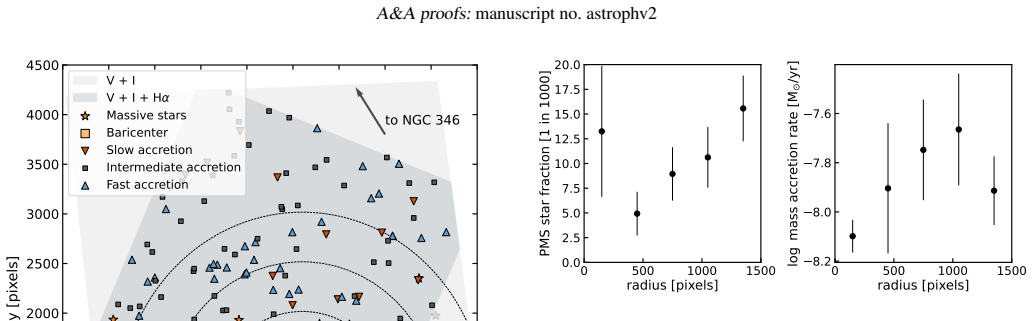
In a peripheral region of NGC 346, the ratios of accreting to non-accreting pre-main sequence stars relative to older stars, together with the measured mass accretion rates, correlate with distance from a group of hot massive stars. The authors conclude that ultraviolet radiation from these massive stars erodes the circumstellar discs of the pre-main sequence stars, reducing accretion closer to them. The pre-main sequence population has a median age of roughly 16 Myr, average mass 0.8 solar masses, and median accretion rate 8 times 10 to the minus 9 solar masses per year, values comparable to those in other low-density SMC regions.
What carries the argument
The observed correlation of accretion indicators with distance to hot massive stars, interpreted as evidence for ultraviolet-driven disc erosion.
If this is right
- Pre-main sequence stars nearer the hot stars exhibit lower accretion rates and fewer accreting members.
- External ultraviolet radiation can erode discs even in low-density, non-clustered environments.
- Accretion rates remain similar to those in other sparse SMC star-forming regions despite the lack of nebulosity.
- Some identified pre-main sequence stars show near-infrared excess, confirming ongoing disc presence.
- The region contains multiple stellar populations with ages from 10 Myr to 5 Gyr, indicating extended star formation history.
Where Pith is reading between the lines
- The same ultraviolet feedback could shorten disc lifetimes enough to limit planet formation in the vicinity of massive stars.
- Comparable distance-dependent patterns should appear in other galaxies containing groups of hot massive stars.
- Future spectroscopy or infrared imaging could test whether disc gas content decreases measurably with proximity to the massive stars.
- This process may help explain variations in disc survival across different star-forming environments.
Load-bearing premise
The H-alpha excess is produced only by accretion and the distance correlation reflects a direct causal effect from the massive stars rather than differences in age or selection.
What would settle it
Direct infrared measurements showing whether circumstellar disc sizes or gas masses are systematically smaller for pre-main sequence stars closer to the hot massive stars.
Figures


read the original abstract
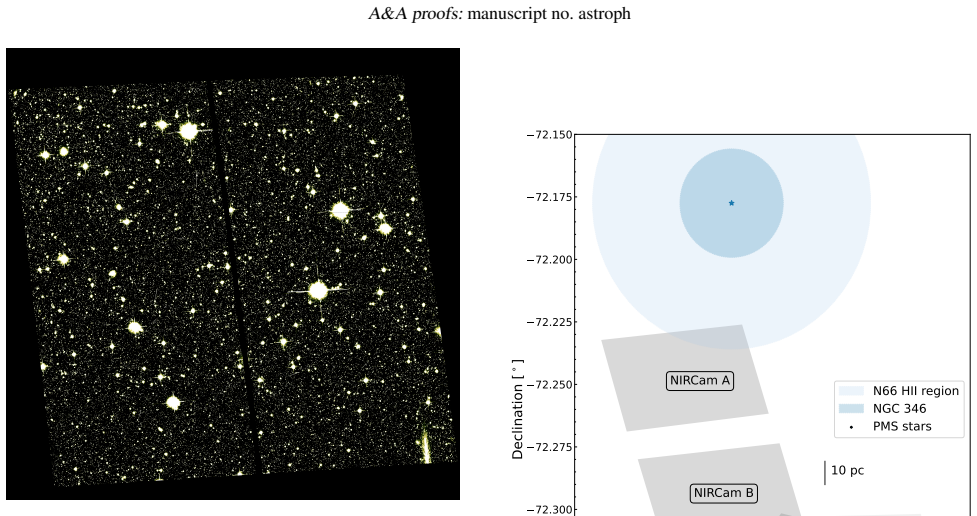
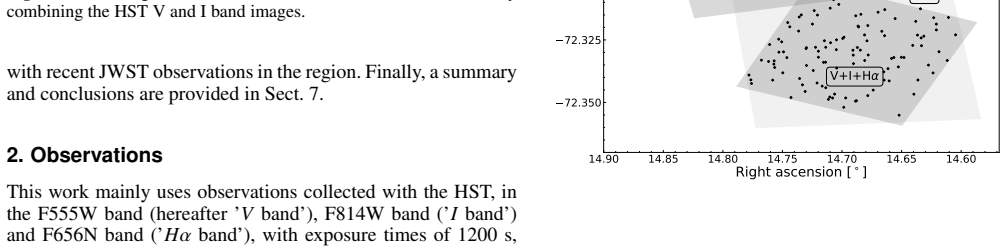
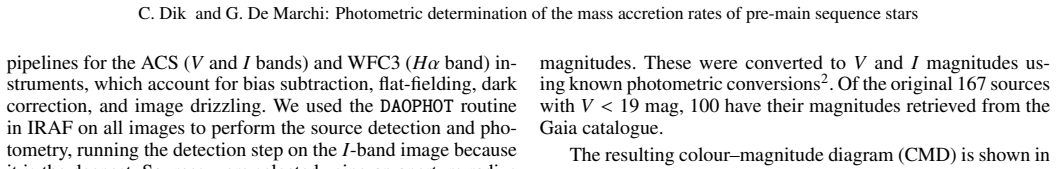
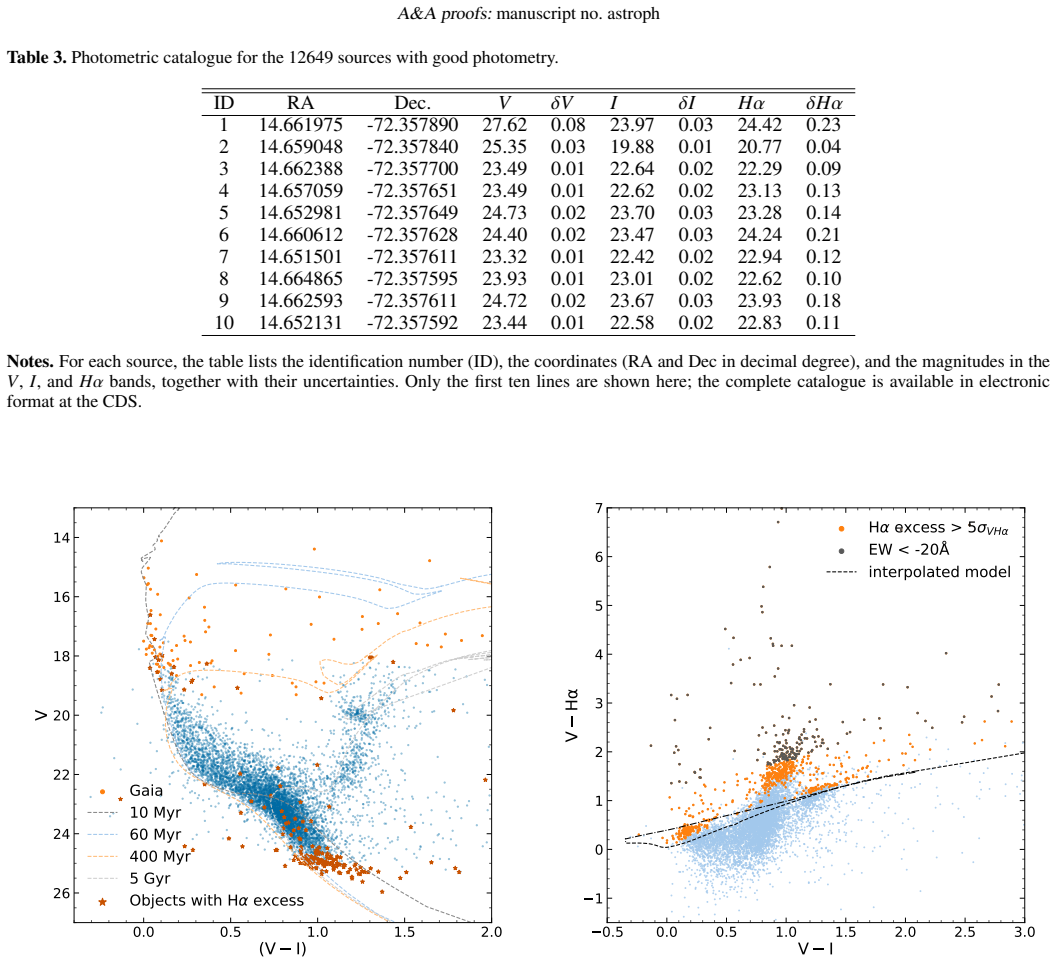
We studied the properties of star formation and the characteristics of young stars in a quiet region located beyond the outskirts of the prominent star-forming cluster NGC 346 in the Small Magellanic Cloud (SMC). Utilising observations from the Hubble Space Telescope across the broad V and I bands, as well as the narrow Halpha band, we identified populations with ages of roughly 10, 60, 400 Myr and of 5 Gyr through isochrone comparison. We successfully identified 137 bona fide pre-main sequence (PMS) candidates exhibiting Halpha excess with a significance level of 5 sigma, accompanied by an Halpha line emission equivalent width exceeding 20 \AA. Physical parameters for these PMS stars were determined, including mass, age, accretion luminosity, and mass accretion rate. Most PMS stars have an age around 16 Myr and an average mass of 0.80 \pm 0.16 M_sun. The median mass accretion rate for all 137 PMS stars is estimated to be about 8.0 x 10^(-9) M_sun/yr. While this rate is lower than that observed in the NGC 346 cluster itself, it is comparable with those measured for PMS stars in low-density star-forming regions in the SMC, despite the absence of apparent clustering and nebulosity. Furthermore, our analysis reveals that the ratios of accreting and non-accreting PMS stars to non-PMS stars and their mass accretion rate correlate with their distance from a group of hot massive stars in the vicinity. This suggests that the ultraviolet radiation emitted by these massive stars might erode the circumstellar discs of nearby PMS stars. Lastly, the overlap between our studied region and observations from the James Webb Space Telescope reveals that some of the identified PMS stars display near-infrared excess.
Editorial analysis
A structured set of objections, weighed in public.
Referee Report
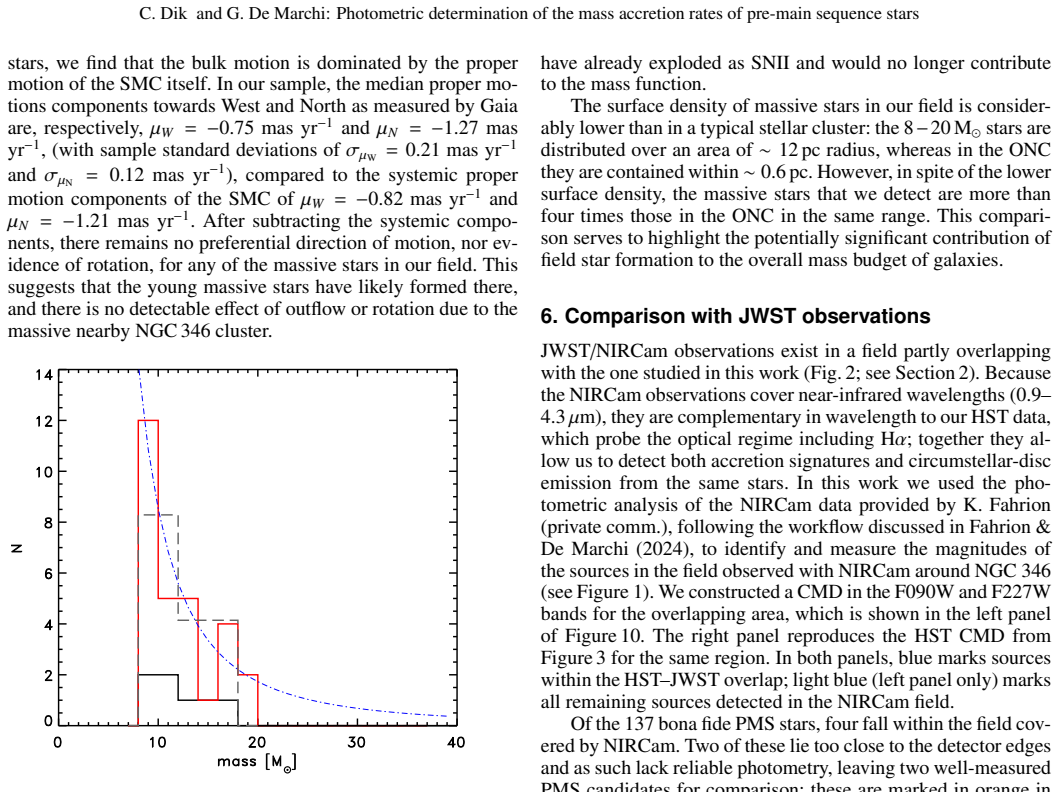
Summary. The paper uses HST V, I, and Hα photometry to identify 137 PMS candidates in a peripheral region of NGC 346 (SMC) via 5σ Hα excess and EW > 20 Å, derives their masses (~0.8 M⊙), ages (~16 Myr median), and mass accretion rates (median 8×10^{-9} M⊙ yr^{-1}), and reports that the ratios of accreting/non-accreting PMS to non-PMS stars plus the accretion rates correlate with distance from nearby hot massive stars, interpreted as UV photoevaporation eroding discs. Multiple older populations (60 Myr, 400 Myr, 5 Gyr) are also identified via isochrones, and some PMS stars show NIR excess in overlapping JWST data.
Significance. If the distance correlations prove causal after controlling for age and selection effects, the work would supply concrete, comparable statistics (137 stars, explicit 5σ + EW>20 Å cuts, median rate) on environmental disc erosion in a low-density, low-metallicity setting, extending the photometric accretion series to the SMC periphery and offering a falsifiable test of UV feedback models. The direct use of observed photometry and standard isochrones avoids circularity in the rate derivation itself.
major comments (3)
- [Abstract / PMS candidate selection] Abstract and PMS selection: the 5σ Hα excess plus EW>20 Å cut is taken as pure accretion, yet at the reported ~16 Myr median age and SMC metallicity chromospheric activity can produce comparable EWs; no quantitative comparison to non-accreting stars or activity models is supplied, which is load-bearing for both the accretion-rate values and the UV-erosion interpretation of the distance trend.
- [Results / distance correlation] Distance-correlation analysis: the reported trends in accreting/non-accreting ratios and median Ṁ_acc versus distance to the hot-star group are presented without completeness maps, detection-efficiency tests, or age/mass distribution checks across radial bins, leaving open the possibility that gradients in age or selection (rather than photoevaporation) drive the signal.
- [Abstract] Abstract: the median accretion rate 8.0×10^{-9} M⊙ yr^{-1} is stated without error budget, uncertainty from distance/extinction/isochrone choice, or robustness tests against the free parameters (5σ threshold, 20 Å cutoff), undermining assessment of the correlation's statistical significance.
minor comments (2)
- [Abstract] The abstract lists ages as 'roughly 10, 60, 400 Myr and of 5 Gyr'; clarify the precise isochrone ages adopted for the PMS subsample versus the older populations.
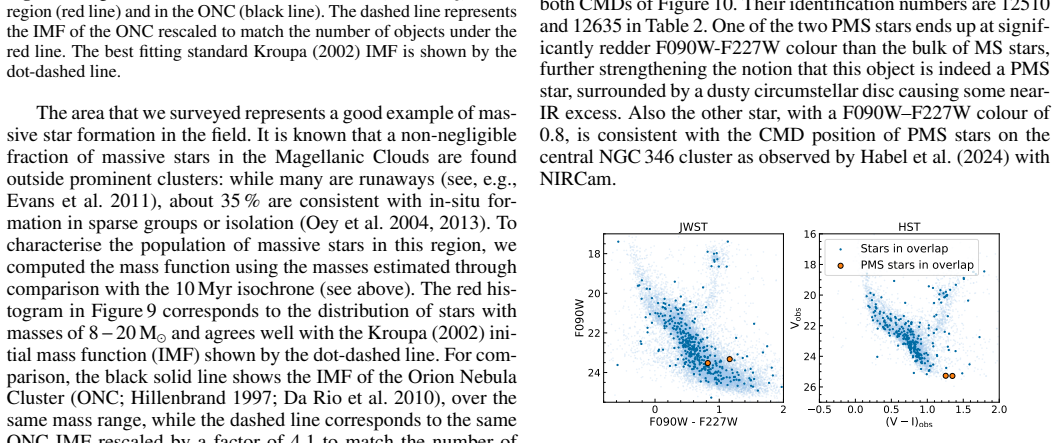
- [Discussion / JWST overlap] The JWST NIR-excess statement is qualitative; specify how many of the 137 PMS stars show excess, at which bands, and any selection criteria applied.
Simulated Author's Rebuttal
We thank the referee for their thorough review and valuable comments on our manuscript. We address each of the major comments below and indicate the revisions we will make to improve the paper.
read point-by-point responses
-
Referee: [Abstract / PMS candidate selection] Abstract and PMS selection: the 5σ Hα excess plus EW>20 Å cut is taken as pure accretion, yet at the reported ~16 Myr median age and SMC metallicity chromospheric activity can produce comparable EWs; no quantitative comparison to non-accreting stars or activity models is supplied, which is load-bearing for both the accretion-rate values and the UV-erosion interpretation of the distance trend.
Authors: We recognize the potential contribution of chromospheric activity to Hα emission in stars of this age and metallicity. Our selection criteria follow established practices in the photometric accretion series for identifying accreting PMS stars. In the revised version, we will include a quantitative comparison of the Hα equivalent widths of our PMS candidates against those of non-accreting stars in the same field and discuss relevant activity models for low-metallicity environments. This addition will better justify the accretion interpretation and support the distance correlation analysis. revision: yes
-
Referee: [Results / distance correlation] Distance-correlation analysis: the reported trends in accreting/non-accreting ratios and median Ṁ_acc versus distance to the hot-star group are presented without completeness maps, detection-efficiency tests, or age/mass distribution checks across radial bins, leaving open the possibility that gradients in age or selection (rather than photoevaporation) drive the signal.
Authors: The referee correctly identifies a gap in our analysis. We will add completeness maps derived from artificial star experiments, evaluate detection efficiencies in different radial bins, and examine the distributions of ages and masses as a function of distance from the hot stars. These checks will allow us to assess whether the observed trends are robust against selection effects or age gradients. If confirmed, we will strengthen the discussion of UV photoevaporation; if not, we will revise the interpretation accordingly. revision: yes
-
Referee: [Abstract] Abstract: the median accretion rate 8.0×10^{-9} M⊙ yr^{-1} is stated without error budget, uncertainty from distance/extinction/isochrone choice, or robustness tests against the free parameters (5σ threshold, 20 Å cutoff), undermining assessment of the correlation's statistical significance.
Authors: We agree that providing an error budget and robustness tests will enhance the manuscript. We will expand the abstract to include uncertainties and add a dedicated subsection detailing the error sources (distance, extinction, isochrone choice) and performing sensitivity tests by varying the selection thresholds. This will better contextualize the median rate and the significance of the reported correlations. revision: yes
Circularity Check
No significant circularity; results from direct photometry, isochrones, and standard conversions
full rationale
The paper derives PMS identifications, ages, masses, and accretion rates directly from HST V, I, and Hα photometry using 5σ excess plus EW > 20 Å criteria, standard isochrone fitting for parameters, and conventional L_acc-to-Ṁ_acc conversions. The reported radial correlations are observational statistics computed from these independently measured quantities, with no equations or claims that reduce the outputs (e.g., median Ṁ_acc or ratios) to fitted inputs from the same dataset by construction. Self-citations to the series for methodology are present but not load-bearing for the central claims, which remain falsifiable against external data and benchmarks.
Axiom & Free-Parameter Ledger
free parameters (2)
- 5-sigma significance threshold
- Equivalent-width cutoff of 20 Å
axioms (2)
- domain assumption Standard pre-main-sequence isochrones accurately map observed colors and magnitudes to mass and age.
- domain assumption H-alpha excess above the chosen threshold is produced by accretion rather than chromospheric activity.
Lean theorems connected to this paper
-
IndisputableMonolith/Cost/FunctionalEquation.leanwashburn_uniqueness_aczel unclearthe ratios of accreting and non-accreting PMS stars to non-PMS stars and their mass accretion rate correlate with their distance from a group of hot massive stars in the vicinity. This suggests that the ultraviolet radiation emitted by these massive stars might erode the circumstellar discs of nearby PMS stars.
-
IndisputableMonolith/Foundation/RealityFromDistinction.leanreality_from_one_distinction unclearMost PMS stars have an age around 16 Myr and an average mass of 0.80 ± 0.16 M⊙. The median mass accretion rate for all 137 PMS stars is estimated to be about 8.0 × 10^{-9} M⊙ yr^{-1}.
Reference graph
Works this paper leans on
-
[1]
C., Hollenbach, D., Laughlin, G., & Gorti, U
Adams, F. C., Hollenbach, D., Laughlin, G., & Gorti, U. 2004, ApJ, 611, 360 Alcalá, J. M., Manara, C. F., Natta, A., et al. 2017, A&A, 600, A20 Astropy Collaboration, Robitaille, T. P., Tollerud, E. J., et al. 2013, A&A, 558, A33
work page 2004
-
[2]
Baraffe, I., Chabrier, G., Allard, F., & Hauschildt, P. H. 2002, A&A, 382, 563
work page 2002
-
[3]
Beccari, G., De Marchi, G., Panagia, N., et al. 2015, A&A, 574, A44
work page 2015
-
[4]
Bell, C. P. M., Naylor, T., Mayne, N. J., Jeffries, R. D., & Littlefair, S. P. 2013, MNRAS, 434, 806
work page 2013
-
[5]
Bessell, M. S., Castelli, F., & Plez, B. 1998, A&A, 333, 231
work page 1998
-
[6]
Biazzo, K., Beccari, G., De Marchi, G., & Panagia, N. 2019, ApJ, 875, 51
work page 2019
-
[7]
Bohlin, R. C. 2016, AJ, 152, 60
work page 2016
-
[8]
Bohlin, R. C., Ryon, J. E., & Anderson, J. 2020, Update of the Photometric Calibration of the ACS CCD Cameras, Instrument Science Report ACS 2020- 8
work page 2020
-
[9]
Bressan, A., Marigo, P., Girardi, L., et al. 2012, MNRAS, 427, 127
work page 2012
-
[10]
2013, Reports on Progress in Physics, 76, 112901
Bromm, V . 2013, Reports on Progress in Physics, 76, 112901
work page 2013
-
[11]
Carini, R., Biazzo, K., De Marchi, G., et al. 2022, A&A, 663, A74
work page 2022
- [12]
-
[13]
Clarke, C. J. & Pringle, J. E. 2006, MNRAS, 370, L10
work page 2006
-
[14]
M., Stauffer, J., Baglin, A., et al
Cody, A. M., Stauffer, J., Baglin, A., et al. 2014, AJ, 147, 82
work page 2014
-
[15]
Cox, A. N., ed. 2000, Allen’s Astrophysical Quantities, 4th edn. (New York: Springer)
work page 2000
-
[16]
Crutcher, R. M. 1999, ApJ, 520, 706
work page 1999
- [17]
-
[18]
Dahm, S. E. 2008, AJ, 136, 521 De Marchi, G., Beccari, G., & Panagia, N. 2013, ApJ, 775, 68 De Marchi, G., Giardino, G., Biazzo, K., et al. 2024, ApJ, 977, 214 De Marchi, G. & Panagia, N. 2014, MNRAS, 445, 93 De Marchi, G., Panagia, N., & Beccari, G. 2017, ApJ, 846, 110 De Marchi, G., Panagia, N., & Romaniello, M. 2010, ApJ, 715, 1 De Marchi, G., Panagia,...
work page 2008
-
[19]
Evans, C. J., Taylor, W. D., Hénault-Brunet, V ., et al. 2011, A&A, 530, A108
work page 2011
-
[20]
Fahrion, K. & De Marchi, G. 2024, A&A, 681, A20 Gaia Collaboration, Vallenari, A., Brown, A. G. A., et al. 2023, A&A, 674, A1
work page 2024
-
[21]
Girardi, L., Dalcanton, J., Williams, B., et al. 2008, PASP, 120, 583
work page 2008
-
[22]
Gordon, K. D., Bohlin, R., Sloan, G. C., et al. 2022, AJ, 163, 267
work page 2022
- [23]
-
[24]
Gullbring, E., Hartmann, L., Briceño, C., & Calvet, N. 1998, ApJ, 492, 323
work page 1998
- [25]
-
[26]
Haid, S., Walch, S., Seifried, D., et al. 2018, MNRAS, 478, 4799
work page 2018
-
[27]
Harris, C. R., Millman, K. J., van der Walt, S. J., et al. 2020, Nature, 585, 357
work page 2020
- [28]
-
[29]
A., Henning, T., Brandner, W., & Dolphin, A
Hennekemper, E., Gouliermis, D. A., Henning, T., Brandner, W., & Dolphin, A. E. 2008, ApJ, 672, 914
work page 2008
-
[30]
Hillenbrand, L. A. 1997, AJ, 113, 1733
work page 1997
-
[31]
Hillenbrand, L. A. & White, R. J. 2004, ApJ, 604, 741
work page 2004
-
[32]
Hunter, J. D. 2007, Computing in Science and Engineering, 9, 90
work page 2007
-
[33]
Jeffries, R. D., Jackson, R. J., Franciosini, E., et al. 2017, MNRAS, 464, 1456
work page 2017
-
[34]
C., Nally, C., Habel, N., et al
Jones, O. C., Nally, C., Habel, N., et al. 2023, Nature Astronomy, 7, 694
work page 2023
-
[35]
S., MacKenty, J., Bohlin, R., et al
Kalirai, J. S., MacKenty, J., Bohlin, R., et al. 2009, WFC3 SMOV Proposal 11451: The Photometric Performance and Calibration of WFC3/IR, Instru- ment Science Report WFC3 2009-30, 20 pages
work page 2009
-
[36]
Kraus, S., Balega, Y . Y ., Berger, J.-P., et al. 2007, A&A, 466, 649
work page 2007
- [37]
-
[38]
Krumholz, M. R. 2012, ApJ, 759, 9
work page 2012
- [39]
-
[40]
C., Rémy-Ruyer, A., Galametz, M., et al
Madden, S. C., Rémy-Ruyer, A., Galametz, M., et al. 2013, PASP, 125, 600
work page 2013
-
[41]
McKee, C. F. & Ostriker, E. C. 2007, ARA&A, 45, 565
work page 2007
-
[42]
McSwain, M. V . & Gies, D. R. 2005, ApJ, 622, 1052
work page 2005
-
[43]
1978, Stellar Atmospheres, 2nd edn
Mihalas, D. 1978, Stellar Atmospheres, 2nd edn. (San Francisco: W. H. Free- man)
work page 1978
- [44]
- [45]
- [46]
-
[47]
Oey, M. S., Lamb, J. B., Kushner, C. T., Pellegrini, E. W., & Graus, A. S. 2013, ApJ, 768, 66
work page 2013
-
[48]
2019, MNRAS, 485, 5666 Ramírez-Tannus, M
Pastorelli, G., Marigo, P., Girardi, L., et al. 2019, MNRAS, 485, 5666 Ramírez-Tannus, M. C., Bik, A., Getman, K. V ., et al. 2025, A&A, 701, A139 Rémy-Ruyer, A., Madden, S. C., Galliano, F., et al. 2014, A&A, 563, A31
work page 2019
-
[49]
H., Blaylock, M., Decin, L., et al
Rieke, G. H., Blaylock, M., Decin, L., et al. 2008, AJ, 135, 2245
work page 2008
-
[50]
Rigby, J., Perrin, M., McElwain, M., & Kimble, R. 2023, PASP, 135, 048001
work page 2023
-
[51]
Rolleston, W. R. J., Dufton, P. L., McErlean, N. D., & Venn, K. A. 1999, A&A, 348, 728
work page 1999
-
[52]
1998, PhD thesis, Scuola Normale Superiore, Pisa, Italy
Romaniello, M. 1998, PhD thesis, Scuola Normale Superiore, Pisa, Italy
work page 1998
-
[53]
Russell, S. C. & Dopita, M. A. 1992, ApJ, 384, 508
work page 1992
- [54]
-
[55]
Sana, H., de Mink, S. E., de Koter, A., et al. 2012, Science, 337, 444
work page 2012
-
[56]
Shenar, T., Bodensteiner, J., Sana, H., et al. 2024, A&A, 690, A289
work page 2024
- [57]
-
[58]
Sicilia-Aguilar, A., Henning, T., & Hartmann, L. W. 2010, ApJ, 710, 597
work page 2010
-
[59]
Stauffer, J., Cody, A. M., Baglin, A., et al. 2014, AJ, 147, 83 Störzer, H. & Hollenbach, D. 1999, ApJ, 515, 669
work page 2014
-
[60]
Tang, J., Bressan, A., Rosenfield, P., et al. 2014, MNRAS, 445, 4287
work page 2014
-
[61]
Tognelli, E., Prada Moroni, P. G., & Degl’Innocenti, S. 2011, A&A, 533, A109
work page 2011
-
[62]
Tokunaga, A. T. & Vacca, W. D. 2005, PASP, 117, 421
work page 2005
- [63]
- [64]
- [65]
-
[66]
White, R. J. & Basri, G. 2003, ApJ, 582, 1109 Article number, page 11 of 11
work page 2003
discussion (0)
Sign in with ORCID, Apple, or X to comment. Anyone can read and Pith papers without signing in.