Recognition: 1 theorem link
· Lean TheoremEvaluating the impact of outcome delay on the efficiency of sample size re-estimation
Pith reviewed 2026-05-14 19:33 UTC · model grok-4.3
The pith
Outcome delays during recruitment inflate final sample sizes and power in sample size re-estimation trials
A machine-rendered reading of the paper's core claim, the machinery that carries it, and where it could break.
Core claim
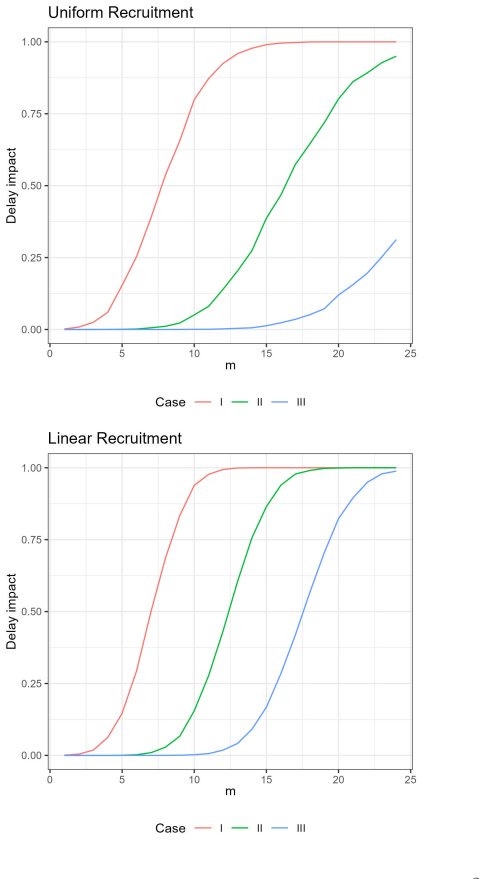
For both continuous and binary outcomes, the distribution of the final sample size after re-estimation widens and shifts upward with longer delays. The delay impact and cost metrics, together with root-mean-square error, quantify the resulting loss of precision in the sample-size estimate. The effect is strongest in settings where the re-estimated size is smaller than originally planned, often producing overpowered trials; the effect is weaker when the original plan remains smaller than the re-estimate.
What carries the argument
The internal-pilot SSR procedure with continuous recruitment during the outcome-delay window, tracked through the delay-impact and cost metrics that measure inflation of the final sample size relative to the re-estimation target.
If this is right
- Longer delays raise average final sample size and achieved power for any fixed original plan.
- The largest excess recruitment occurs when the re-estimation step would otherwise reduce the sample size.
- Root-mean-square error of the final sample-size estimate grows with delay length.
- The cost metric rises steadily as more pipeline participants are enrolled who do not inform the interim decision.
Where Pith is reading between the lines
- Designers could cap recruitment rate during the delay window to limit pipeline participants and reduce over-powering.
- Switching to shorter-term surrogate endpoints would shrink the delay window and thereby preserve the efficiency gains of SSR.
- Variable recruitment rates or staggered site activation would likely amplify the inflation shown in the constant-rate model.
Load-bearing premise
Recruitment continues at a constant rate throughout the entire outcome-delay period and no participants drop out or alter the planned enrollment speed.
What would settle it
A trial or simulation in which the observed distribution of final sample sizes under increasing delay lengths deviates from the predicted upward shift and widening, especially in the case where the re-estimated size is smaller than planned.
Figures


read the original abstract
Sample size reestimation can be a powerful tool to ensure that a clinical trial meets its prespecified power requirements when uncertainty regarding a design parameter exists at the planning stage. However, long term primary endpoints can be harmful to the efficiency of this trial design. If recruitment is continued while treatment outcomes are awaited, long delay can potentially lead to a large number of pipeline participants being recruited in the trial that do not contribute to the interim analysis. This may lead to a larger number of recruited participants than are actually deemed required, resulting in an overpowered trial with high cost. This paper studies the exact impact of such outcome delay on the efficiency of internal pilot type SSR designs. The distribution of the final sample size post SSR is obtained under various delay lengths for both continuous and binary outcome data, how delay impacts the precision of the final sample size estimate is then discussed. Precisely, the impact of delay on this precision is assessed through RMSE, as well as two more novel metrics, termed the delay impact and cost. The results indicate that with increase in delay length, the delay impact increases, inflating average sample size and power. However, the severity of the effect of delayed outcomes depends highly on the exact trial setting. Trials where the reestimated sample size is smaller than originally planned suffer the most from delayed outcomes, often leading to an overpowered trial. However, the impact of delay is substantially less if the original planned sample size remains smaller than the reestimated sample size.
Editorial analysis
A structured set of objections, weighed in public.
Referee Report
Summary. The manuscript investigates the effects of outcome delays on the efficiency of internal pilot sample size re-estimation (SSR) designs in clinical trials. For both continuous and binary endpoints, it derives the distribution of the final sample size under varying delay lengths with ongoing recruitment, and quantifies the impact using root mean square error (RMSE), a proposed 'delay impact' metric, and a cost measure. The key finding is that longer delays increase the average sample size and power, with the effect being most pronounced when the re-estimated sample size is less than the originally planned size, often resulting in overpowered trials.
Significance. This work addresses a practical issue in adaptive trial design by quantifying how outcome delays can lead to inefficiencies and overpowered trials. The simulation-based approach for normal and Bernoulli data, combined with the introduction of delay-specific metrics, offers valuable guidance for trialists planning SSR. Strengths include the explicit derivation of final N distributions and the differentiation of impact based on whether re-estimated N exceeds or falls below the planned N.
major comments (1)
- [Methods / Simulation Setup] The modeling and simulations assume constant recruitment rate during outcome delays (as stated in the abstract and methods). This produces a deterministic pipeline of non-informative subjects; variable rates (e.g., slowing accrual) would shrink the pipeline and reduce the reported inflation in average sample size and power. No sensitivity analysis to time-varying recruitment is described, making the quantitative severity statements load-bearing on this assumption.
minor comments (2)
- [Abstract] The abstract introduces the 'delay impact' and 'cost' metrics without definitions or formulas; a one-sentence definition in the abstract would improve accessibility.
- [Simulation Study] The paper reports results for continuous and binary data but does not specify the exact parameter values (e.g., variance, event rates) or error-handling rules used in the simulations; adding a short table of simulation parameters would aid reproducibility.
Simulated Author's Rebuttal
We thank the referee for their positive assessment of the manuscript and recommendation for minor revision. We address the major comment below.
read point-by-point responses
-
Referee: The modeling and simulations assume constant recruitment rate during outcome delays (as stated in the abstract and methods). This produces a deterministic pipeline of non-informative subjects; variable rates (e.g., slowing accrual) would shrink the pipeline and reduce the reported inflation in average sample size and power. No sensitivity analysis to time-varying recruitment is described, making the quantitative severity statements load-bearing on this assumption.
Authors: We agree that the constant recruitment rate assumption is central to the derivations and simulations, as it produces a deterministic pipeline and isolates the delay effect for analytical tractability. Variable rates would indeed shrink the pipeline and reduce inflation, but would require specifying an additional recruitment function, complicating the exact distributions we derive. We have added a paragraph in the revised Discussion section acknowledging this as a limitation, noting that the reported inflation represents an upper bound under constant accrual and that slower accrual would mitigate the impact. No full sensitivity analysis is included, as it would expand the scope beyond the current focus on delay length. revision: partial
Circularity Check
No significant circularity; results from forward simulation of trial processes
full rationale
The paper obtains the distribution of final sample size after SSR under varying delay lengths via direct modeling and simulation of recruitment and outcome processes for normal and Bernoulli data. Delay impact, RMSE, and cost metrics are computed as explicit functions of these simulated distributions rather than being redefined or fitted from the target quantities themselves. No derivation step reduces by construction to its own inputs, no load-bearing self-citation chain is invoked to justify uniqueness or ansatz choices, and the quantitative claims (inflation of average N and power with delay, especially when re-estimated N is smaller than planned) are outputs of the forward model under stated assumptions. The analysis is therefore self-contained.
Axiom & Free-Parameter Ledger
free parameters (1)
- delay length
axioms (1)
- domain assumption Recruitment continues during the outcome observation delay period
Reference graph
Works this paper leans on
-
[1]
G., Royston, P., and Holder, R
Burton, A., Altman, D. G., Royston, P., and Holder, R. L. (2006). The design of simulation studies in medical statistics. Statistics in Medicine, 25(24), 4279–4292.https://doi.org/10. 1002/sim.2673
2006
-
[2]
Chang, M. (2014). Adaptive Design Theory and Implementation Using SAS and R. In CRC press (2nd ed.). CRC Press, Taylor and Francis Group
2014
-
[3]
Edwards, J. M., Walters, S. J., Kunz, C., and Julious, S. A. (2020). A systematic review of the “promising zone” design. Trials, 21(1).https://doi.org/10.1186/s13063-020-04931-w
-
[4]
European Medicines Agency.http://www.ema.europa.eu/docs/en_GB/ document_library/Scientific_guideline/2009/09/WC500003616.pdf
(2007).Reflection paper on methodological issues in confirmatory clinical trials planned with an adaptive design. European Medicines Agency.http://www.ema.europa.eu/docs/en_GB/ document_library/Scientific_guideline/2009/09/WC500003616.pdf
2007
-
[5]
Friede T, and Kieser M. (2002). On the inappropriateness of an EM algorithm based procedure for blinded sample size re-estimation. Statistics in Medicine. 30;21(2):165-76. https://onlinelibrary.wiley.com/doi/10.1002/sim.977
-
[6]
Friede, T., and Kieser, M. (2004). Sample size recalculation for binary data in internal pilot study designs. Pharmaceutical Statistics, 3(4), 269–279.https://doi.org/10.1002/pst.140
-
[7]
Friede, T., and Kieser, M. (2006). Sample size recalculation in Internal pilot study designs: A review. In Biometrical Journal (Vol. 48, Issue 4, pp. 537–555). Wiley-VCH Verlag.https: //doi.org/10.1002/bimj.200510238
-
[8]
Friede, T., and Kieser, M. (2013). Blinded sample size re-estimation in superiority and noninferiority trials: Bias versus variance in variance estimation. Pharmaceutical Statistics, 12(3), 141–146.https://doi.org/10.1002/pst.1564
-
[9]
I., Shih, W
Gang, L. I., Shih, W. J., Xie, T., and Lu, J. (2002). A sample size adjustment procedure for clinical trials based on conditional power. Biostatistics 3(2), 277-287
2002
-
[10]
Gao, P., Ware, J. H., and Mehta, C. (2008). Sample size re-estimation for adaptive se- quential design in clinical trials. Journal of Biopharmaceutical Statistics, 18(6), 1184–1196. https://doi.org/10.1080/10543400802369053
-
[11]
L., and Shih W
Gould A. L., and Shih W. J. (1992). Sample size re-estimation without unblinding for normally distributed outcomes with unknown variance. Communications in Statistics (A), 21(10), 2833–2853
1992
-
[12]
Jennison, C., and Turnbull, B. W. (2015). Adaptive sample size modification in clinical trials: Start small then ask for more? Statistics in Medicine, 34(29), 3793–3810.https: //doi.org/10.1002/sim.6575
-
[13]
Kieser, M., and Friede, T. (2003). Simple procedures for blinded sample size adjustment that do not affect the type I error rate. Statistics in Medicine, 22(23), 3571–3581.https: //doi.org/10.1002/sim.1585 17
-
[14]
Kunzmann, K., Grayling, M. J., Lee, K. M., Robertson, D. S., Rufibach, K., and Wason, J. M. S. (2022). Conditional power and friends: The why and how of (un)planned, unblinded sample size recalculations in confirmatory trials. Statistics in Medicine, 41(5), 877–890.https: //doi.org/10.1002/SIM.9288
-
[15]
Mukherjee, A., Grayling, M. J., and Wason, J. M. S. (2022). Adaptive Designs: Benefits and Cautions for Neurosurgery Trials. World Neurosurgery, 161, 316–322.https://doi.org/ 10.1016/J.WNEU.2021.07.061
-
[16]
Mukherjee, A., Grayling, M. J., and Wason, J. M. S. (2025). Evaluating the impact of outcome delay on the efficiency of two-arm group-sequential trials. Statistics in Biopharma- ceutical Research,https://doi.org/10.1080/19466315.2025.2565162
-
[17]
Mukherjee, A. and Wason, J. M. S. (2025). Impact of Endpoint Delay on the Efficiency of Multi Arm Multi Stage Trials. Statistics in Medicine, 44(20-22)https://onlinelibrary. wiley.com/doi/10.1002/sim.70245
-
[18]
Mukherjee, A., Wason, J. M. S., and Grayling, M. J. (2022). When is a two-stage single-arm trial efficient? An evaluation of the impact of outcome delay. European Journal of Cancer, 166, 270–278.https://doi.org/10.1016/j.ejca.2022.02.010
-
[19]
Proschan, M. A. (2009). Sample size re-estimation in clinical trials. Biometrical Journal, 51(2), 348–357.https://doi.org/10.1002/bimj.200800266
-
[20]
Roufosse, F., Kahn, J.-E., Rothenberg, M. E., Wardlaw, A. J., Klion, A. D., Kirby, S. Y., Gilson, M. J., Bentley, J. H., Bradford, E. S., Yancey, S. W., Steinfeld, J., and Gleich, G. J. (2020). Efficacy and safety of mepolizumab in hypereosinophilic syndrome: A phase III, randomized, placebo-controlled trial. Journal of Allergy and Clinical Immunology, 14...
-
[21]
Shih, W. J., Li, G., and Wang, Y. (2016). Methods for flexible sample-size design in clinical trials: Likelihood, weighted, dual test, and promising zone approaches. Contemporary Clinical Trials, 47, 40–48.https://doi.org/10.1016/j.cct.2015.12.007
-
[22]
D., Dimairo, M., Shephard, N., Hayman, A., Whitehead, A., and Walters, S
Teare, M. D., Dimairo, M., Shephard, N., Hayman, A., Whitehead, A., and Walters, S. J. (2014). Sample size requirements to estimate key design parameters from external pilot randomised controlled trials: A simulation study. Trials, 15(1).https://doi.org/10.1186/ 1745-6215-15-264
2014
-
[23]
Wang, P., and Chow, S. C. (2021). Sample size re-estimation in clinical trials. Statistics in Medicine, 40(27), 6133–6149.https://doi.org/10.1002/sim.9175
-
[24]
Wason, J. M. S., Brocklehurst, P., and Yap, C. (2019). When to keep it simple - Adaptive designs are not always useful. BMC Medicine, 17(1).https://doi.org/10.1186/ s12916-019-1391-9
2019
-
[25]
W¨ ust, K. and Kieser M.(2003). Blinded Sample Size Recalculation for Normally Dis- tributed Outcomes Using Long-and Short-term Data. Biometrical Journal, 45https:// onlinelibrary.wiley.com/doi/10.1002/bimj.200390060
-
[26]
W¨ ust, K. and Kieser M.(2005). Including long- and short-term data in blinded sample size recalculation for binary endpoints. Computational Statistics and Data Analysis, 4(48) 10.1016/J.CSDA.2004.04.006 18
discussion (0)
Sign in with ORCID, Apple, or X to comment. Anyone can read and Pith papers without signing in.