pith. sign in

arxiv: 2605.19661 · v1 · pith:A2MODIRDnew · submitted 2026-05-19 · 🌌 astro-ph.GA

COSMOS-Web: Star formation along the early Hubble sequence and the evolution of dust over the redshift range 0<z<12

Pith reviewed 2026-05-20 03:52 UTC · model grok-4.3

classification 🌌 astro-ph.GA
keywords galaxy evolutionstar formationdust evolutionhigh-redshift galaxiesHubble sequencesubmillimeter observationsquenching
0
0 comments X p. Extension
pith:A2MODIRD Add to your LaTeX paper What is a Pith Number?
\usepackage{pith}
\pithnumber{A2MODIRD}

Prints a linked pith:A2MODIRD badge after your title and writes the identifier into PDF metadata. Compiles on arXiv with no extra files. Learn more

The pith

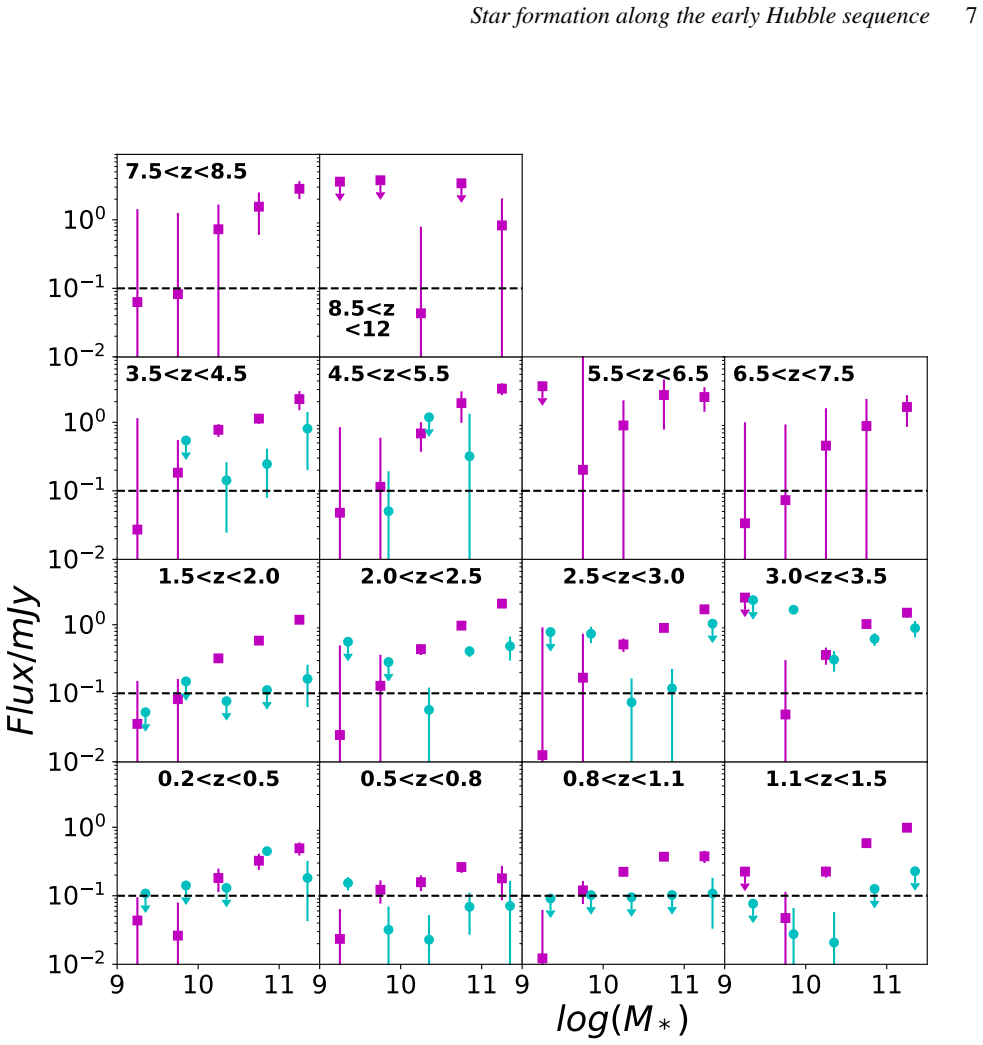
Mean star-formation rate of massive galaxies at 2<z<4.5 falls from 280 to 80 solar masses per year along the Hubble sequence from irregulars to spheroids.

A machine-rendered reading of the paper's core claim, the machinery that carries it, and where it could break.

The paper stacks deep 850-micron images to measure average dust emission, and thus star-formation rates, for galaxies split by stellar mass and morphological type from redshift 0 to 12. In the interval 2

Core claim

In the redshift range 2 < z < 4.5 the mean star-formation rate for the most massive galaxies falls along the Hubble sequence from ~280 solar masses per year for irregular galaxies to ~80 for spheroids, showing that quenching was already occurring shortly after the emergence of the Hubble sequence. A chemical evolution model with outflow rate equal to the star-formation rate reproduces the monotonic rise in dust-to-stellar mass ratio out to z~8 and the relationship between mean dust density and redshift.

What carries the argument

Stacking analysis of 850-micron flux densities from the COSMOS-Web catalogue, split by stellar mass and morphological class and converted to star-formation rates and dust masses.

If this is right

  • The transformation of submillimetre galaxies can reproduce the observed growth in number density of massive bulge-dominated and spheroidal galaxies over 1.5 < z < 4.
  • A starvation quenching model with a depletion time of ~10^{8.2} years accounts for the lower star-formation rates measured in spheroids.
  • The dust-to-stellar mass ratio increases monotonically with redshift out to z~8.
  • The mean cosmic dust density follows a specific relation with redshift over 0 < z < 12 that the same chemical model reproduces.

Where Pith is reading between the lines

These are editorial extensions of the paper, not claims the author makes directly.

  • If the morphological trend holds, current galaxy-formation simulations may need to introduce quenching physics at earlier epochs than most implementations assume.
  • The same outflow-equals-star-formation chemical model could be tested against dust measurements in the local universe to check consistency across cosmic time.
  • Deeper submillimeter surveys that reach lower stellar masses at z>4.5 could reveal whether the Hubble-sequence dependence of star formation persists or changes.

Load-bearing premise

Morphological classifications remain reliable and unbiased out to redshift 12 and the 850-micron flux provides an unbiased tracer of star-formation rate with negligible contamination from AGN or other sources.

What would settle it

High-resolution imaging that reclassifies a substantial fraction of the high-redshift sample into different morphological types with correspondingly different stacked fluxes would falsify the claimed decline along the Hubble sequence.

Figures

Figures reproduced from arXiv: 2605.19661 by Aparna Venkateshwaran, Feng-Yuan Frey Liu, Jordan D'Silva, Matthew Smith, Stephen Eales, Tom Bakx.

Figure 1
Figure 1. Figure 1: Images showing the signal-to-noise of our measurements of the mean 850-𝜇m flux density of 70 samples of galaxies, with the results from the basic stacking method shown above and from SIMSTACK shown below. The annotation shows the redshift and mass range for each sample. Each pixel in each image represents a different offset from the COSMOS-Web positions, with the zero-offset position being in the centre. T… view at source ↗
Figure 2
Figure 2. Figure 2: Mean flux density at 850 𝜇m versus mass for each redshift interval. The mauve points are the values measured with the basic stacking method. The cyan points are the values measured with SIMSTACK. The two sets have been offset by 0.1 in log10 (M∗ ), to prevent an overlap. The horizontal dashed line at a flux density of 0.1 mJy has been drawn to aid comparison between the panels. The limits are 3𝜎 upper limi… view at source ↗
Figure 3
Figure 3. Figure 3: Mean flux density at 850 𝜇m estimated with SIMSTACK (§2.4) for star-forming galaxies (mauve) and quiescent galaxies (cyan) plotted against stellar mass for the 14 redshift intervals. The two sets of points have been offset by 0.1 in log10 (M∗ ) so that they don’t overlap. The horizontal dashed line at a flux density of 0.1 mJy has been drawn to aid comparison between the panels. The upper limits are 3𝜎 upp… view at source ↗
Figure 4
Figure 4. Figure 4: Mean flux density at 850 𝜇m estimated with SIMSTACK for the four different morphological classes from Huertas-Company et al. (2025): irregular galaxies–green; disk-dominated galaxies–blue; bulge-dominated galaxies–cyan; spheroids–red. The horizontal dashed line at 0.1 mJy has been drawn to aid comparison between the panels. We have added offsets to the sets of points (0.05 in log10 (M∗ )) to avoid them ove… view at source ↗
Figure 5
Figure 5. Figure 5: The mean ratio of dust mass to stellar mass versus stellar mass for the 14 redshift intervals. The coloured symbols show the results for the three temperature models: blue–COLD; red–STAR-FORMER; cyan–EVOLVE. The three sets of points have been offset by ±0.1 along the x-axis for greater clarity.The upper limits are 3𝜎 upper limits. The dashed lines show the result of fitting equation 5 to the data points fo… view at source ↗
Figure 6
Figure 6. Figure 6: The mean ratio of dust mass to stellar mass versus redshift for the five intervals of stellar mass. The coloured symbols are for the different temperature models: blue–COLD; red–STAR-FORMER; cyan–EVOLVE. The sets of points have been offset by ±0.1 in redshift for greater clarity. is luminosity distance, and the dust mass-opacity coefficient, 𝜅(𝜈), is given by: 𝜅(𝜈) =  𝜈 𝜈850𝜇𝑚  𝛽 𝜅850𝜇𝑚 (4) We assumed a … view at source ↗
Figure 7
Figure 7. Figure 7: shows the weighted mean value of the five values for the dust-to-stellar mass ratio in each redshift interval plotted against redshift. We have calculated these weighted means separately for each temperature model and used the errors on dust-to-stellar mass ratios shown in [PITH_FULL_IMAGE:figures/full_fig_p012_7.png] view at source ↗
Figure 8
Figure 8. Figure 8: The mean dust density versus redshift for COLD (blue), STAR￾FORMER (red) and EVOLVE (cyan). The purple circles show our estimates based on the ground-based surveys of COSMOS (Eales & Ward 2024). The grey crosses show the estimates of Magnelli et al. (2020). A comparison of our results with other attempts to derive the relationship between mean dust density and redshift is given in our earlier paper (Eales … view at source ↗
Figure 9
Figure 9. Figure 9: Estimated star-formation rate versus redshift for a galaxy with an 850-𝜇m flux density of 1 mJy (see text for details) and for the temperature models: EVOLVE (cyan) and STAR-FORMER (red). We have not included COLD because any galaxy containing OB stars must contain some warm dust. We estimated the star-formation rate by integrating the SED of the dust model between wavelengths of 3 and 1100 𝜇m to calculate… view at source ↗
Figure 10
Figure 10. Figure 10: Mean value of the star-formation rate estimated from the bolometric dust luminosity plotted against redshift, with the colour of the symbol showing the morphological class: red–spheroids; blue–disk-dominated galaxies; green–irregular galaxies; cyan–bulge-dominated galaxies. The lines show the predicted relationships for the ‘galaxy main sequence’ (Popesso et al. 2023). The upper limits are 3𝜎 upper limits… view at source ↗
Figure 11
Figure 11. Figure 11: Ratio of the mean star-formation rate estimate from the dust emission to the mean of the COSMOS-Web estimates from the UV-to-near-IR SED for the same sample of galaxies. The continuous horizontal line shows where the two estimates are equal and the two dashed lines show where the star-formation rate estimated from the dust emission is 2 or 0.5 times the COSMOS-Web estimate. The colours show the different … view at source ↗
Figure 12
Figure 12. Figure 12: Mean star-formation rate estimated from the dust emission for galaxies in the four morphological classs in the redshift range 2 < 𝑧 < 4.5 and 10.0 < log10M∗ < 10.5 (blue), 10.5 < log10M∗ < 11.0 (red) and 11.0 < log10M∗ < 11.5 (mauve). The horizontal dashed lines show the predicted star-formation rate for a galaxy on the galaxy ‘main sequence’ at a redshift of 3 with log10M∗ = 10.25 (blue), 10.5 (red) and … view at source ↗
Figure 13
Figure 13. Figure 13: Histograms of the specific star-formation rate for the four morpho￾logical classes in the redshift range 2 < z < 4.5 and with 11.5 > log10M∗ > 10.5. In this case, the star-formation rates are the values estimated from UV￾to-near-IR photometry in the COSMOS-Web catalogue (§2.2). The vertical lines show the median values of SSFR for the four classes. The lines for the irregulars and the disk-dominated are s… view at source ↗
Figure 15
Figure 15. Figure 15: shows the results for Λ = 0, Λ = 1 and Λ = 2. The 0 2 4 6 8 10 12 Redshift 10 4 10 3 10 2 10 1 10 0 10 1 D u s t D e n s i ty/ 1 0 5 M M p c 3 COLD STAR-FORMER EVOLVE [PITH_FULL_IMAGE:figures/full_fig_p020_15.png] view at source ↗
Figure 16
Figure 16. Figure 16: The mean density of dust-traced gas versus redshift for COLD (blue), STAR-FORMER (red) and EVOLVE (cyan) and from our previous study (purple). The solid line shows the ‘star-formation history of the uni￾verse’, an analytic relationship derived from empirical estimates of the global star-formation rate (Madau & Dickinson 2014). The star-formation-density axis has been scaled so that the star-formation hist… view at source ↗
read the original abstract

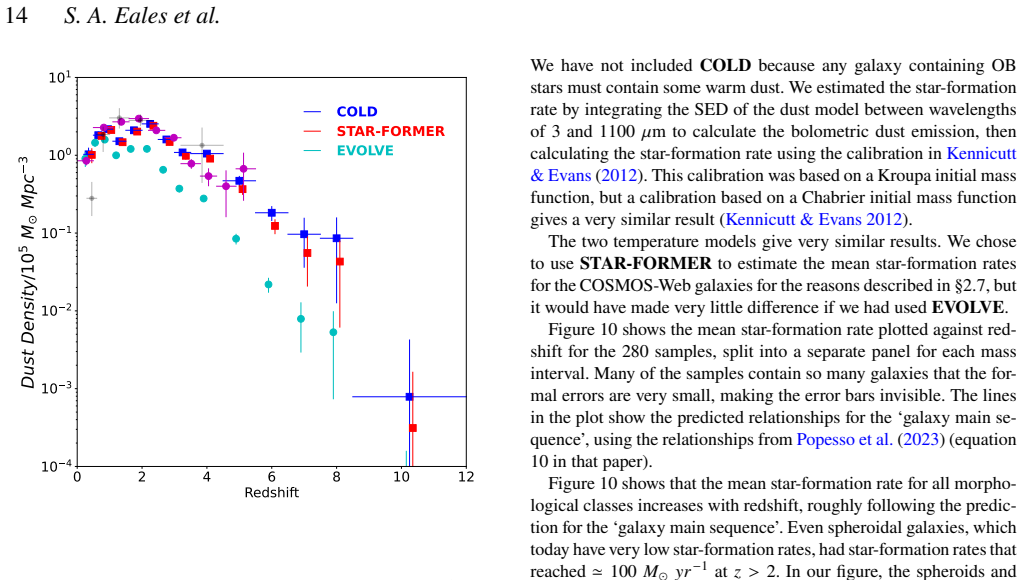
We have carried out a stacking analysis with the COSMOS-Web catalogue on one of the deepest ever SCUBA-2 images at 850 microns, allowing us to estimate the mean submillimetre flux density for samples of galaxies split by stellar mass and morphological class over the redshift range 0<z<12. For all morphological classes, the mean star-formation rate estimated from the dust emission increases with redshift, reaching a value for the most massive galaxies (~10^11 soar masses) of >~80 solar masses per year at 2 < z < 4.5. In this redshift range, the mean star-formation rate for these galaxies falls along the Hubble sequence from ~280 solar masses per year for irregular galaxies at one end to ~80 solar masses per year for spheroids at the other end, which shows that quenching was already happening shortly after the emergence of the Hubble sequence. The decrease in the star-formation rate for the spheroidal galaxies can be reproduced with a `starvation' quenching model with a depletion time of ~10^{8.2} years. We also show that the transformation of `submillimetre galaxies' can reproduce the growth in number-density of massive bulge-dominated and spheroidal galaxies over the redshift range 1.5 <z < 4. As a side-project, we have used our stacking results to show that the ratio of dust mass to stellar mass in galaxies increases with redshift out to z~8 and to determine the relationship between the mean density of dust and redshift in the range 0 < z <12. We show that a chemical evolution model based on the `star-formation history' of the universe, with a gas outflow rate equal to the star-formation rate, can explain the monotonic rise in the dust-to-stellar mass ratio and reproduce the relationship between mean dust density and redshift remarkably accurately.

Editorial analysis

A structured set of objections, weighed in public.

Desk editor's note, referee report, simulated authors' rebuttal, and a circularity audit. Tearing a paper down is the easy half of reading it; the pith above is the substance, this is the friction.

Referee Report

4 major / 4 minor

Summary. The manuscript reports results from a stacking analysis of deep SCUBA-2 850 μm observations using the COSMOS-Web catalog. Mean submillimeter fluxes are measured for galaxy samples binned by stellar mass and morphological type across 0 < z < 12. The authors find that mean star-formation rates increase with redshift, reaching >80 M⊙ yr⁻¹ for the most massive galaxies at 2 < z < 4.5. In this range, SFR declines along the Hubble sequence from ~280 M⊙ yr⁻¹ for irregulars to ~80 M⊙ yr⁻¹ for spheroids, interpreted as evidence for early quenching. A starvation model with a depletion time of 10^{8.2} yr reproduces the spheroid decline. The number density evolution of bulge-dominated galaxies is linked to the transformation of submillimeter galaxies. Additionally, the dust-to-stellar mass ratio is shown to rise monotonically to z ~ 8, which a chemical evolution model with outflow rate equal to the star-formation rate reproduces accurately.

Significance. If the morphological classifications prove robust and the 850 μm flux provides an unbiased SFR tracer at high redshift, the results would offer important constraints on the timing of quenching relative to the establishment of the Hubble sequence and on dust production and removal processes in the early universe. The use of stacking on a large sample enables statistical measurements of faint populations that individual detections cannot reach. The modeling efforts provide a simple framework that matches the observed trends.

major comments (4)
  1. [§3 (Morphological classification and sample selection)] The central claim that quenching was occurring along the Hubble sequence at 2<z<4.5 relies on the morphological classifications being reliable and unbiased. However, at these redshifts, band-shifting, limited resolution, and surface-brightness effects can bias visual or parametric classifications. The manuscript should include tests using simulated images or quantitative assessment of misclassification rates between irregular and spheroidal classes to confirm that the factor of ~3.5 difference in stacked flux is not partly due to classification errors.
  2. [§5.1 (Starvation quenching model)] The depletion time of ~10^{8.2} yr is chosen to match the observed decline in SFR for spheroids. This makes the model a post-hoc fit to the data rather than an a priori prediction, weakening the claim that the model 'reproduces' the observations in a physically motivated way. The manuscript should explore a range of depletion times or justify the value independently from other observations.
  3. [§5.2 (Chemical evolution model)] The assumption that the gas outflow rate equals the star-formation rate is adopted specifically to reproduce the observed rise in dust-to-stellar mass ratio. This introduces circularity, as the model is tuned to the same data it aims to explain. Alternative outflow prescriptions or comparisons to independent constraints on mass loading factors should be discussed.
  4. [§4 (SFR estimation from stacked 850 μm flux)] The conversion from mean 850 μm flux to SFR at z > 4 rests on standard assumptions (e.g., dust temperature, IMF) that are untested in this regime. Potential contamination from AGN or other sources is not quantified. The manuscript should provide sensitivity tests or cite high-z calibrations to support the quoted SFR values and the 'remarkably accurate' reproduction by the model.
minor comments (4)
  1. [Abstract] Typo: '10^11 soar masses' should read '10^11 solar masses'.
  2. [§2 (Data and observations)] More details on the stacking procedure, including how weights are assigned, background subtraction, and error estimation (e.g., bootstrap or jackknife), would improve reproducibility.
  3. [Figure 3 or equivalent (SFR vs morphology)] Clarify whether the error bars on the stacked fluxes account for cosmic variance or only statistical noise.
  4. [Throughout] The term 'remarkably accurately' for the model fit is subjective; replace with quantitative measures such as reduced chi-squared or residual statistics.

Simulated Author's Rebuttal

4 responses · 0 unresolved

We thank the referee for their constructive and detailed report. We address each major comment point by point below, providing the strongest honest defense of the manuscript while agreeing to revisions where the concerns are valid and can be addressed without misrepresenting our analysis.

read point-by-point responses
  1. Referee: [§3 (Morphological classification and sample selection)] The central claim that quenching was occurring along the Hubble sequence at 2<z<4.5 relies on the morphological classifications being reliable and unbiased. However, at these redshifts, band-shifting, limited resolution, and surface-brightness effects can bias visual or parametric classifications. The manuscript should include tests using simulated images or quantitative assessment of misclassification rates between irregular and spheroidal classes to confirm that the factor of ~3.5 difference in stacked flux is not partly due to classification errors.

    Authors: We agree that robust morphological classifications are essential for interpreting the SFR decline along the Hubble sequence. The COSMOS-Web classifications leverage deep JWST NIRCam imaging, which provides improved resolution and rest-frame optical sampling at 2<z<4.5 relative to prior HST data, mitigating some band-shifting and surface-brightness biases. To directly address the concern, we will add a new subsection to §3 with quantitative misclassification estimates from cross-comparisons to independent catalogs and mock galaxy simulations. Even allowing for moderate contamination rates, the factor of ~3.5 difference in mean stacked flux remains statistically significant and supports the quenching interpretation. revision: yes

  2. Referee: [§5.1 (Starvation quenching model)] The depletion time of ~10^{8.2} yr is chosen to match the observed decline in SFR for spheroids. This makes the model a post-hoc fit to the data rather than an a priori prediction, weakening the claim that the model 'reproduces' the observations in a physically motivated way. The manuscript should explore a range of depletion times or justify the value independently from other observations.

    Authors: The fiducial depletion time of 10^{8.2} yr is motivated by independent observational constraints on molecular gas depletion timescales in massive high-redshift galaxies. We acknowledge that presenting only this single value makes the comparison appear post-hoc. In the revised manuscript we will show model tracks for a range of depletion times (10^8 to 10^9 yr) and explicitly discuss how the choice affects the predicted SFR decline, while retaining the fiducial value as the one best matching both our data and literature gas depletion measurements. revision: yes

  3. Referee: [§5.2 (Chemical evolution model)] The assumption that the gas outflow rate equals the star-formation rate is adopted specifically to reproduce the observed rise in dust-to-stellar mass ratio. This introduces circularity, as the model is tuned to the same data it aims to explain. Alternative outflow prescriptions or comparisons to independent constraints on mass loading factors should be discussed.

    Authors: The outflow rate equal to the SFR is physically motivated by observed mass-loading factors of order unity in z~2-4 star-forming galaxies. We recognize that this choice was selected to match the dust-to-stellar mass trend. In the revision we will expand §5.2 to compare the fiducial model against alternatives (constant mass-loading factor, metallicity-dependent outflows) and reference independent constraints from cosmological simulations and direct wind observations, thereby reducing the appearance of circularity. revision: yes

  4. Referee: [§4 (SFR estimation from stacked 850 μm flux)] The conversion from mean 850 μm flux to SFR at z > 4 rests on standard assumptions (e.g., dust temperature, IMF) that are untested in this regime. Potential contamination from AGN or other sources is not quantified. The manuscript should provide sensitivity tests or cite high-z calibrations to support the quoted SFR values and the 'remarkably accurate' reproduction by the model.

    Authors: We have already excluded spectroscopically or photometrically identified AGN from the stacked samples using multi-wavelength catalogs. The adopted conversion follows standard assumptions supported by recent ALMA-based high-redshift calibrations. To strengthen the section, we will add explicit sensitivity tests varying dust temperature by ±10 K and will cite the specific high-z studies used for the IMF and temperature assumptions. These additions will support the quoted SFR values and the model comparison without altering the main conclusions. revision: yes

Circularity Check

2 steps flagged

Starvation quenching and chemical-evolution models are parameterized to reproduce the same SFR and dust trends they are invoked to explain

specific steps
  1. fitted input called prediction [Abstract and quenching-model paragraph]
    "The decrease in the star-formation rate for the spheroidal galaxies can be reproduced with a `starvation' quenching model with a depletion time of ~10^{8.2} years."

    The depletion time is chosen to reproduce the observed decline in mean SFR along the Hubble sequence for the same galaxies; the model therefore fits rather than predicts the trend.

  2. fitted input called prediction [Abstract and chemical-evolution paragraph]
    "a chemical evolution model based on the `star-formation history' of the universe, with a gas outflow rate equal to the star-formation rate, can explain the monotonic rise in the dust-to-stellar mass ratio"

    The assumption that outflow rate equals SFR is imposed specifically to reproduce the observed rise in dust-to-stellar mass ratio out to z~8; the model is therefore constructed to match the data it claims to explain.

full rationale

The paper's central claims rest on two models whose key free parameters (depletion time, outflow rate = SFR) are set to match the stacked 850 µm trends derived from the same COSMOS-Web sample. These steps are therefore statistically forced rather than independent predictions. The morphological classification and stacking analysis itself shows no circularity and is treated as input data.

Axiom & Free-Parameter Ledger

2 free parameters · 1 axioms · 0 invented entities

Central claims rest on two fitted parameters (depletion time and outflow rate equal to SFR) plus the domain assumption that submillimeter flux traces SFR; no new entities are postulated.

free parameters (2)
  • depletion time = ~10^{8.2} years
    Chosen as 10^8.2 yr to reproduce the drop in SFR for spheroidal galaxies.
  • outflow rate = equal to SFR
    Set equal to the star-formation rate in the chemical evolution model.
axioms (1)
  • domain assumption Submillimeter flux at 850 microns is a reliable tracer of star-formation rate
    Used to convert stacked flux densities into mean SFR estimates.

pith-pipeline@v0.9.0 · 5911 in / 1428 out tokens · 48067 ms · 2026-05-20T03:52:34.333179+00:00 · methodology

discussion (0)

Sign in with ORCID, Apple, or X to comment. Anyone can read and Pith papers without signing in.

Lean theorems connected to this paper

Citations machine-checked in the Pith Canon. Every link opens the source theorem in the public Lean library.

What do these tags mean?
matches
The paper's claim is directly supported by a theorem in the formal canon.
supports
The theorem supports part of the paper's argument, but the paper may add assumptions or extra steps.
extends
The paper goes beyond the formal theorem; the theorem is a base layer rather than the whole result.
uses
The paper appears to rely on the theorem as machinery.
contradicts
The paper's claim conflicts with a theorem or certificate in the canon.
unclear
Pith found a possible connection, but the passage is too broad, indirect, or ambiguous to say the theorem truly supports the claim.

Reference graph

Works this paper leans on

175 extracted references · 175 canonical work pages · 78 internal anchors

  1. [1]

    ISM masses and the star formation law at Z = 1 to 6 // ALMA observations of dust continuum in 145 galaxies in the COSMOS survey field

    ISM Masses and the Star formation Law at Z = 1 to 6: ALMA Observations of Dust Continuum in 145 Galaxies in the COSMOS Survey Field. , keywords =. doi:10.3847/0004-637X/820/2/83 , archivePrefix =. 1511.05149 , primaryClass =

  2. [2]

    , keywords =

    The Evolution of the Star-Forming Interstellar Medium Across Cosmic Time. , keywords =. doi:10.1146/annurev-astro-082812-141034 , archivePrefix =. 2003.06245 , primaryClass =

  3. [3]

    , keywords =

    Metal factories in the early Universe. , keywords =. doi:10.1093/mnras/stae1564 , archivePrefix =. 2303.07376 , primaryClass =

  4. [4]

    The Evolving Interstellar Medium of Star Forming Galaxies Since z=2 as Probed by Their Infrared Spectral Energy Distributions

    The Evolving Interstellar Medium of Star-forming Galaxies since z = 2 as Probed by Their Infrared Spectral Energy Distributions. , keywords =. doi:10.1088/0004-637X/760/1/6 , archivePrefix =. 1210.1035 , primaryClass =

  5. [5]

    The evolution of the dust temperatures of galaxies in the SFR$-M_{\ast}$ plane up to $z$$\,\thicksim\,$$2$

    The evolution of the dust temperatures of galaxies in the SFR-M _ * plane up to z 2. , keywords =. doi:10.1051/0004-6361/201322217 , archivePrefix =. 1311.2956 , primaryClass =

  6. [6]

    An ALMA Survey of Submillimetre Galaxies in the Extended Chandra Deep Field South: The Far-Infrared Properties of SMGs

    An ALMA survey of sub-millimetre Galaxies in the Extended Chandra Deep Field South: the far-infrared properties of SMGs. , keywords =. doi:10.1093/mnras/stt2273 , archivePrefix =. 1310.6362 , primaryClass =

  7. [7]

    Evolution of the dust emission of massive galaxies up to z=4 and constraints on their dominant mode of star formation

    Evolution of the dust emission of massive galaxies up to z = 4 and constraints on their dominant mode of star formation. , keywords =. doi:10.1051/0004-6361/201425031 , archivePrefix =. 1409.5796 , primaryClass =

  8. [8]

    The space density of luminous dusty star-forming galaxies at $z>4$: SCUBA-2 and LABOCA imaging of ultrared galaxies from $Herschel$-ATLAS

    The Space Density of Luminous Dusty Star-forming Galaxies at z > 4: SCUBA-2 and LABOCA Imaging of Ultrared Galaxies from Herschel-ATLAS. , keywords =. doi:10.3847/0004-637X/832/1/78 , archivePrefix =. 1611.00762 , primaryClass =

  9. [9]

    Are high redshift Galaxies hot? - Temperature of z > 5 Galaxies and Implications on their Dust Properties

    Are High-redshift Galaxies Hot? Temperature of z > 5 Galaxies and Implications for Their Dust Properties. , keywords =. doi:10.3847/1538-4357/aa886c , archivePrefix =. 1708.07842 , primaryClass =

  10. [10]

    Dust temperature and mid-to-total infrared color distributions for star-forming galaxies at 0<z<4

    Dust temperature and mid-to-total infrared color distributions for star-forming galaxies at 0 < z < 4. , keywords =. doi:10.1051/0004-6361/201731506 , archivePrefix =. 1710.10276 , primaryClass =

  11. [11]

    , keywords =

    The ALMA Spectroscopic Survey Large Program: The Infrared Excess of z = 1.5-10 UV-selected Galaxies and the Implied High-redshift Star Formation History. , keywords =. doi:10.3847/1538-4357/abb830 , archivePrefix =. 2009.10727 , primaryClass =

  12. [12]

    , keywords =

    The early Universe was dust-rich and extremely hot. , keywords =. doi:10.1093/mnrasl/slac075 , archivePrefix =. 2203.14312 , primaryClass =

  13. [13]

    , keywords =

    An empirical study of dust properties at the earliest epochs. , keywords =. doi:10.1093/mnras/stad1470 , archivePrefix =. 2305.09714 , primaryClass =

  14. [14]

    , keywords =

    Cold Dust in Galaxies. , keywords =. doi:10.1086/167341 , adsurl =

  15. [15]

    An Analysis of ALMA Deep Fields and the Perceived Dearth of High-z Galaxies

    An Analysis of ALMA Deep Fields and the Perceived Dearth of High-z Galaxies. , keywords =. doi:10.3847/1538-4357/aacd11 , archivePrefix =. 1806.05603 , primaryClass =

  16. [16]

    , keywords =

    Discovery of Four Apparently Cold Dusty Galaxies at z = 3.62-5.85 in the COSMOS Field: Direct Evidence of Cosmic Microwave Background Impact on High-redshift Galaxy Observables. , keywords =. doi:10.3847/1538-4357/ab55d6 , archivePrefix =. 1906.00040 , primaryClass =

  17. [17]

    , keywords =

    An ALMA survey of the SCUBA-2 CLS UDS field: physical properties of 707 sub-millimetre galaxies. , keywords =. doi:10.1093/mnras/staa769 , archivePrefix =. 1910.07524 , primaryClass =

  18. [18]

    , keywords =

    No Redshift Evolution of Galaxies' Dust Temperatures Seen from 0 < z < 2. , keywords =. doi:10.3847/1538-4357/ac6270 , archivePrefix =. 2203.16655 , primaryClass =

  19. [19]

    On the effect of the Cosmic Microwave Background in high-redshift (sub-)millimeter observations

    On the Effect of the Cosmic Microwave Background in High-redshift (Sub-)millimeter Observations. , keywords =. doi:10.1088/0004-637X/766/1/13 , archivePrefix =. 1302.0844 , primaryClass =

  20. [20]

    2001, Monthly Notices of the Royal Astronomical Society, 328, 1039, doi: 10.1046/j.1365-8711.2001.04902.x

    The SCUBA Local Universe Galaxy Survey - II. 450- m data: evidence for cold dust in bright IRAS galaxies. , keywords =. doi:10.1046/j.1365-8711.2001.04789.x , archivePrefix =. astro-ph/0106362 , primaryClass =

  21. [21]

    , keywords =

    On the dust temperatures of high-redshift galaxies. , keywords =. doi:10.1093/mnras/stz2134 , archivePrefix =. 1902.10727 , primaryClass =

  22. [22]

    , keywords =

    Little evolution of dust emissivity in bright infrared galaxies from 2 < z < 6. , keywords =. doi:10.1093/mnras/stae405 , archivePrefix =. 2402.05182 , primaryClass =

  23. [23]

    Millimetre photometry of gravitational lens candidates

    The bright extragalactic ALMA redshift survey (BEARS) - II. Millimetre photometry of gravitational lens candidates. , keywords =. doi:10.1093/mnras/stac3771 , archivePrefix =. 2301.02584 , primaryClass =

  24. [24]

    , keywords =

    Realistic multitemperature dust: how well can we constrain the dust properties of high-redshift galaxies?. , keywords =. doi:10.1093/mnras/staf897 , archivePrefix =. 2505.20105 , primaryClass =

  25. [25]

    The Herschel Bright Sources (HerBS): Sample definition and SCUBA-2 observations

    The Herschel Bright Sources (HerBS): sample definition and SCUBA-2 observations. , keywords =. doi:10.1093/mnras/stx2267 , archivePrefix =. 1709.01514 , primaryClass =

  26. [26]

    H-ATLAS: estimating redshifts of Herschel sources from sub-mm fluxes

    H-ATLAS: estimating redshifts of Herschel sources from sub-mm fluxes. , keywords =. doi:10.1093/mnras/stt1369 , archivePrefix =. 1308.5681 , primaryClass =

  27. [27]

    HerMES: The Contribution to the Cosmic Infrared Background from Galaxies Selected by Mass and Redshift

    HerMES: The Contribution to the Cosmic Infrared Background from Galaxies Selected by Mass and Redshift. , keywords =. doi:10.1088/0004-637X/779/1/32 , archivePrefix =. 1304.0446 , primaryClass =

  28. [28]

    Can dust emission be used to map the interstellar medium in high-redshift galaxies? Results from the Herschel Reference Survey

    Can Dust Emission be Used to Estimate the Mass of the Interstellar Medium in Galaxies A Pilot Project with the Herschel Reference Survey. , keywords =. doi:10.1088/0004-637X/761/2/168 , archivePrefix =. 1202.0547 , primaryClass =

  29. [29]

    , keywords =

    The rise and fall of dust in the Universe. , keywords =. doi:10.1093/mnras/stae403 , archivePrefix =. 2402.05181 , primaryClass =

  30. [30]

    , keywords =

    The interstellar medium of quiescent galaxies and its evolution with time. , keywords =. doi:10.1051/0004-6361/202039280 , archivePrefix =. 2101.04700 , primaryClass =

  31. [31]

    , keywords =

    ALMA uncovers the [C II] emission and warm dust continuum in a z = 8.31 Lyman break galaxy. , keywords =. doi:10.1093/mnras/staa509 , archivePrefix =. 2001.02812 , primaryClass =

  32. [32]

    A Deep Sub-millimeter Survey of Lensing Clusters: A New Window on Galaxy Formation and Evolution

    A Deep Sub-millimeter Survey of Lensing Clusters: A New Window on Galaxy Formation and Evolution. , keywords =. doi:10.1086/311017 , archivePrefix =. astro-ph/9708135 , primaryClass =

  33. [33]

    Unveiling Dust-enshrouded Star Formation in the Early Universe: a Sub-mm Survey of the Hubble Deep Field

    High-redshift star formation in the Hubble Deep Field revealed by a submillimetre-wavelength survey. , keywords =. doi:10.1038/28328 , archivePrefix =. astro-ph/9806297 , primaryClass =

  34. [34]

    The Canada-UK Deep Submillimetre Survey: First Submillimetre Images, the Source Counts, and Resolution of the Background

    The Canada-UK Deep Submillimeter Survey: First Submillimeter Images, the Source Counts, and Resolution of the Background. , keywords =. doi:10.1086/307069 , archivePrefix =. astro-ph/9808040 , primaryClass =

  35. [35]

    The Canada-United Kingdom Deep Submillimeter Survey. II. First Identifications, Redshifts, and Implications for Galaxy Evolution. , keywords =. doi:10.1086/307310 , archivePrefix =. astro-ph/9901047 , primaryClass =

  36. [36]

    Determination of the Cosmic Infrared Background from COBE/FIRAS and Planck HFI Observations

    Determination of the Cosmic Infrared Background from COBE/FIRAS and Planck HFI Observations. , keywords =. doi:10.3847/1538-4357/ab14e8 , archivePrefix =. 1904.11556 , primaryClass =

  37. [37]

    Dust-depletion sequences in damped Lyman-{\alpha} absorbers: a unified picture from low-metallicity systems to the Galaxy

    Dust-depletion sequences in damped Lyman- absorbers. A unified picture from low-metallicity systems to the Galaxy. , keywords =. doi:10.1051/0004-6361/201527895 , archivePrefix =. 1608.08621 , primaryClass =

  38. [38]

    METAL: The Metal Evolution, Transport, and Abundance in the Large Magellanic Cloud Hubble Program. IV. Calibration of Dust Depletions versus Abundance Ratios in the Milky Way and Magellanic Clouds and Application to Damped Ly Systems. , keywords =. doi:10.3847/1538-4357/ac7713 , archivePrefix =. 2206.03639 , primaryClass =

  39. [39]

    , keywords =

    Dust, CO, and [C I]: cross-calibration of molecular gas mass tracers in metal-rich galaxies across cosmic time. , keywords =. doi:10.1093/mnras/stac2098 , archivePrefix =. 2208.01622 , primaryClass =

  40. [40]

    The CO-to-H2 Conversion Factor

    The CO-to-H _ 2 Conversion Factor. , keywords =. doi:10.1146/annurev-astro-082812-140944 , archivePrefix =. 1301.3498 , primaryClass =

  41. [41]

    The Evolution of ISM Mass Probed by Dust Emission -- ALMA Observations at z = 0.3 to 2

    The Evolution of Interstellar Medium Mass Probed by Dust Emission: ALMA Observations at z = 0.3-2. , keywords =. doi:10.1088/0004-637X/783/2/84 , archivePrefix =. 1401.2987 , primaryClass =

  42. [42]

    The Extragalactic Background Light and the Gamma-ray Opacity of the Universe

    The extragalactic background light and the gamma-ray opacity of the universe. Astroparticle Physics , keywords =. doi:10.1016/j.astropartphys.2012.09.003 , archivePrefix =. 1209.4661 , primaryClass =

  43. [43]

    The Cosmic Evolution Survey (COSMOS) -- Overview

    The Cosmic Evolution Survey (COSMOS): Overview. , keywords =. doi:10.1086/516585 , archivePrefix =. astro-ph/0612305 , primaryClass =

  44. [44]

    , keywords =

    The East Asian Observatory SCUBA-2 Survey of the COSMOS Field: Unveiling 1147 Bright Sub-millimeter Sources across 2.6 Square Degrees. , keywords =. doi:10.3847/1538-4357/ab23ff , archivePrefix =. 1912.02229 , primaryClass =

  45. [45]

    , keywords =

    S2COSMOS: Evolution of gas mass with redshift using dust emission. , keywords =. doi:10.1093/mnras/staa609 , archivePrefix =. 2003.01727 , primaryClass =

  46. [46]

    The COSMOS2015 galaxy stellar mass function: 13 billion years of stellar mass assembly in 10 snapshots

    The COSMOS2015 galaxy stellar mass function . Thirteen billion years of stellar mass assembly in ten snapshots. , keywords =. doi:10.1051/0004-6361/201730419 , archivePrefix =. 1701.02734 , primaryClass =

  47. [47]

    , keywords =

    COSMOS-Web: An Overview of the JWST Cosmic Origins Survey. , keywords =. doi:10.3847/1538-4357/acc2bc , archivePrefix =. 2211.07865 , primaryClass =

  48. [48]

    arXiv e-prints , keywords =

    COSMOS2025: The COSMOS-Web galaxy catalog of photometry, morphology, redshifts, and physical parameters from JWST, HST, and ground-based imaging. arXiv e-prints , keywords =. doi:10.48550/arXiv.2506.03243 , archivePrefix =. 2506.03243 , primaryClass =

  49. [49]

    arXiv e-prints , keywords =

    COSMOS-Web: The emergence of the Hubble Sequence. arXiv e-prints , keywords =. doi:10.48550/arXiv.2502.03532 , archivePrefix =. 2502.03532 , primaryClass =

  50. [50]

    , keywords =

    A high-resolution investigation of the multiphase ISM in a galaxy during the first two billion years. , keywords =. doi:10.1093/mnras/stab3569 , archivePrefix =. 2112.03936 , primaryClass =

  51. [51]

    Revealing the complex nature of the strong gravitationally lensed system H-ATLAS J090311.6+003906 using ALMA

    Revealing the complex nature of the strong gravitationally lensed system H-ATLAS J090311.6+003906 using ALMA. , keywords =. doi:10.1093/mnras/stv1442 , archivePrefix =. 1503.08720 , primaryClass =

  52. [52]

    , keywords =

    COSMOS-Web: Intrinsically Luminous z 10 Galaxy Candidates Test Early Stellar Mass Assembly. , keywords =. doi:10.3847/1538-4357/ad2075 , archivePrefix =. 2308.10932 , primaryClass =

  53. [53]

    , keywords =

    Hydrodynamical Simulations of the Galaxy Population: Enduring Successes and Outstanding Challenges. , keywords =. doi:10.1146/annurev-astro-041923-043618 , archivePrefix =. 2309.17075 , primaryClass =

  54. [54]

    , year = 1972, month = dec, volume =

    Galactic Bridges and Tails. , year = 1972, month = dec, volume =. doi:10.1086/151823 , adsurl =

  55. [55]

    The Herschel Reference Survey: Dust in Early-Type Galaxies and Across the Hubble Sequence

    The Herschel Reference Survey: Dust in Early-type Galaxies and across the Hubble Sequence. , keywords =. doi:10.1088/0004-637X/748/2/123 , archivePrefix =. 1112.1408 , primaryClass =

  56. [56]

    Planck 2015 results. XIII. Cosmological parameters. , keywords =. doi:10.1051/0004-6361/201525830 , archivePrefix =. 1502.01589 , primaryClass =

  57. [57]

    , keywords =

    An Upper Limit of 10 ^ 6 M _ in Dust from ALMA Observations in 60 Little Red Dots. , keywords =. doi:10.3847/2041-8213/adfa91 , archivePrefix =. 2505.18873 , primaryClass =

  58. [58]

    arXiv e-prints , keywords =

    Low dust mass and high star-formation efficiency at z>12 from deep ALMA observations. arXiv e-prints , keywords =. doi:10.48550/arXiv.2501.19384 , archivePrefix =. 2501.19384 , primaryClass =

  59. [59]

    arXiv e-prints , keywords =

    The Extended Mapping Obscuration to Reionization with ALMA (Ex-MORA) Survey: 5 Source Catalog and Redshift Distribution. arXiv e-prints , keywords =. doi:10.48550/arXiv.2408.14546 , archivePrefix =. 2408.14546 , primaryClass =

  60. [60]

    , keywords =

    Deep ALMA redshift search of a z 12 GLASS-JWST galaxy candidate. , keywords =. doi:10.1093/mnras/stac3723 , archivePrefix =. 2208.13642 , primaryClass =

  61. [61]

    BLAST: Resolving the Cosmic Submillimeter Background

    BLAST: Resolving the Cosmic Submillimeter Background. , keywords =. doi:10.1088/0004-637X/707/2/1729 , archivePrefix =. 0904.1205 , primaryClass =

  62. [62]

    , keywords =

    Measuring star formation in high-z massive galaxies: a mid-infrared to submillimetre study of the GOODS NICMOS Survey sample. , keywords =. doi:10.1111/j.1365-2966.2012.20456.x , archivePrefix =. 1008.4359 , primaryClass =

  63. [63]

    , keywords =

    COSMOS-Web: Stellar mass assembly in relation to dark matter halos across 0.2 < z < 12 of cosmic history. , keywords =. doi:10.1051/0004-6361/202452570 , archivePrefix =. 2410.08290 , primaryClass =

  64. [64]

    Star Formation in the Milky Way and Nearby Galaxies

    Star Formation in the Milky Way and Nearby Galaxies. , keywords =. doi:10.1146/annurev-astro-081811-125610 , archivePrefix =. 1204.3552 , primaryClass =

  65. [65]

    Star Formation in Galaxies Along the Hubble Sequence

    Star Formation in Galaxies Along the Hubble Sequence. , keywords =. doi:10.1146/annurev.astro.36.1.189 , archivePrefix =. astro-ph/9807187 , primaryClass =

  66. [66]

    , keywords =

    The dust emissivity index in infrared-bright galaxies at 1.5 < z < 4.2. , keywords =. doi:10.1093/mnras/staf816 , archivePrefix =. 2505.12141 , primaryClass =

  67. [67]

    z-GAL: A NOEMA spectroscopic redshift survey of bright Herschel galaxies. II. Dust properties. , keywords =. doi:10.1051/0004-6361/202346804 , archivePrefix =. 2307.15747 , primaryClass =

  68. [68]

    , keywords =

    Herschel-ATLAS: rapid evolution of dust in galaxies over the last 5 billion years. , keywords =. doi:10.1111/j.1365-2966.2011.19363.x , archivePrefix =. 1012.5186 , primaryClass =

  69. [69]

    , keywords =

    SCUBA observations of galaxies with metallicity measurements: a new method for determining the relation between submillimetre luminosity and dust mass. , keywords =. doi:10.1046/j.1365-8711.2002.05660.x , archivePrefix =. astro-ph/0204519 , primaryClass =

  70. [70]

    , keywords =

    Measurements of the Dust Properties in z ≃ 1-3 Submillimeter Galaxies with ALMA. , keywords =. doi:10.3847/1538-4357/ac0ae0 , archivePrefix =. 2106.08566 , primaryClass =

  71. [71]

    J., & Gao, L

    A simple model to interpret the ultraviolet, optical and infrared emission from galaxies. , keywords =. doi:10.1111/j.1365-2966.2008.13535.x , archivePrefix =. 0806.1020 , primaryClass =

  72. [72]

    A Herschel [C ii] Galactic plane survey. I. The global distribution of ISM gas components. , keywords =. doi:10.1051/0004-6361/201321188 , archivePrefix =. 1304.7770 , primaryClass =

  73. [73]

    Fermi observations of Cassiopeia and Cepheus: diffuse gamma-ray emission in the outer Galaxy

    Fermi Observations of Cassiopeia and Cepheus: Diffuse Gamma-ray Emission in the Outer Galaxy. , keywords =. doi:10.1088/0004-637X/710/1/133 , archivePrefix =. 0912.3618 , primaryClass =

  74. [74]

    Planck early results. XIX. All-sky temperature and dust optical depth from Planck and IRAS. Constraints on the ``dark gas'' in our Galaxy. , keywords =. doi:10.1051/0004-6361/201116479 , archivePrefix =. 1101.2029 , primaryClass =

  75. [75]

    , keywords =

    Dust continuum, CO, and [C I] 1 - 0 lines: self-consistent H _ 2 mass estimates and the possibility of globally CO-'dark' galaxies at z = 0.35. , keywords =. doi:10.1093/mnras/staa3526 , archivePrefix =. 2111.09067 , primaryClass =

  76. [76]

    Cosmic Star Formation History

    Cosmic Star-Formation History. , keywords =. doi:10.1146/annurev-astro-081811-125615 , archivePrefix =. 1403.0007 , primaryClass =

  77. [77]

    arXiv e-prints , keywords =

    Galaxies and Black Holes in the First Billion Years. arXiv e-prints , keywords =. doi:10.48550/arXiv.2508.16948 , archivePrefix =. 2508.16948 , primaryClass =

  78. [78]

    A Highly Consistent Framework for the Evolution of the Star-Forming "Main Sequence" from z~0-6

    A Highly Consistent Framework for the Evolution of the Star-Forming ``Main Sequence'' from z -0.5ex 0-6. , keywords =. doi:10.1088/0067-0049/214/2/15 , archivePrefix =. 1405.2041 , primaryClass =

  79. [79]

    Gas-regulation of galaxies: the evolution of the cosmic sSFR, the metallicity-mass-SFR relation and the stellar content of haloes

    Gas Regulation of Galaxies: The Evolution of the Cosmic Specific Star Formation Rate, the Metallicity-Mass-Star-formation Rate Relation, and the Stellar Content of Halos. , keywords =. doi:10.1088/0004-637X/772/2/119 , archivePrefix =. 1303.5059 , primaryClass =

  80. [80]

    From haloes to Galaxies - I. The dynamics of the gas regulator model and the implied cosmic sSFR history

    From haloes to Galaxies - I. The dynamics of the gas regulator model and the implied cosmic sSFR history. , keywords =. doi:10.1093/mnras/stu1288 , archivePrefix =. 1402.5964 , primaryClass =

Showing first 80 references.