The NetMob26 Dataset: A High-Resolution Multi-Source View of Public Bus Mobility in Niter\'oi
Pith reviewed 2026-05-21 07:48 UTC · model grok-4.3
The pith
A multi-source dataset from Niterói offers high-resolution insight into bus mobility by linking GPS data with passenger transactions.
A machine-rendered reading of the paper's core claim, the machinery that carries it, and where it could break.
Core claim
The NetMob26 dataset combines four main sources—GPS telemetry from buses, approximately 7.2 million ticketing transactions, auxiliary transit data including routes, stops, and weather, and urban infrastructure and socio-demographic information—to provide a detailed view of both transit supply and passenger demand in Niterói.
What carries the argument
The integration of GPS telemetry, ticketing transactions, and contextual urban data layers that together capture supply-demand dynamics in public bus systems.
If this is right
- Facilitates research on public transportation efficiency and demand forecasting.
- Enables accessibility analysis and studies of service reliability.
- Supports investigation into how weather and other external factors influence urban mobility.
- Provides a foundation for modeling passenger behavior and optimizing transit operations.
Where Pith is reading between the lines
- Future work could extend this dataset to real-time applications for dynamic routing based on observed demand patterns.
- Similar multi-source approaches might be applied to other modes of transport or cities to build comparative mobility studies.
- Researchers could use the data to quantify the impact of specific infrastructure changes on ridership.
Load-bearing premise
That the cleaning and anonymization processes maintained the accuracy and resolution of the original mobility patterns without introducing significant biases or losses.
What would settle it
A direct comparison between the processed dataset and raw operational logs that reveals discrepancies in passenger counts or route coverage would challenge the dataset's claimed reliability.
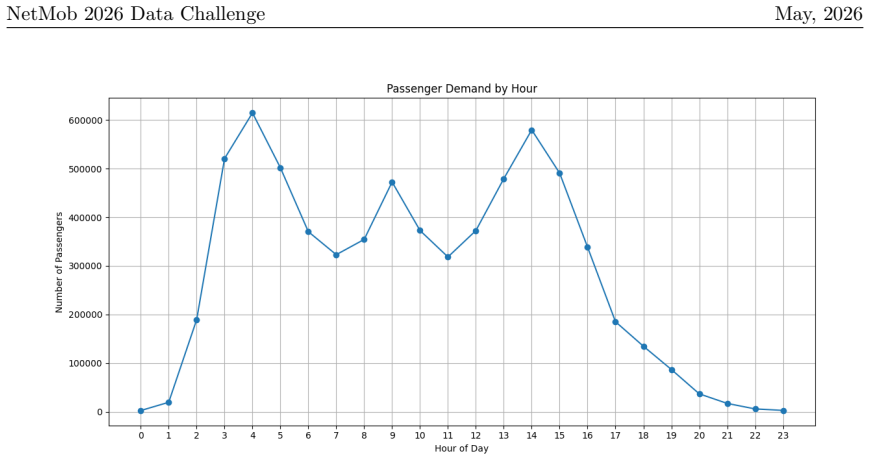
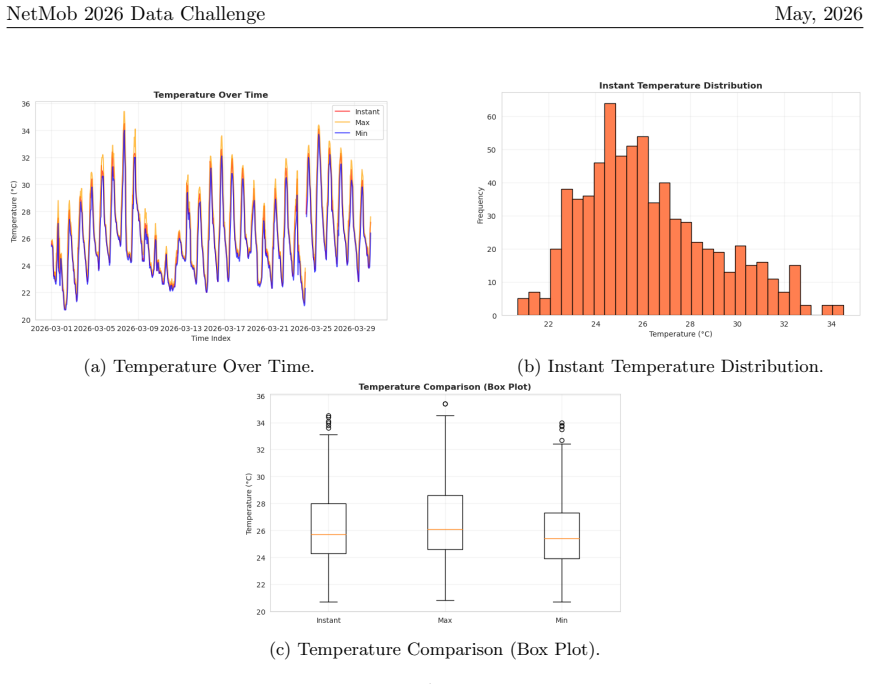
Figures


read the original abstract
The NetMob Data Challenge releases a comprehensive public transportation dataset from Niter\'oi, addressing the lack of high-quality mobility and passenger demand data. Based on operational records from March 2026, the dataset combines four main sources: GPS telemetry from buses, approximately 7.2 million ticketing transactions, auxiliary transit data (routes, stops, and weather), and urban infrastructure and socio-demographic information. Together, these sources provide a detailed view of both transit supply and passenger demand. The data were preprocessed, cleaned, and anonymized to preserve privacy and improve reliability, including the removal of operational inconsistencies and anonymization of passenger identifiers. Access is restricted to challenge participants who accept the Terms and Conditions and sign an NDA. The paper describes the data collection and preprocessing pipeline, dataset organization, and mobility patterns observed in the system. The dataset supports research on topics such as public transportation efficiency, demand forecasting, accessibility analysis, service reliability, and the influence of external factors like weather on urban mobility.
Editorial analysis
A structured set of objections, weighed in public.
Referee Report
Summary. The paper presents the NetMob26 dataset for the NetMob Data Challenge, integrating four sources from Niterói public buses in March 2026: GPS telemetry, ~7.2 million ticketing transactions, auxiliary data (routes, stops, weather), and urban/socio-demographic information. It describes the collection, preprocessing (including removal of operational inconsistencies), cleaning, anonymization of passenger identifiers, dataset organization, and observed mobility patterns. The dataset is positioned to support research on transit efficiency, demand forecasting, accessibility, reliability, and weather effects, with access restricted to challenge participants under NDA.
Significance. A well-documented multi-source dataset combining supply (GPS, routes) and demand (ticketing) signals with contextual layers would be a useful addition to urban mobility research, enabling integrated analyses of public transit that are often limited by single-source data. The scale (~7.2M transactions) and high-resolution elements could support studies on OD patterns, temporal dynamics, and external influences if fidelity is demonstrated.
major comments (1)
- [Preprocessing and Cleaning] Preprocessing and Cleaning section (as described in the abstract and pipeline overview): the manuscript outlines procedural steps for removing operational inconsistencies and anonymizing identifiers but supplies no quantitative post-cleaning validation, such as the fraction of records discarded, before/after statistics on key metrics (e.g., trip counts, temporal distributions), error rates, or external validation against independent counts. This omission directly affects the central claim that the processed data deliver a 'reliable high-resolution view' of supply and demand without material bias or resolution loss.
minor comments (1)
- [Dataset Organization] Dataset organization subsection: the description of file structures and variable definitions could benefit from an explicit table listing all fields, their sources, and any derived variables to improve usability for challenge participants.
Simulated Author's Rebuttal
We thank the referee for the constructive comments on the manuscript. We address the major comment point by point below.
read point-by-point responses
-
Referee: [Preprocessing and Cleaning] Preprocessing and Cleaning section (as described in the abstract and pipeline overview): the manuscript outlines procedural steps for removing operational inconsistencies and anonymizing identifiers but supplies no quantitative post-cleaning validation, such as the fraction of records discarded, before/after statistics on key metrics (e.g., trip counts, temporal distributions), error rates, or external validation against independent counts. This omission directly affects the central claim that the processed data deliver a 'reliable high-resolution view' of supply and demand without material bias or resolution loss.
Authors: We agree that the manuscript would benefit from quantitative post-cleaning validation to more robustly support the claim of a reliable high-resolution view. In the revised version we will add explicit statistics to the Preprocessing and Cleaning section, including the fraction of records discarded at each stage, before-and-after comparisons of key metrics such as total trip counts and temporal distributions, and estimates of error rates derived from internal consistency checks across the GPS and ticketing sources. Regarding external validation against independent counts, no such independent passenger or trip count data are available to the authors for the March 2026 period; we will therefore add an explicit discussion of this limitation while explaining how cross-validation between the four integrated sources helps limit bias and resolution loss. revision: yes
Circularity Check
No circularity: pure data-release description with no derivations
full rationale
The manuscript is a dataset release paper that describes four data sources, a preprocessing pipeline, anonymization steps, and observed mobility patterns. It contains no equations, fitted parameters, predictions, or derivation chains of any kind. Claims about data utility after cleaning are presented as procedural descriptions rather than reductions to prior fitted values or self-citations. The work is self-contained against external benchmarks and exhibits none of the enumerated circularity patterns.
Axiom & Free-Parameter Ledger
Reference graph
Works this paper leans on
-
[1]
Zack Aemmer, Andisheh Ranjbari, and Don MacKenzie. Measurement and classification of transit delays using gtfs-rt data.Public Transport, 14:263–285, 2022. [7]
work page 2022
-
[2]
Gianni Barlacchi, Marco De Nadai, Roberto Larcher, Antonio Casella, Cristiana Chitic, Gio- vanni Torrisi, Fabrizio Antonelli, Alessandro Vespignani, Alex Pentland, and Bruno Lepri. A multi-source dataset of urban life in the city of milan and the province of trentino.Scientific Data, 2(1):150055, 2015
work page 2015
-
[3]
Bittencourt and Mariana Giannotti
Tain´ a A. Bittencourt and Mariana Giannotti. Evaluating the accessibility and availability of public services to reduce inequalities in everyday mobility.Transportation Research Part A: Policy and Practice, 177:103833, 2023
work page 2023
-
[4]
Vincent D. Blondel, Markus Esch, Connie Chan, Fabrice Clerot, Pierre Deville, Etienne Huens, Fr´ ed´ eric Morlot, Zbigniew Smoreda, and Cezary Ziemlicki. Data for development: The d4d challenge on mobile phone data, 2013
work page 2013
-
[5]
Alexandre Chasse, Anne J. Kouam, Aline C. Viana, Razvan Stanica, Wellington V. Lobato, Geymerson Ramos, Geoffrey Deperle, Abdelmounaim Bouroudi, Suzanne Bussod, and Fer- nando Molano. The netmob25 dataset: A high-resolution multi-layered view of individual mobility in greater paris region, 2025
work page 2025
-
[6]
Yves-Alexandre de Montjoye, Zbigniew Smoreda, Romain Trinquart, Cezary Ziemlicki, and Vincent D. Blondel. D4d-senegal: The second mobile phone data for development challenge, 2014
work page 2014
-
[7]
The death and life of great italian cities: A mobile phone data perspective
Marco De Nadai, Jacopo Staiano, Roberto Larcher, Nicu Sebe, Daniele Quercia, and Bruno Lepri. The death and life of great italian cities: A mobile phone data perspective. InProceedings of the 25th International Conference on World Wide Web, pages 413–423, 2016
work page 2016
-
[8]
Yunhan Du, Takaaki Aoki, and Naoya Fujiwara. A review of human mobility: Linking data, models, and real-world applications.Journal of Computational Social Science, 8(90), 2025. [1]. 2https://netmob.org/www26/files/Challenge_NDA.pdf 3https://github.com/lprm-ufes/Netmob2026 24 NetMob 2026 Data Challenge May, 2026
work page 2025
-
[9]
Cat´ alogo de turismo ativo em niter´ oi
Fatima Priscila Morela Edra et al. Cat´ alogo de turismo ativo em niter´ oi. Techni- cal report, Faculdade de Turismo e Hotelaria, Universidade Federal Fluminense (UFF), Niter´ oi, Brazil, November 2022. Available at:https://drive.google.com/file/d/1ok35_ aS77ISEMmTC2oHHNxDn6_f9145A/view. Accessed: 2026-04-25
work page 2022
-
[10]
Foursquare. Future cities challenge, 2018.https://location.foursquare.com/resources/ blog/leadership/how-location-technology-can-drive-urban-innovation/
work page 2018
-
[11]
Censo demogr´ afico 2022: Resultados
Instituto Brasileiro de Geografia e Estat´ ıstica (IBGE). Censo demogr´ afico 2022: Resultados. https://censo2022.ibge.gov.br/, 2022. Acesso em: 26 abr. 2026
work page 2022
-
[12]
International Telecommunication Union. Big data for development: Preventing the spread of epidemics.https://www.itu.int/en/ITU-D/Emergency-Telecommunications/Pages/ BigData/default.aspx
-
[13]
Ghazaleh Khodabandelou, Vincent Gauthier, Marco Fiore, and Mounim A. El-Yacoubi. Esti- mation of static and dynamic urban populations with mobile network metadata.IEEE Trans- actions on Mobile Computing, 18(9):2034–2047, 2019
work page 2034
-
[14]
Steffen Knoblauch, Julian Heidecke, Antˆ onio A. de A. Rocha, Paulo Filemon Paolucci Pi- menta, Marcel Reinmuth, Sven Lautenbach, Oliver J. Brady, Thomas Jaenisch, Bernd Resch, Filip Biljecki, Joacim Rockl¨ ov, Annelies Wilder-Smith, Till B¨ arnighausen, and Alexander Zipf. Modeling intraday aedes-human exposure dynamics enhances dengue risk prediction.Sc...
work page 2025
-
[15]
Lopes, Gerlando Gramaglia, Davide Bacciu, and Humberto T
Pedro P. Lopes, Gerlando Gramaglia, Davide Bacciu, and Humberto T. Marques-Neto. To- wards forecasting bus arrival thorough a model based on gnn+lstm using gtfs and real-time data. In4th International Conference on AI-ML Systems (AIMLSystems 2024). ACM, 2024. [8-11]
work page 2024
-
[16]
Xiaolei Ma, Congcong Liu, Huimin Wen, Yunpeng Wang, and Yao-Jan Wu. Understanding commuting patterns using transit smart card data.Journal of Transport Geography, 58:135– 145, 2017
work page 2017
-
[17]
Orlando E. Mart´ ınez-Durive, Sachit Mishra, Cezary Ziemlicki, Stefania Rubrichi, Zbigniew Smoreda, and Marco Fiore. The netmob23 dataset: A high-resolution multi-region service- level mobile data traffic cartography, 2023
work page 2023
-
[18]
Esteban Moro, Dan Calacci, Xiaowen Dong, and Alex Pentland. Mobility patterns are as- sociated with experienced income segregation in large us cities.Nature Communications, 12(1):4633, 2021
work page 2021
-
[19]
M. M. Nyhan, I. Kloog, R. Britter, C. Ratti, and P. Koutrakis. Quantifying population exposure to air pollution using individual mobility patterns inferred from mobile phone data. Journal of Exposure Science & Environmental Epidemiology, 29(2):238–247, 2019
work page 2019
-
[20]
Hub SIGeo – sistema de gest˜ ao da geoinforma¸ c˜ ao de niter´ oi
Prefeitura Municipal de Niter´ oi. Hub SIGeo – sistema de gest˜ ao da geoinforma¸ c˜ ao de niter´ oi. https://www.sigeo.niteroi.rj.gov.br/, 2024. Secretaria de Ciˆ encia, Tecnologia e In- ova¸ c˜ ao. Accessed: 2026-05-08. 25 NetMob 2026 Data Challenge May, 2026
work page 2024
-
[21]
Bilhete ´Unico Niter´ oi: Regras de Funcionamento e Integra¸ c˜ ao, 2024
Rio Bilhete ´Unico. Bilhete ´Unico Niter´ oi: Regras de Funcionamento e Integra¸ c˜ ao, 2024. Ac- cessed: 2026-05-08
work page 2024
-
[22]
Data for refugees: The d4r challenge on mobility of syrian refugees in turkey, 2018
Albert Ali Salah, Alex Pentland, Bruno Lepri, Emmanuel Letouze, Patrick Vinck, Yves- Alexandre de Montjoye, Xiaowen Dong, and Ozge Dagdelen. Data for refugees: The d4r challenge on mobility of syrian refugees in turkey, 2018
work page 2018
-
[23]
Manon Seppecher, Ludovic Leclercq, Angelo Furno, Delphine Lejri, and Thamara Vieira da Rocha. Estimation of urban zonal speed dynamics from user-activity-dependent positioning data and regional paths.Transportation Research Part C: Emerging Technologies, 129:103183, 2021
work page 2021
-
[24]
I˜ naki Ucar, Marco Gramaglia, Marco Fiore, Zbigniew Smoreda, and Esteban Moro. News or social media? socio-economic divide of mobile service consumption.Journal of the Royal Society Interface, 18(185):20210350, 2021
work page 2021
-
[25]
Aggregated mobility and density data for the netmob 2024 data challenge, 2024
World Bank. Aggregated mobility and density data for the netmob 2024 data challenge, 2024. https://datacatalog.worldbank.org/search/dataset/0066094/aggregated_mobility_ and_density_data_for_the_netmob_2024_data_challenge
-
[26]
Takahiro Yabe, Nicholas K. W. Jones, P. Suresh C. Rao, Marta C. Gonzalez, and Satish V. Ukkusuri. Mobile phone location data for disasters: A review from natural hazards and epi- demics.Computers, Environment and Urban Systems, 94:101777, 2022. 26 NetMob 2026 Data Challenge May, 2026 A Point of Interest and Urban infrastructure dataset detail TheNetMob26N...
work page 2022
discussion (0)
Sign in with ORCID, Apple, or X to comment. Anyone can read and Pith papers without signing in.