The TNG50-SKIRT Atlas: Multi-wavelength nonparametric galaxy morphology
Pith reviewed 2026-05-21 03:42 UTC · model grok-4.3
The pith
Nonparametric morphology indicators of galaxies change significantly with wavelength, more so for disc-dominated systems than bulge-dominated ones.
A machine-rendered reading of the paper's core claim, the machinery that carries it, and where it could break.
Core claim
Nonparametric morphological indicators calculated with StatMorph on the TNG50-SKIRT Atlas images change significantly with wavelength, with the dependence stronger for disc-dominated than for bulge-dominated galaxies; the wavelength trends are consistent with SINGS survey measurements, and dust attenuation produces only modest changes across the full sample though larger effects occur in specific galaxies.
What carries the argument
The TNG50-SKIRT Atlas of synthetic UV-to-NIR images for 1154 mass-selected galaxies at z=0, processed through the StatMorph code to obtain Gini, M20, concentration, and asymmetry parameters.
Load-bearing premise
The TNG50 simulation combined with SKIRT radiative transfer produces sufficiently realistic multi-wavelength images that the measured wavelength trends can be compared directly to observations such as the SINGS survey.
What would settle it
A measurement of the same nonparametric indicators in a complete sample of local galaxies observed in multiple bands that finds no significant wavelength dependence for disc-dominated systems would falsify the central claim.
Figures


read the original abstract
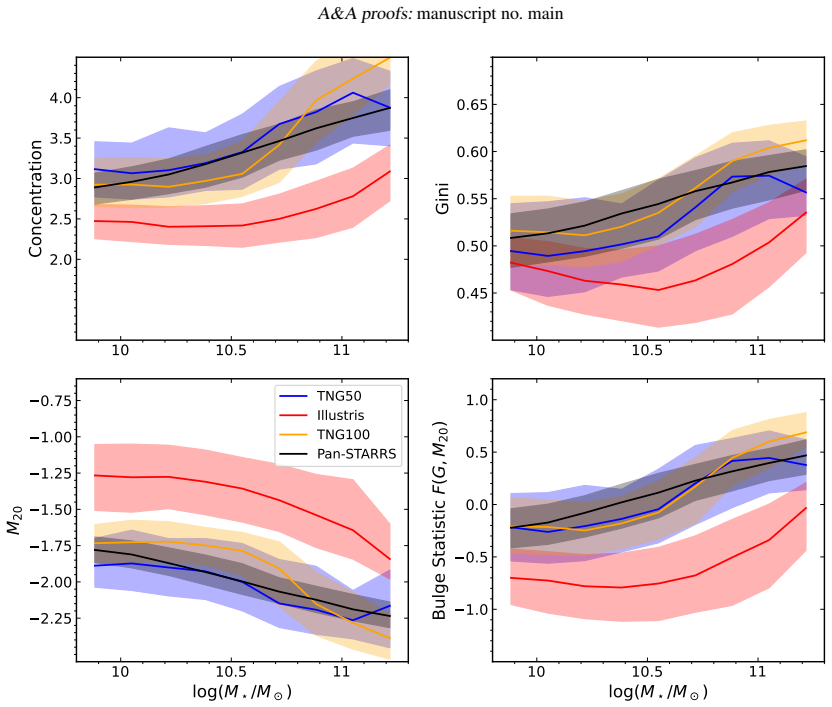
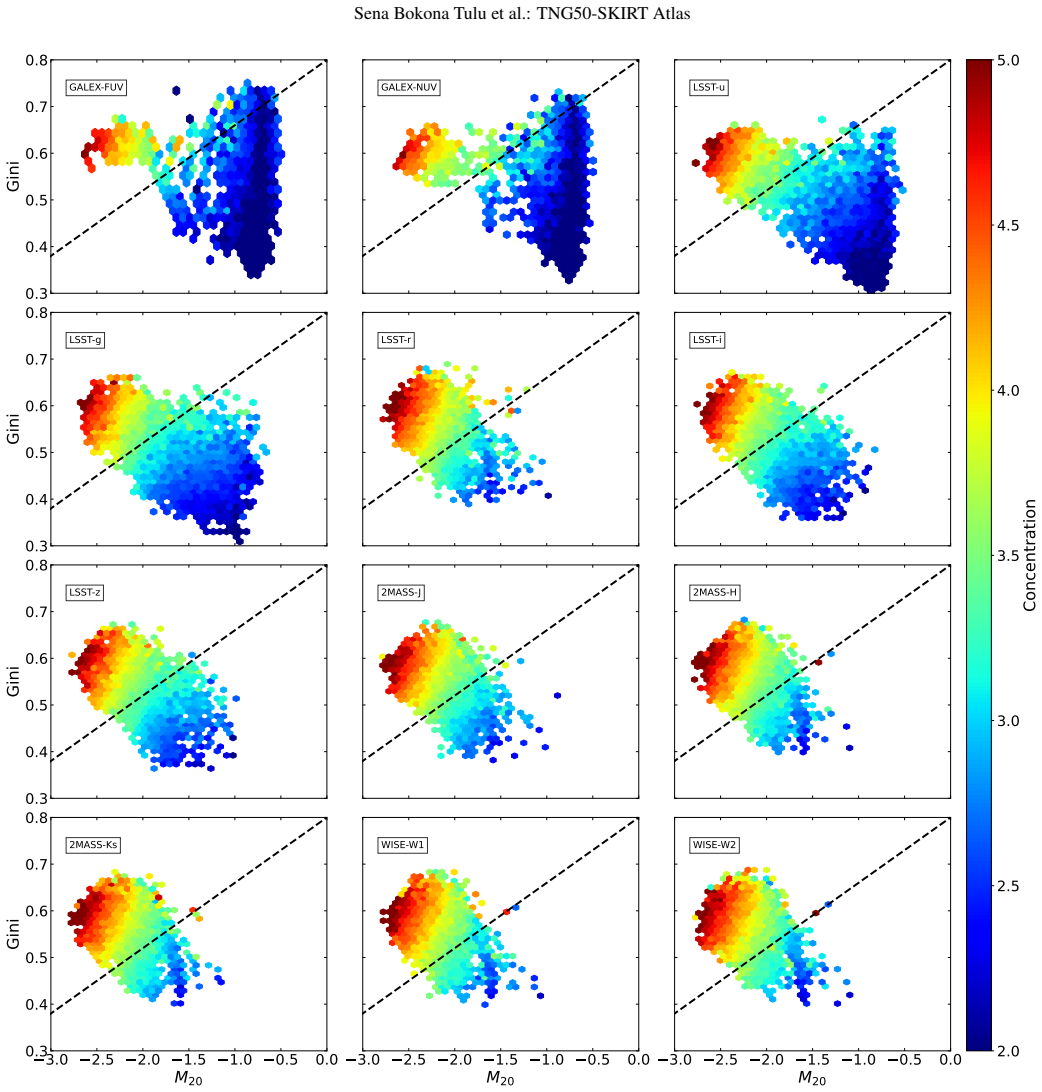
Context: Galaxy morphology is a fundamental property to describe galaxy evolution. However, the observed morphology of a particular galaxy may depend on the observed wavelength. Aims: Our aim is to investigate the wavelength dependence and the effect of dust attenuation on nonparametric morphology indicators. Methods: We use the TNG50-SKIRT Atlas, an atlas of synthetic UV to near-infrared (NIR) broadband images for a complete stellar-mass-selected sample of 1154 galaxies extracted from the TNG50 cosmological simulation at $z = 0$. For each image, we calculate four nonparametric morphology indicators using the StatMorph code. Results: We find that the known correlations between the stellar mass and the morphological parameters measured in the optical, together with the Gini-$M_{20}$, concentration-Gini, and concentration-$M_{20}$ planes, are fully consistent with observational data. However, nonparametric morphological indicators change significantly with wavelength and that this wavelength dependence is stronger for disc-dominated than for bulge-dominated galaxies. The wavelength dependence of the morphology of our simulated TNG50 galaxies is consistent with measurements of local galaxies from the SINGS survey. We demonstrate that the effect of dust attenuation on nonparametric morphology indicators is modest across the full galaxy population but can be significant for individual galaxies.
Editorial analysis
A structured set of objections, weighed in public.
Referee Report
Summary. The manuscript presents the TNG50-SKIRT Atlas of synthetic UV-to-NIR broadband images for a stellar-mass-selected sample of 1154 z=0 galaxies from the TNG50 simulation, post-processed with SKIRT radiative transfer. Nonparametric morphology indicators (Gini, M20, concentration, asymmetry) are measured with StatMorph. The central results are that these indicators vary significantly with wavelength, with stronger dependence in disc-dominated than bulge-dominated systems; the trends match SINGS observations; stellar-mass correlations and morphological planes are consistent with data; and dust attenuation effects are modest on average but can be large for individual galaxies.
Significance. If the simulated images faithfully reproduce the physical drivers of wavelength-dependent morphology, the atlas supplies a controlled benchmark for interpreting multi-wavelength observations and for developing corrections applicable to high-redshift surveys. The direct SINGS comparison and the separation into disc- versus bulge-dominated subsamples add practical value for the field.
major comments (3)
- [§4] §4 (Results, SINGS comparison): the statement that wavelength trends are 'consistent with measurements of local galaxies from the SINGS survey' is presented without a quantitative overlap metric (e.g., KS statistic on the distributions of ΔGini or Δasymmetry between UV and NIR, or median shift per morphological type). This leaves open whether the reported stronger disc dependence could arise from TNG50+SKIRT dust geometry rather than being a general physical result.
- [§3.2] §3.2 (Dust modeling): the sub-grid dust assumptions and clumpiness prescription in SKIRT are not compared directly to the observed attenuation maps or scale heights in SINGS galaxies. Because the central claim requires that the simulated attenuation produces realistic wavelength trends, especially the disc-versus-bulge difference, a resolution-convergence test or attenuation-map statistic would be needed to rule out simulation-specific artifacts.
- [§4.1] §4.1 (Morphological classification): the assignment of galaxies to 'disc-dominated' versus 'bulge-dominated' is not stated to be performed at a fixed wavelength or with a wavelength-independent criterion. Since the paper itself shows that concentration, Gini, and asymmetry all change with wavelength, the classification step must be shown to be robust before the differential wavelength dependence can be interpreted as physical.
minor comments (3)
- [Table 1] Table 1: the mass and size cuts used to define the 1154-galaxy sample should be listed explicitly so that the completeness relative to the full TNG50 z=0 volume is clear.
- [Figure 7] Figure 7 (dust effect examples): the selection of the 'individual galaxies' shown to have large dust-induced changes is not described; a quantitative threshold (e.g., ΔC > 0.5) would make the claim reproducible.
- [Methods] Notation: the definition of the asymmetry parameter in the StatMorph implementation should be restated or referenced to avoid ambiguity with other common asymmetry indices.
Simulated Author's Rebuttal
We thank the referee for their thorough and constructive review, which has identified several areas where the manuscript can be clarified and strengthened. We address each major comment below and indicate the revisions we will make.
read point-by-point responses
-
Referee: [§4] §4 (Results, SINGS comparison): the statement that wavelength trends are 'consistent with measurements of local galaxies from the SINGS survey' is presented without a quantitative overlap metric (e.g., KS statistic on the distributions of ΔGini or Δasymmetry between UV and NIR, or median shift per morphological type). This leaves open whether the reported stronger disc dependence could arise from TNG50+SKIRT dust geometry rather than being a general physical result.
Authors: We agree that adding quantitative metrics will make the consistency claim more robust. In the revised manuscript we will include Kolmogorov-Smirnov tests on the distributions of wavelength-induced changes (ΔGini, ΔM20, ΔC, ΔA) between the TNG50-SKIRT sample and the SINGS galaxies, together with median shifts separated by disc- versus bulge-dominated subsamples. These statistics will be presented in a new table or figure panel in §4. revision: yes
-
Referee: [§3.2] §3.2 (Dust modeling): the sub-grid dust assumptions and clumpiness prescription in SKIRT are not compared directly to the observed attenuation maps or scale heights in SINGS galaxies. Because the central claim requires that the simulated attenuation produces realistic wavelength trends, especially the disc-versus-bulge difference, a resolution-convergence test or attenuation-map statistic would be needed to rule out simulation-specific artifacts.
Authors: Direct pixel-by-pixel comparison to SINGS attenuation maps is not feasible because such maps are not publicly available for the full SINGS sample in a format matching our radiative-transfer outputs. We will instead add a concise discussion in §3.2 that places our adopted dust-to-metal ratio and clumpiness parameters in the context of observed dust scale heights and attenuation curves from the literature (including SINGS). We will also report a resolution-convergence test performed on a 10 % subsample of galaxies, confirming that the wavelength trends in morphology indicators remain stable when the dust grid is refined. revision: partial
-
Referee: [§4.1] §4.1 (Morphological classification): the assignment of galaxies to 'disc-dominated' versus 'bulge-dominated' is not stated to be performed at a fixed wavelength or with a wavelength-independent criterion. Since the paper itself shows that concentration, Gini, and asymmetry all change with wavelength, the classification step must be shown to be robust before the differential wavelength dependence can be interpreted as physical.
Authors: The disc- versus bulge-dominated classification is performed using intrinsic, wavelength-independent quantities from the TNG50 simulation: the stellar-mass ratio within 2 effective radii and the kinematic decomposition (circular velocity versus velocity dispersion). These quantities are derived from the 3D particle data and do not rely on any projected image. We will explicitly state this in §4.1 and add a short robustness check showing that re-classifying a subset of galaxies using optical images yields the same disc/bulge assignment for >95 % of objects. revision: yes
Circularity Check
No circularity: direct measurements from TNG50-SKIRT images compared to external observations
full rationale
The paper generates synthetic multi-wavelength images using the TNG50 cosmological simulation and SKIRT radiative transfer for a mass-selected galaxy sample, then applies the external StatMorph code to compute nonparametric morphology indicators (Gini, M20, concentration, asymmetry). These computed values are compared directly to independent observational datasets including SINGS for wavelength trends and other surveys for mass-morphology correlations. No parameters are fitted to the reported trends and then relabeled as predictions, no self-citations supply load-bearing uniqueness theorems or ansatzes, and the central results (wavelength dependence stronger in discs, modest dust effects) emerge as outputs of the forward simulation pipeline rather than being defined into the inputs. The derivation remains self-contained against external benchmarks.
Axiom & Free-Parameter Ledger
axioms (2)
- domain assumption TNG50 simulation at z=0 produces a representative sample of galaxies whose stellar mass and morphology distributions match the real universe sufficiently for morphology studies.
- domain assumption StatMorph nonparametric indicators are robust when applied to synthetic images that include dust attenuation.
Lean theorems connected to this paper
-
IndisputableMonolith/Foundation/RealityFromDistinction.leanreality_from_one_distinction unclear?
unclearRelation between the paper passage and the cited Recognition theorem.
We use the TNG50-SKIRT Atlas... calculate four nonparametric morphology indicators using the StatMorph code... wavelength dependence... effect of dust attenuation
-
IndisputableMonolith/Cost/FunctionalEquation.leanwashburn_uniqueness_aczel unclear?
unclearRelation between the paper passage and the cited Recognition theorem.
nonparametric morphological indicators change significantly with wavelength... consistent with measurements of local galaxies from the SINGS survey
What do these tags mean?
- matches
- The paper's claim is directly supported by a theorem in the formal canon.
- supports
- The theorem supports part of the paper's argument, but the paper may add assumptions or extra steps.
- extends
- The paper goes beyond the formal theorem; the theorem is a base layer rather than the whole result.
- uses
- The paper appears to rely on the theorem as machinery.
- contradicts
- The paper's claim conflicts with a theorem or certificate in the canon.
- unclear
- Pith found a possible connection, but the passage is too broad, indirect, or ambiguous to say the theorem truly supports the claim.
Reference graph
Works this paper leans on
-
[1]
G., van den Bergh, S., & Nair, P
Abraham, R. G., van den Bergh, S., & Nair, P. 2003, ApJ, 588, 218
work page 2003
- [2]
-
[3]
2025, Research Notes of the American Astronomical Society, 9, 328
Baes, M., Camps, P., Gebek, A., et al. 2025, Research Notes of the American Astronomical Society, 9, 328
work page 2025
-
[4]
Baes, M., Davies, J. I., Dejonghe, H., et al. 2003, MNRAS, 343, 1081
work page 2003
-
[5]
Baes, M., Nersesian, A., Casasola, V ., et al. 2020, A&A, 641, A119
work page 2020
-
[6]
Baes, M., Verstappen, J., De Looze, I., et al. 2011, ApJS, 196, 22
work page 2011
-
[7]
K., Glazebrook, K., Brinkmann, J., et al
Baldry, I. K., Glazebrook, K., Brinkmann, J., et al. 2004, ApJ, 600, 681
work page 2004
-
[8]
J., Calzetti, D., Engelbracht, C
Bendo, G. J., Calzetti, D., Engelbracht, C. W., et al. 2007, MNRAS, 380, 1313
work page 2007
-
[9]
Bignone, L. A., Pedrosa, S. E., Trayford, J. W., Tissera, P. B., & Pellizza, L. J. 2020, MNRAS, 491, 3624
work page 2020
-
[10]
Bignone, L. A., Tissera, P. B., Sillero, E., et al. 2017, MNRAS, 465, 1106
work page 2017
-
[11]
Blanton, M. R. & Moustakas, J. 2009, ARA&A, 47, 159
work page 2009
-
[12]
Bottrell, C., Torrey, P., Simard, L., & Ellison, S. L. 2017, MNRAS, 467, 2879
work page 2017
-
[13]
J., Sheth, K., Athanassoula, E., et al
Buta, R. J., Sheth, K., Athanassoula, E., et al. 2015, ApJS, 217, 32
work page 2015
- [14]
- [15]
- [16]
- [17]
-
[18]
Camps, P., Behrens, C., Baes, M., Kapoor, A. U., & Grand, R. 2021, ApJ, 916, 39
work page 2021
-
[19]
Camps, P., Kapoor, A. U., Trcka, A., et al. 2022, MNRAS, 512, 2728 Article number, page 12 of 13 Sena Bokona Tulu et al.: TNG50-SKIRT Atlas
work page 2022
-
[20]
Chambers, K. & Pan-STARRS Team. 2018, in American Astronomical Society Meeting Abstracts, V ol. 231, American Astronomical Society Meeting Ab- stracts #231, 102.01
work page 2018
-
[21]
Conselice, C. J. 2003, ApJS, 147, 1
work page 2003
-
[22]
Conselice, C. J. 2014, ARA&A, 52, 291
work page 2014
-
[23]
Conselice, C. J., Yang, C., & Bluck, A. F. L. 2009, MNRAS, 394, 1956 Davé, R., Anglés-Alcázar, D., Narayanan, D., et al. 2019, MNRAS, 486, 2827
work page 2009
-
[24]
Data Release 1 of the Dark Energy Spectroscopic Instrument
Davis, T. A., Gensior, J., Bureau, M., et al. 2022, MNRAS, 512, 1522 de Vaucouleurs, G. 1959, Handbuch der Physik, 53, 275 DESI Collaboration, Abdul Karim, M., Adame, A. G., et al. 2025, arXiv e-prints, arXiv:2503.14745
work page internal anchor Pith review Pith/arXiv arXiv 2022
-
[25]
Dickinson, H., Fortson, L., Lintott, C., et al. 2018, ApJ, 853, 194
work page 2018
- [26]
-
[27]
Drigga, E., Koulouridis, E., Pouliasis, E., et al. 2025, A&A, 697, A234
work page 2025
-
[28]
Driver, S. P., Andrews, S. K., da Cunha, E., et al. 2018, MNRAS, 475, 2891
work page 2018
-
[29]
Driver, S. P., Robotham, A. S. G., Tompkins, S., et al. 2026, MNRAS, submitted
work page 2026
-
[30]
Exploring galaxy morphology across cosmic time through Sersic fits
Dubois, Y ., Beckmann, R., Bournaud, F., et al. 2021, A&A, 651, A109 Euclid Collaboration: Kova ˇci´c, I., Baes, M., Nersesian, A., et al. 2025, A&A, 695, A284 Euclid Collaboration: Mellier, Y ., Abdurro’uf, Acevedo Barroso, J. A., et al. 2025, A&A, 697, A1 Euclid Collaboration: Quilley, L., Damjanov, I., de Lapparent, V ., et al. 2026, A&A, in press (arX...
-
[31]
Freeman, P. E., Izbicki, R., Lee, A. B., et al. 2013, MNRAS, 434, 282
work page 2013
-
[32]
Gadotti, D. A. 2009, MNRAS, 393, 1531
work page 2009
-
[33]
Gadotti, D. A., Baes, M., & Falony, S. 2010, MNRAS, 403, 2053
work page 2010
-
[34]
Gebek, A., Baes, M., Diemer, B., et al. 2023, MNRAS, 521, 5645
work page 2023
-
[35]
Getachew-Woreta, T., Povi´c, M., Masegosa, J., et al. 2022, MNRAS, 514, 607
work page 2022
-
[36]
2025, Galaxies, 13, 84 Gómez, P
Getachew-Woreta, T., Povi´c, M., Perea, J., et al. 2025, Galaxies, 13, 84 Gómez, P. L., Nichol, R. C., Miller, C. J., et al. 2003, ApJ, 584, 210
work page 2025
-
[37]
2025, arXiv e-prints, arXiv:2504.18042
Gong, J.-Y ., Lin, W., Tang, L., & Lan, Y . 2025, arXiv e-prints, arXiv:2504.18042
-
[38]
Goulding, A. D. & Alexander, D. M. 2009, MNRAS, 398, 1165
work page 2009
-
[39]
Graham, A. W. & Worley, C. C. 2008, MNRAS, 388, 1708 Guzmán-Ortega, A., Rodriguez-Gomez, V ., Snyder, G. F., Chamberlain, K., &
work page 2008
- [40]
-
[41]
Holwerda, B. W., Pirzkal, N., de Blok, W. J. G., et al. 2011, MNRAS, 416, 2401
work page 2011
-
[42]
2009, A&A, 497, 743 Ivezi´c, Ž., Kahn, S
Huertas-Company, M., Tasca, L., Rouan, D., et al. 2009, A&A, 497, 743 Ivezi´c, Ž., Kahn, S. M., Tyson, J. A., et al. 2019, ApJ, 873, 111
work page 2009
- [43]
-
[44]
U., Camps, P., Baes, M., et al
Kapoor, A. U., Camps, P., Baes, M., et al. 2021, MNRAS, 506, 5703
work page 2021
-
[45]
Kauffmann, G., Heckman, T. M., White, S. D. M., et al. 2003, MNRAS, 341, 54
work page 2003
-
[46]
Kelvin, L. S., Driver, S. P., Robotham, A. S. G., et al. 2012, MNRAS, 421, 1007
work page 2012
-
[47]
C., Armus, L., Bendo, G., et al
Kennicutt, Jr., R. C., Armus, L., Bendo, G., et al. 2003, PASP, 115, 928
work page 2003
-
[48]
Lauwers, A., Baes, M., Camps, P., & Vander Meulen, B. 2024, A&A, 689, A13
work page 2024
-
[49]
Leste, O. K., Willis, J. P., Canning, R. E. A., & Rennehan, D. 2024, MNRAS, 533, 2927
work page 2024
-
[50]
Lotz, J. M., Davis, M., Faber, S. M., et al. 2008, ApJ, 672, 177
work page 2008
-
[51]
Lotz, J. M., Jonsson, P., Cox, T. J., & Primack, J. R. 2010, MNRAS, 404, 575
work page 2010
-
[52]
M., Madau, P., Giavalisco, M., Primack, J., & Ferguson, H
Lotz, J. M., Madau, P., Giavalisco, M., Primack, J., & Ferguson, H. C. 2006, ApJ, 636, 592
work page 2006
- [53]
-
[54]
Lovell, C. C., Roper, W. J., Vijayan, A. P., et al. 2025, The Open Journal of Astrophysics, 8, 152
work page 2025
-
[55]
Marinacci, F., V ogelsberger, M., Pakmor, R., et al. 2018, MNRAS, 480, 5113
work page 2018
- [56]
-
[57]
2023, ApJS, 269, 3 Muñoz-Mateos, J
Moustakas, J., Lang, D., Dey, A., et al. 2023, ApJS, 269, 3 Muñoz-Mateos, J. C., Gil de Paz, A., Zamorano, J., et al. 2009, ApJ, 703, 1569
work page 2023
-
[58]
P., Pillepich, A., Springel, V ., et al
Naiman, J. P., Pillepich, A., Springel, V ., et al. 2018, MNRAS, 477, 1206
work page 2018
-
[59]
Narayanan, D., Turk, M. J., Robitaille, T., et al. 2021, ApJS, 252, 12
work page 2021
-
[60]
Nedkova, K. V ., Rafelski, M., Teplitz, H. I., et al. 2024, ApJ, 970, 188
work page 2024
-
[61]
Nelson, D., Pillepich, A., Springel, V ., et al. 2019, MNRAS, 490, 3234
work page 2019
-
[62]
Nelson, D., Pillepich, A., Springel, V ., et al. 2018, MNRAS, 475, 624
work page 2018
-
[63]
Nersesian, A., Zibetti, S., D’Eugenio, F., & Baes, M. 2023, A&A, 673, A63
work page 2023
-
[64]
Peest, C., Camps, P., Stalevski, M., Baes, M., & Siebenmorgen, R. 2017, A&A, 601, A92
work page 2017
-
[65]
Pillepich, A., Nelson, D., Hernquist, L., et al. 2018, MNRAS, 475, 648
work page 2018
-
[66]
Pillepich, A., Nelson, D., Springel, V ., et al. 2019, MNRAS, 490, 3196
work page 2019
- [67]
- [68]
-
[69]
2021, Astronomy and Computing, 37, 100492
Reza, M. 2021, Astronomy and Computing, 37, 100492
work page 2021
-
[70]
Rodriguez-Gomez, V ., Snyder, G. F., Lotz, J. M., et al. 2019, MNRAS, 483, 4140
work page 2019
-
[71]
2026, The Journal of Open Source Software, 11, 9436
Roper, W., Lovell, C., Vijayan, A., et al. 2026, The Journal of Open Source Software, 11, 9436
work page 2026
- [72]
- [73]
- [74]
-
[75]
Snyder, G. F., Torrey, P., Lotz, J. M., et al. 2015, MNRAS, 454, 1886
work page 2015
-
[76]
Wide-Field InfrarRed Survey Telescope-Astrophysics Focused Telescope Assets WFIRST-AFTA 2015 Report
Spergel, D., Gehrels, N., Baltay, C., et al. 2015, arXiv e-prints, arXiv:1503.03757
work page internal anchor Pith review Pith/arXiv arXiv 2015
-
[77]
Springel, V ., Pakmor, R., Pillepich, A., et al. 2018, MNRAS, 475, 676
work page 2018
- [78]
-
[79]
Taylor-Mager, V . A., Conselice, C. J., Windhorst, R. A., & Jansen, R. A. 2007, ApJ, 659, 162
work page 2007
-
[80]
Thorp, M. D., Bluck, A. F. L., Ellison, S. L., et al. 2021, MNRAS, 507, 886
work page 2021
discussion (0)
Sign in with ORCID, Apple, or X to comment. Anyone can read and Pith papers without signing in.