Multivariate Financial Forecasting using the Chronos Time Series Foundation Models
Pith reviewed 2026-05-22 02:15 UTC · model grok-4.3
The pith
Multivariate inputs from related series improve forecast accuracy over univariate baselines in the Chronos time-series foundation model.
A machine-rendered reading of the paper's core claim, the machinery that carries it, and where it could break.
Core claim
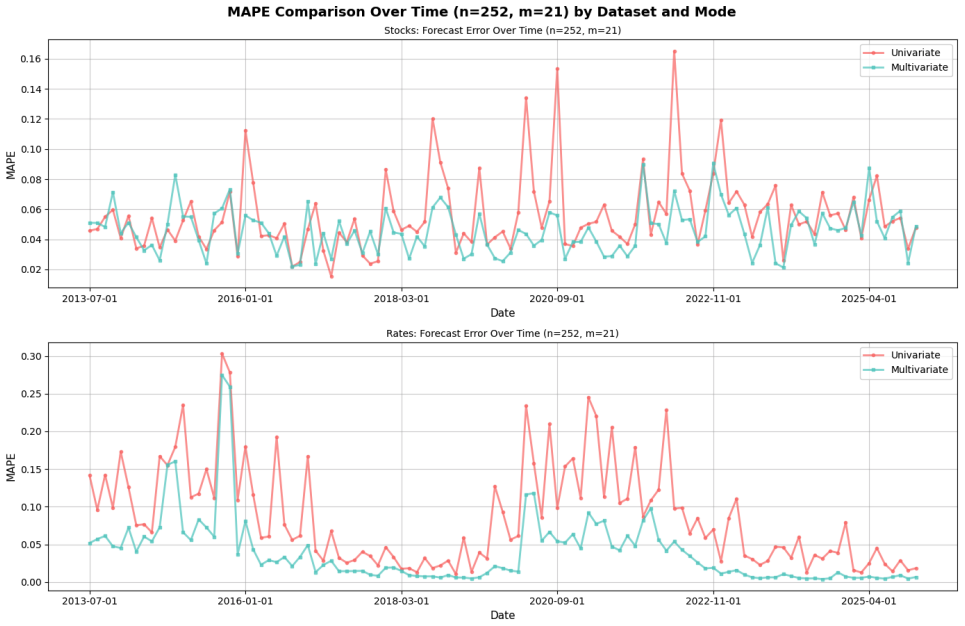
Multivariate forecasts with Chronos-2 consistently outperform univariate forecasts across the equity panel, the interest-rate panel, and the full set of series. Gains appear in every individual series examined, error dispersion declines under multivariate inputs, and the largest improvements occur for interest rates. Accuracy degrades when equities and rates are modeled jointly, indicating that cross-market mixing introduces noise that harms performance.
What carries the argument
Rolling monthly forecast evaluation of Chronos-2 under multivariate versus univariate input regimes, with varying window lengths and horizons, measured by RMSE and MAPE.
Load-bearing premise
The rolling monthly evaluation protocol with fixed window lengths and horizons produces unbiased out-of-sample comparisons between multivariate and univariate regimes without look-ahead bias or post-hoc selection of favorable periods.
What would settle it
A new test set or replication period in which univariate forecasts achieve lower or equal RMSE and MAPE than multivariate forecasts under identical rolling-window conditions would falsify the central claim.
Figures


read the original abstract
Using Chronos-2, an open-source time-series foundation model, we evaluate pretrained time-series models for economic and financial forecasting with an emphasis on whether multivariate (MV) inputs improve accuracy relative to univariate (UV) baselines. The study covers two panels -- the Magnificent-7 equities and U.S. Treasury interest rates -- as well as a combined panel, using rolling monthly evaluations from 2000--2025. We vary input window lengths and forecast horizons and report RMSE and MAPE. Across datasets, MV forecasts consistently outperform UV forecasts, with especially strong gains for interest rates and meaningful improvements for equities. Series-level comparisons show MV improvements in every case, and error dispersion is generally lower under MV inputs. We also provide parameter-heatmap and time-series visualizations. However, mixing time series across equity and interest rate markets reduces forecast accuracy, indicating that adding noisy context degrades model performance. Overall, the results indicate that foundation models can leverage cross-series information to improve forecast accuracy in finance, and that the benefits are strongest when related series are modeled jointly under disciplined rolling protocols. Other than using an open-source foundation model, this paper also showcases how AI may be used for financial research.
Editorial analysis
A structured set of objections, weighed in public.
Referee Report
Summary. The paper evaluates the Chronos-2 time-series foundation model for financial forecasting on two panels (Magnificent-7 equities and U.S. Treasury rates) plus a combined panel. Using rolling monthly out-of-sample evaluations from 2000–2025 with varying input windows and horizons, it reports that multivariate (MV) inputs produce lower RMSE and MAPE than univariate (UV) baselines, with larger gains for rates, uniformly positive series-level improvements, and lower error dispersion under MV; mixing equities and rates degrades accuracy.
Significance. If the MV advantage survives rigorous causal validation and statistical testing, the work would demonstrate that open-source time-series foundation models can usefully exploit cross-series dependencies in financial data under disciplined rolling protocols. This would be a concrete, reproducible contribution to multivariate forecasting practice, especially given the use of an open-source model and the explicit comparison of related versus unrelated series.
major comments (3)
- [Evaluation Protocol] The rolling monthly evaluation protocol (described in the methods and results sections) does not explicitly confirm that normalization, scaling, or context construction for each forecast origin uses only information up to that origin. If any statistic is computed over the full series or if MV and UV input pipelines differ in their use of future data, the reported RMSE/MAPE gains could be artifacts rather than evidence of genuine cross-series information transfer.
- [Results] Across all reported tables and figures, only point estimates of RMSE and MAPE are given; no standard errors, confidence intervals, Diebold-Mariano tests, or other statistical significance assessments accompany the MV–UV differences. Without these, the central claim of “consistent outperformance” rests on untested numerical differences whose economic or statistical reliability cannot be judged.
- [Methodology] The manuscript provides insufficient detail on how Chronos-2 is prompted or adapted for the multivariate versus univariate regimes (e.g., tokenization of multiple series, context length handling, or any fine-tuning). This makes it impossible to verify that the input-construction rules are identical and fair across the two settings.
minor comments (2)
- [Abstract] The abstract states that “mixing time series across equity and interest rate markets reduces forecast accuracy,” yet the corresponding table or figure is not referenced; adding an explicit cross-reference would improve readability.
- [Results] Parameter-heatmap and time-series visualizations are mentioned but their placement (main text vs. appendix) and exact content are unclear; a brief description or caption reference would help.
Simulated Author's Rebuttal
We thank the referee for the thoughtful and constructive comments. We address each major comment below and describe the revisions we intend to implement.
read point-by-point responses
-
Referee: [Evaluation Protocol] The rolling monthly evaluation protocol (described in the methods and results sections) does not explicitly confirm that normalization, scaling, or context construction for each forecast origin uses only information up to that origin. If any statistic is computed over the full series or if MV and UV input pipelines differ in their use of future data, the reported RMSE/MAPE gains could be artifacts rather than evidence of genuine cross-series information transfer.
Authors: We appreciate the referee's emphasis on preventing data leakage. In our implementation, all normalization and scaling statistics are computed exclusively from data available up to each forecast origin within the rolling window. We will revise the methods section to state this explicitly for both univariate and multivariate pipelines and to confirm that the only difference between the two regimes is the inclusion of additional series. revision: yes
-
Referee: [Results] Across all reported tables and figures, only point estimates of RMSE and MAPE are given; no standard errors, confidence intervals, Diebold-Mariano tests, or other statistical significance assessments accompany the MV–UV differences. Without these, the central claim of “consistent outperformance” rests on untested numerical differences whose economic or statistical reliability cannot be judged.
Authors: We agree that statistical assessment of the differences would strengthen the results. In the revision we will report standard errors derived from the rolling windows and add Diebold-Mariano tests comparing MV and UV forecasts for each series and for the panel aggregates. revision: yes
-
Referee: [Methodology] The manuscript provides insufficient detail on how Chronos-2 is prompted or adapted for the multivariate versus univariate regimes (e.g., tokenization of multiple series, context length handling, or any fine-tuning). This makes it impossible to verify that the input-construction rules are identical and fair across the two settings.
Authors: We concur that greater methodological transparency is required. The revised manuscript will contain an expanded subsection detailing the exact prompting format, the tokenization and concatenation procedure for multivariate inputs, context-length management, and the fact that the pretrained Chronos-2 model is used without fine-tuning. This will demonstrate that the MV and UV pipelines differ solely in the presence of cross-series context. revision: yes
Circularity Check
No circularity: purely empirical rolling-window evaluation
full rationale
The paper conducts an empirical comparison of multivariate versus univariate forecasts generated by the pretrained Chronos-2 foundation model on equity and interest-rate panels. It reports RMSE and MAPE under a fixed rolling monthly protocol from 2000–2025 with no internal parameter fitting, no self-referential definitions, and no derivation that reduces the accuracy numbers to quantities defined by the paper’s own inputs. The central claim rests on out-of-sample forecast errors computed from historical data; these errors are not forced by construction from any fitted quantity or self-citation chain inside the manuscript.
Axiom & Free-Parameter Ledger
axioms (1)
- domain assumption Rolling monthly windows with fixed input lengths and horizons produce unbiased out-of-sample forecast comparisons.
Reference graph
Works this paper leans on
-
[1]
Conceptualization:Students are provided an initial outline
-
[2]
Initial Coding:Students prepare a Google Colab notebook with assistance from Gemini
-
[3]
Refinement:The professor updates the notebook, modularizing the code and updating logic, also utilizing Gemini for coding assistance
-
[4]
Data Preparation:Results are finalized in Colab, consisting of printed dataframes, plots, and textual outputs
-
[5]
Environment Setup:A LATEX shell for the paper is established in OpenAI Prism (https://openai. com/prism/)
-
[6]
Outlining:The structure is set up with blank sections: Introduction, Methodology, Results, and Concluding Discussion (including relevant subsec- tions)
-
[7]
These are then integrated into the Results section
Table Conversion:Printed dataframes from Co- lab are fed into Gemini with prompts to convert them into LATEX tables. These are then integrated into the Results section
-
[8]
Visuals:Figures are added to the project folder, and the corresponding LATEX code for figure inclu- sion is written
-
[9]
Drafting Results:Prism is tasked with drafting text for the Results section to explain the tables and figures. Notably, the underlying model (GPT-5.2) inferred results directly from the tables to generate the write-up
-
[10]
Gemini generates the Methodology section, which is then moved to the draft
Methodology:The Chronos-1 and Chronos-2 pa- pers, along with experiment descriptions from the Colab notebook, are uploaded to Gemini. Gemini generates the Methodology section, which is then moved to the draft
-
[11]
Specific Subsections:A subsection on data leak- age is added; the reasoning is provided by the au- thors while the LLM handles the prose
-
[12]
Literature Review (Part 1):A BibTEX file from Zotero is uploaded. Prism is prompted to generate a literature review based on the citations as they relate to the Methodology and Results
-
[13]
Prism generates the Introduction and updates the literature review for context
Introduction and Literature Review (Part 2): Previously published related papers are uploaded. Prism generates the Introduction and updates the literature review for context
-
[14]
Conclusions:Using the full paper as context, Prism generates the Concluding Discussion
-
[15]
Abstract:Prism is prompted to synthesize an abstract for the completed draft
-
[16]
Human Editing:Final human-led editing passes are performed to improve narrative flow, reformat the LATEX layout, and ensure technical accuracy. Self Review and Revision Process Gemini was also utilized to generate a mock referee report (review.pdf). This report informed a response document (responses.md) created with the following prompt: “Please read the...
discussion (0)
Sign in with ORCID, Apple, or X to comment. Anyone can read and Pith papers without signing in.