Gaia FGK Benchmark Stars: Impact of Spectral Resolution on Stellar Abundances
Pith reviewed 2026-06-29 20:22 UTC · model grok-4.3
The pith
Abundances for Fe I, Ni I, Ti I, and Si I remain consistent even at spectral resolution 28,000.
A machine-rendered reading of the paper's core claim, the machinery that carries it, and where it could break.
Core claim
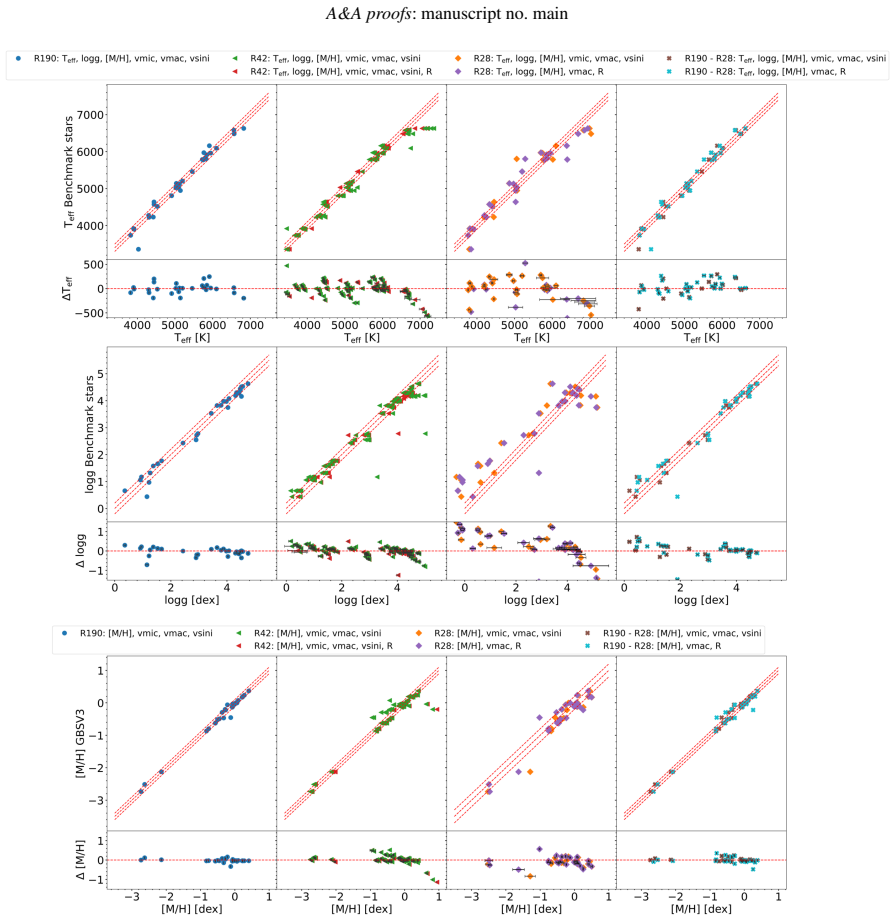
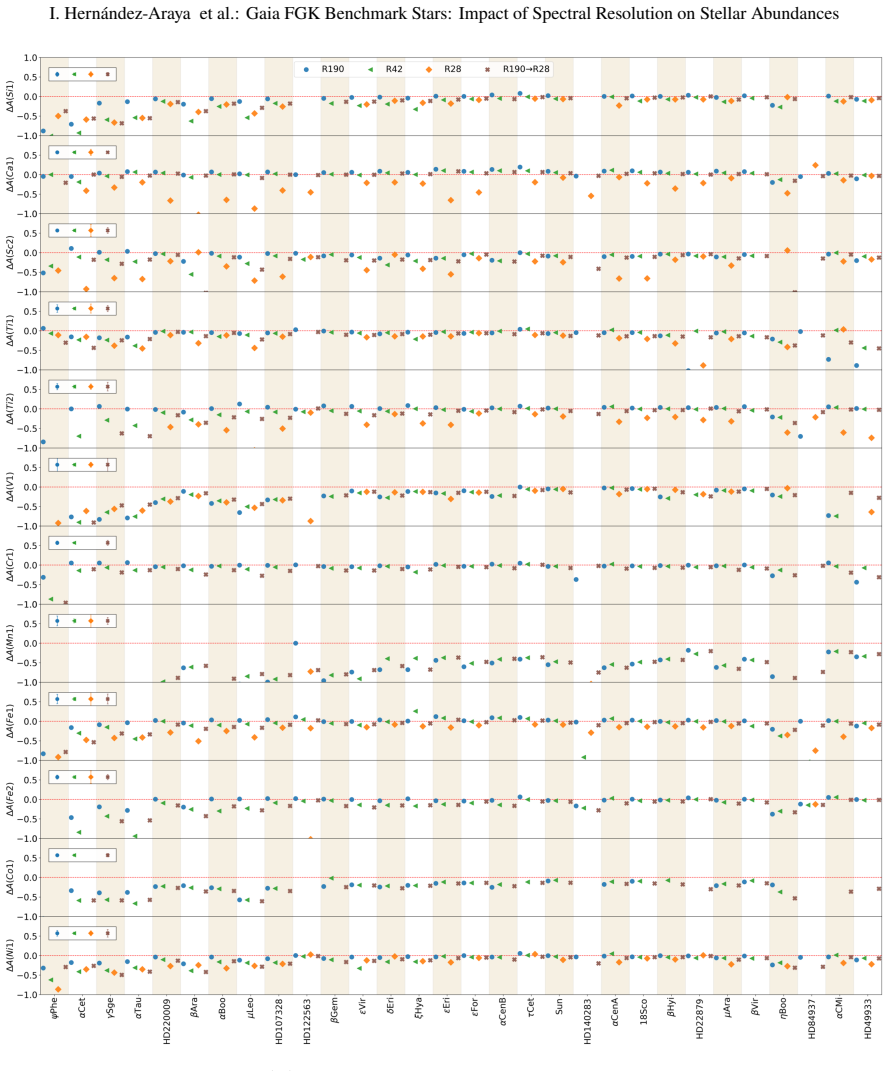
Using both synthetic spectrum fitting and equivalent width methods on Gaia benchmark stars, the abundances derived for Fe I, Ni I, Ti I, and Si I display less scatter when comparing results from R~28000 spectra to those from R~190000, showing that the highest resolution is not always essential for these chemical abundance measurements.
What carries the argument
Side-by-side comparison of parameters and abundances from spectra at R190, R42, R28, and R190 degraded to R28, using synthetic fitting and equivalent width methods together with a line list chosen to work for stars of different metallicities.
If this is right
- Abundances of Fe I, Ni I, Ti I, and Si I can be measured with comparable consistency at R=28000 as at higher resolutions.
- Discrepancies in derived log g stem mainly from limited wavelength coverage rather than lower resolving power.
- Synthetic fitting and equivalent width methods give similar abundances for many elements, especially at the highest resolution.
- Elements such as Ti II and Sc II show greater discrepancies at lower resolution due to blending and hyperfine structure effects.
- Large surveys can obtain reliable results for key elements without always requiring the highest available spectral resolution.
Where Pith is reading between the lines
- Instrument designs for future surveys could emphasize wavelength regions containing the robust lines of Fe, Ni, Ti, and Si to minimize coverage-related biases.
- The same resolution tests applied to non-benchmark field stars would check whether the low-scatter result extends beyond the reference sample.
- Moderate-resolution instruments might enable larger samples or wider sky coverage in Milky Way chemical-evolution studies while preserving accuracy for the stable elements.
- Extending the validated line list to additional species could identify more elements that tolerate reduced resolution.
Load-bearing premise
The Gaia benchmark stars supply reference parameters that are accurate and obtained independently of spectroscopy, and the chosen line list works without introducing metallicity-dependent biases in the resolution tests.
What would settle it
If independent R=28000 spectra yield substantially larger scatter in Fe I, Ni I, Ti I, and Si I abundances than R=190000 spectra for the same stars, the claim that lower resolution suffices would not hold.
Figures




read the original abstract
In the era of large Milky Way spectroscopic surveys, calibrating and standardizing stellar parameters and abundance measurements is crucial. The Gaia benchmark stars (GBS) are key references points characterized by well-defined parameters derived from fundamental relations independent of spectroscopy. We analyze 30 GBS with spectra data at three different resolutions. Our goal is to evaluate the impact of spectral resolution on the measurements of the stellar parameters and chemical abundances. We also present a line selection suitable for both metal-poor and metal-rich stars. We used R~190000 (R190), R~42000 (R42), R~28 000 (R28), and R190 degraded to R28 (R190-R28) spectral data to measure abundances with synthetic fitting and equivalent widths (EW) methods, testing the needed resolution to obtain consistent results. Our comparative analysis between R28 and R190-R28 shows that gaps in wavelength coverage can lead to discrepancies in the derived stellar parameters, particularly log g. These effects are not primarily driven by resolution, but rather by the limited spectral coverage and line availability. We find overall similar abundance, emphasizing the importance of line selection for spectroscopic studies. However, some elements (e.g, Ti II, Sc II) show larger discrepancies, possibly due to blending that becomes more pronounced as resolution decreases or is HFS-sensitive. Our comparative analysis shows that the abundances for Fe I, Ni I, Ti I, and Si I present less scatter across all resolutions, including R28. Our findings indicate that for some elements, synthetic fitting and the EW method give similar abundances, especially at the highest resolution. However, we also find that the highest resolution is not always essential for chemical abundance measurements. Our results provide practical guidelines for upcoming large surveys to reconstruct the chemical history of the Milky Way.
Editorial analysis
A structured set of objections, weighed in public.
Referee Report
Summary. The manuscript examines the impact of spectral resolution on stellar parameters and chemical abundances for 30 Gaia FGK benchmark stars, comparing measurements from spectra at R≈190000 (R190), R≈42000 (R42), R≈28000 (R28), and R190 degraded to R28. Using both synthetic spectrum fitting and equivalent-width methods with a line list selected for applicability across metallicities, the authors report that wavelength coverage gaps (rather than resolution per se) drive discrepancies in log g, that abundances for Fe I, Ni I, Ti I, and Si I exhibit comparatively low scatter across all resolutions, and that the highest resolution is not always required for reliable results on these species, while Ti II and Sc II show larger discrepancies attributable to blending or hyperfine structure.
Significance. If the differential comparisons hold, the work supplies empirical guidance for the design and analysis of large Milky Way spectroscopic surveys, demonstrating that for several key neutral species lower-resolution data can yield consistent abundances when line selection is appropriate. The controlled degradation of the high-resolution spectra to isolate resolution from coverage effects, together with the use of benchmark stars whose parameters are derived independently of spectroscopy, strengthens the internal-consistency test and makes the modest claim of differential robustness falsifiable.
major comments (2)
- [Results (comparative analysis between R28 and R190-R28)] The central claim that Fe I, Ni I, Ti I, and Si I abundances 'present less scatter across all resolutions, including R28' is load-bearing for the practical-guideline conclusion, yet the abstract and available description provide only a qualitative statement. A table or figure quantifying the scatter (standard deviation or inter-quartile range per element and resolution) is required to allow readers to judge whether the reduction is statistically meaningful or merely comparable to the typical abundance uncertainty.
- [Methods (line selection)] The paper states that the chosen line list is 'suitable for both metal-poor and metal-rich stars' and that this selection underpins the consistency across resolutions. However, no explicit test (e.g., abundance residuals versus [Fe/H] at fixed resolution, or a comparison of line-by-line scatter for the two metallicity regimes) is described; without such a check the assumption that the list introduces no metallicity-dependent bias in the resolution comparison remains unverified.
minor comments (2)
- [Abstract] Notation for resolutions is inconsistent in the abstract (R~190000 (R190), R~28 000 (R28)); uniform use of either the approximate symbol or the parenthetical label throughout the text and figures would improve readability.
- [Abstract / Results] The abstract mentions that 'synthetic fitting and the EW method give similar abundances, especially at the highest resolution,' but does not indicate whether this agreement was quantified (e.g., mean difference and rms per element). Adding a brief statement or supplementary table would clarify the method-comparison result.
Simulated Author's Rebuttal
We thank the referee for their positive assessment and constructive major comments. We address each point below and indicate the revisions we will make.
read point-by-point responses
-
Referee: [Results (comparative analysis between R28 and R190-R28)] The central claim that Fe I, Ni I, Ti I, and Si I abundances 'present less scatter across all resolutions, including R28' is load-bearing for the practical-guideline conclusion, yet the abstract and available description provide only a qualitative statement. A table or figure quantifying the scatter (standard deviation or inter-quartile range per element and resolution) is required to allow readers to judge whether the reduction is statistically meaningful or merely comparable to the typical abundance uncertainty.
Authors: We agree with the referee that a quantitative presentation of the scatter is necessary to support the claim. In the revised manuscript, we will add a new table that reports the standard deviation of the derived abundances for Fe I, Ni I, Ti I, and Si I at each resolution (R190, R42, R28, R190-R28). This will enable readers to assess the statistical significance of the reduced scatter. revision: yes
-
Referee: [Methods (line selection)] The paper states that the chosen line list is 'suitable for both metal-poor and metal-rich stars' and that this selection underpins the consistency across resolutions. However, no explicit test (e.g., abundance residuals versus [Fe/H] at fixed resolution, or a comparison of line-by-line scatter for the two metallicity regimes) is described; without such a check the assumption that the list introduces no metallicity-dependent bias in the resolution comparison remains unverified.
Authors: The line list was selected based on criteria from prior studies to ensure applicability across metallicities, but we recognize that an internal consistency check would be valuable. We will add a supplementary figure showing the abundance residuals as a function of [Fe/H] for the selected lines at fixed resolution, along with a brief discussion of line-by-line scatter in metal-poor versus metal-rich regimes. revision: yes
Circularity Check
No significant circularity; empirical comparison against independent benchmarks
full rationale
The paper performs an empirical differential analysis of stellar parameters and abundances derived from the same Gaia benchmark stars (whose Teff, log g, and [Fe/H] are fixed from fundamental relations independent of spectroscopy) observed or degraded at multiple resolutions. No equations, fitted parameters, or self-citations are invoked to derive the target abundances; the central result is simply the observed scatter in [X/H] values across R190, R42, R28, and R190-R28 data sets using a fixed line list. This is a direct consistency test with no reduction of outputs to inputs by construction.
Axiom & Free-Parameter Ledger
axioms (1)
- domain assumption Gaia benchmark stars have parameters derived from fundamental relations independent of spectroscopy
Reference graph
Works this paper leans on
-
[1]
K., Agüeros, M
Adelman-McCarthy, J. K., Agüeros, M. A., Allam, S. S., et al. 2007, ApJS, 172, 634
2007
-
[2]
G., Santos, N
Adibekyan, V., Sousa, S. G., Santos, N. C., et al. 2020, A&A, 642, A182 Allende Prieto, C., Majewski, S. R., Schiavon, R., et al. 2008, Astronomische Nachrichten, 329, 1018
2020
-
[3]
M., Liljegren, S., & Nissen, P
Amarsi, A. M., Liljegren, S., & Nissen, P. E. 2022, A&A, 668, A68
2022
-
[4]
2023, A&A, 678, A158
Anders, F., Gispert, P., Ratcliffe, B., et al. 2023, A&A, 678, A158
2023
-
[5]
2019, MNRAS, 486, 2075
Blanco-Cuaresma, S. 2019, MNRAS, 486, 2075
2019
-
[6]
2024, in 8th TESS/15th Kepler Asteroseismic Science Consortium Workshop, 29
Boulet, T. 2024, in 8th TESS/15th Kepler Asteroseismic Science Consortium Workshop, 29
2024
-
[7]
2018, MNRAS, 478, 4513
Buder, S., Asplund, M., Duong, L., et al. 2018, MNRAS, 478, 4513
2018
-
[8]
E., et al
Buder, S., Kos, J., Wang, X. E., et al. 2025, PASA, 42, e051
2025
-
[9]
2021, MNRAS, 506, 150
Buder, S., Sharma, S., Kos, J., et al. 2021, MNRAS, 506, 150
2021
-
[10]
2019, MNRAS, 490, 1821
Casamiquela, L., Blanco-Cuaresma, S., Carrera, R., et al. 2019, MNRAS, 490, 1821
2019
-
[11]
The DESI Experiment Part I: Science,Targeting, and Survey Design
Casamiquela, L., Soubiran, C., Jofré, P., et al. 2026, A&A, 705, A167 de Jong, R. 2011, The Messenger, 145, 14 de Jong, R. S., Agertz, O., Berbel, A. A., et al. 2019, The Messenger, 175, 3 de Jong, R. S., Bellido-Tirado, O., Chiappini, C., et al. 2012, in Society of Photo-Optical Instrumentation Engineers (SPIE) Conference Series, Vol. 8446, Ground-based ...
work page internal anchor Pith review Pith/arXiv arXiv 2026
-
[12]
2021, ApJ, 913, 62
Fukue, K., Matsunaga, N., Kondo, S., et al. 2021, ApJ, 913, 62
2021
-
[13]
C., et al
Gilmore, G., Randich, S., Worley, C. C., et al. 2022, A&A, 666, A120 González Hernández, J. I., Pepe, F., Molaro, P., & Santos, N. C. 2018, in Hand- book of Exoplanets, ed. H. J. Deeg & J. A. Belmonte, 157
2022
-
[14]
Gray, D. F. 2008, The Observation and Analysis of Stellar Photospheres
2008
-
[15]
Grevesse, N., Asplund, M., & Sauval, A. J. 2007, Space Sci. Rev., 130, 105
2007
-
[16]
2008, A&A, 486, 951
Gustafsson, B., Edvardsson, B., Eriksson, K., et al. 2008, A&A, 486, 951
2008
-
[17]
2016, A&A, 592, A70 Hegedűs, V., Mészáros, S., Jofré, P., et al
Hawkins, K., Jofré, P., Heiter, U., et al. 2016, A&A, 592, A70 Hegedűs, V., Mészáros, S., Jofré, P., et al. 2023, A&A, 670, A107
2016
-
[18]
2015, A&A, 582, A49
Heiter, U., Jofré, P., Gustafsson, B., et al. 2015, A&A, 582, A49
2015
-
[19]
2021, A&A, 645, A106
Heiter, U., Lind, K., Bergemann, M., et al. 2021, A&A, 645, A106
2021
-
[20]
C., et al
Hourihane, A., François, P., Worley, C. C., et al. 2023, A&A, 676, A129
2023
-
[21]
C., Dalton, G
Jin, S., Trager, S. C., Dalton, G. B., et al. 2024, MNRAS, 530, 2688 Jofré, P. 2021, ApJ, 920, 23 Jofré, P., Heiter, U., & Soubiran, C. 2019, ARA&A, 57, 571 Jofré, P., Heiter, U., Soubiran, C., et al. 2015, A&A, 582, A81 Jofré, P., Heiter, U., Soubiran, C., et al. 2014, A&A, 564, A133 Jofré,P.,Heiter,U.,TucciMaia,M.,etal.2018,ResearchNotesoftheAmerican As...
2024
-
[22]
SDSS-V: Pioneering Panoptic Spectroscopy
Kollmeier, J. A., Zasowski, G., Rix, H.-W., et al. 2017, arXiv e-prints, arXiv:1711.03234
work page internal anchor Pith review Pith/arXiv arXiv 2017
- [23]
-
[24]
Ksoll, V. F., Storm, N., Bergemann, M., et al. 2026, arXiv e-prints, arXiv:2602.18340 Lomaeva,M.,Jönsson,H.,Ryde,N.,Schultheis,M.,&Thorsbro,B.2019,A&A, 625, A141 Mészáros, S., Jofré, P., Johnson, J. A., et al. 2025, AJ, 170, 96 Mikolaitis, Š., de Laverny, P., Recio-Blanco, A., et al. 2017, A&A, 600, A22
work page internal anchor Pith review Pith/arXiv arXiv 2026
-
[25]
R., Sharma, S., et al
Nandakumar, G., Hayden, M. R., Sharma, S., et al. 2022, MNRAS, 513, 232
2022
-
[26]
Nissen, P. E. 2015, A&A, 579, A52
2015
-
[27]
2021, MNRAS, 503, 3216
Palla, M. 2021, MNRAS, 503, 3216
2021
-
[28]
K., Cargile, P
Pass, E. K., Cargile, P. A., DiTomasso, V., et al. 2025, ApJS, 281, 27
2025
-
[29]
2021, A&A, 645, A96 Pepe,F.A.,Cristiani,S.,ReboloLopez,R.,etal.2010,inSocietyofPhoto-Optical Instrumentation Engineers (SPIE) Conference Series, Vol
Pepe, F., Cristiani, S., Rebolo, R., et al. 2021, A&A, 645, A96 Pepe,F.A.,Cristiani,S.,ReboloLopez,R.,etal.2010,inSocietyofPhoto-Optical Instrumentation Engineers (SPIE) Conference Series, Vol. 7735, Ground- based and Airborne Instrumentation for Astronomy III, ed. I. S. McLean, S. K. Ramsay, & H. Takami, 77350F
2021
-
[30]
& Valenti, J
Piskunov, N. & Valenti, J. A. 2017, A&A, 597, A16
2017
-
[31]
E., Kupka, F., Ryabchikova, T
Piskunov, N. E., Kupka, F., Ryabchikova, T. A., Weiss, W. W., & Jeffery, C. S. 1995, A&AS, 112, 525
1995
-
[32]
M., Sneden, C., Roederer, I
Placco, V. M., Sneden, C., Roederer, I. U., et al. 2021, Research Notes of the American Astronomical Society, 5, 92
2021
-
[33]
2022, A&A, 666, A121
Randich, S., Gilmore, G., Magrini, L., et al. 2022, A&A, 666, A121
2022
-
[34]
2025, Experimental Astronomy, 59, 26
Rauer, H., Aerts, C., Cabrera, J., et al. 2025, Experimental Astronomy, 59, 26
2025
-
[35]
2025, arXiv e-prints, arXiv:2507.07093, 10.48550/arXiv.2507.07093
Ryabchikova, T., Piskunov, N., Kurucz, R. L., et al. 2015, Phys. Scr, 90, 054005 Santos-Peral,P.,Recio-Blanco,A.,deLaverny,P.,Fernández-Alvar,E.,&Orde- novic, C. 2020, A&A, 639, A140 SDSS Collaboration, Adamane Pallathadka, G., Aghakhanloo, M., et al. 2025, arXiv e-prints, arXiv:2507.07093
-
[36]
2024, A&A, 689, A201
Sestito, F., Vitali, S., Jofre, P., et al. 2024, A&A, 689, A201
2024
-
[37]
Silva, J. V. S., Cunha, K., Perottoni, H. D., et al. 2020, ApJ, 901, 27
2020
-
[38]
Sneden, C. A. 1973, PhD thesis, University of Texas, Austin
1973
-
[39]
2022, A&A, 663, A4
Soubiran, C., Brouillet, N., & Casamiquela, L. 2022, A&A, 663, A4
2022
-
[40]
L., Lagarde, N., et al
Soubiran, C., Creevey, O. L., Lagarde, N., et al. 2024, A&A, 682, A145
2024
-
[41]
2006, AJ, 132, 1645
Steinmetz, M., Zwitter, T., Siebert, A., et al. 2006, AJ, 132, 1645
2006
-
[42]
Stetson, P. B. & Pancino, E. 2008, PASP, 120, 1332 Strassmeier,K.G.,Ilyin,I.,Järvinen,A.,etal.2015,AstronomischeNachrichten, 336, 324
2008
-
[43]
Valenti, J. A. & Piskunov, N. 1996, A&AS, 118, 595
1996
-
[44]
2024, A&A, 687, A164 Article number, page 13 of 18 A&A proofs:manuscript no
Vitali, S., Slumstrup, D., Jofré, P., et al. 2024, A&A, 687, A164 Article number, page 13 of 18 A&A proofs:manuscript no. main Appendix A: Instruments used for the R42 dataset In Fig. A.1 we show the original instrument for each star used in this study. This is a summary focused on this work but more information about the processing of the data can be fou...
2024
discussion (0)
Sign in with ORCID, Apple, or X to comment. Anyone can read and Pith papers without signing in.