Mathematical framework for perception-driven parameter choice in image denoising
Pith reviewed 2026-06-29 00:48 UTC · model grok-4.3
The pith
Psychometric scaling of human comparisons yields a HaarPSI threshold for choosing denoising parameters
A machine-rendered reading of the paper's core claim, the machinery that carries it, and where it could break.
Core claim
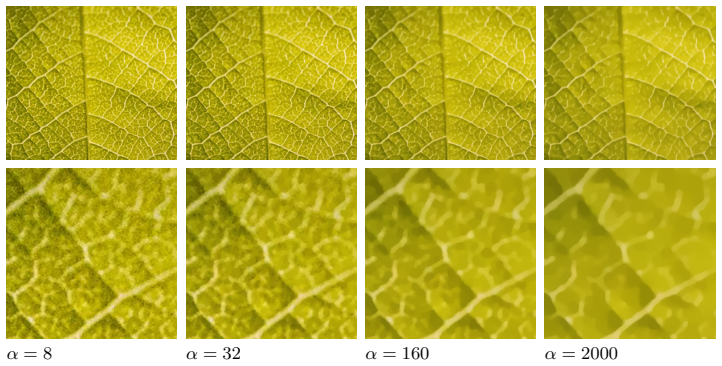
Conducting human comparison tests on total variation denoised images with varying parameters and applying psychometric scaling produces a HaarPSI threshold that discretizes the parameter grid according to perceived similarity, yielding calibrated image sets and a framework for further comparison-based experiments in perception-driven imaging.
What carries the argument
Psychometric scaling of pairwise human similarity judgments on denoised images to calibrate HaarPSI as a discretization threshold for total variation denoising parameters.
If this is right
- Total variation denoising parameters can be discretized using the derived HaarPSI threshold to produce results that better match human visual assessment.
- The resulting psychometrically scaled image collections are available for direct use in additional perception-driven imaging experiments.
- The comparison-test-plus-scaling procedure supplies a template that can be repeated for other denoising algorithms or imaging modalities.
Where Pith is reading between the lines
- The same calibration process could be applied to parameter selection in deblurring, inpainting, or other restoration tasks to align outputs with perception.
- Automated systems might eventually use the calibrated HaarPSI threshold to pick denoising strength on the fly for new images without manual tuning.
- Testing the threshold across many different base images would reveal whether it remains stable or varies with image content type.
Load-bearing premise
The judgments collected from human participants in the comparison tests accurately reflect perceived differences that matter for the practical quality of denoised images.
What would settle it
A replication study with new participants that returns a substantially different HaarPSI threshold whose image groupings contradict independent visual quality rankings would show the scaling method does not reliably capture perception.
Figures


read the original abstract
We approach image denoising from a perception-driven perspective: how can we select the parameters that are best suited for human visual perception? We combine research methods in mathematics and psychology to develop a mathematical framework for measuring perceived similarity. We construct a sample set of differently denoised photographs by using the same base image as input data and by tuning the parameter value in a total variation denoising algorithm. A comparison test is conducted with human participants to survey perceived differences between the images. Analyzing the results with psychometric scaling provides us with a HaarPSI value to use as a threshold in discretizing parameter grids. As a result, we obtain psychometrically scaled, openly available image sets that are ready to use in further experiments in perception-driven imaging, as well as a framework for ensuing experiments involving comparison tests.
Editorial analysis
A structured set of objections, weighed in public.
Referee Report
Summary. The manuscript develops a perception-driven framework for choosing parameters in total-variation image denoising. A single base photograph is denoised at multiple regularization strengths; human participants perform pairwise comparison tests on the resulting images; psychometric scaling of the survey data is used to extract a HaarPSI threshold that discretizes the parameter grid. The authors release the scaled image sets and propose the procedure as a template for future perception-driven experiments.
Significance. If the mapping from human judgments to a stable HaarPSI cutoff can be shown to be reproducible, the work supplies both a concrete, openly available test collection and a methodological template that links mathematical image metrics to perceptual data. Such resources are currently scarce in the perception-driven imaging literature.
major comments (2)
- [Abstract / Methods (survey and scaling procedure)] The central claim—that psychometric scaling of the comparison-test results directly supplies a usable HaarPSI threshold—rests on an unstated mapping between scaled perceptual distances and computed HaarPSI values. The manuscript does not specify the scaling model (Thurstone, Bradley-Terry, etc.), the number of participants, inter-rater consistency statistics, or the precise thresholding rule applied to the continuous scale. Without these details the threshold cannot be evaluated for stability or generalizability beyond the single base image and algorithm tested.
- [Results / Discussion] The assumption that pairwise human judgments of “perceived difference” between total-variation reconstructions accurately reflect quality differences relevant to denoising is load-bearing yet untested. No validation against an independent perceptual quality scale or against objective metrics other than HaarPSI is reported, leaving open the possibility that the derived threshold reflects task-specific artifacts rather than general perceptual utility.
minor comments (2)
- [Methods] Clarify whether the same base image is used for all reported experiments or whether additional images were tested; the abstract mentions only one base image.
- [Methods] Provide the exact definition or reference for the HaarPSI implementation employed when computing distances between image pairs.
Simulated Author's Rebuttal
We thank the referee for the constructive feedback on the methodological details and validation aspects. We will revise the manuscript to address the points raised while preserving the core contribution of the perception-driven framework and the released image sets.
read point-by-point responses
-
Referee: [Abstract / Methods (survey and scaling procedure)] The central claim—that psychometric scaling of the comparison-test results directly supplies a usable HaarPSI threshold—rests on an unstated mapping between scaled perceptual distances and computed HaarPSI values. The manuscript does not specify the scaling model (Thurstone, Bradley-Terry, etc.), the number of participants, inter-rater consistency statistics, or the precise thresholding rule applied to the continuous scale. Without these details the threshold cannot be evaluated for stability or generalizability beyond the single base image and algorithm tested.
Authors: We agree that these details are required for reproducibility and evaluation of the threshold. The revised manuscript will specify the psychometric scaling model, report the number of participants, include inter-rater consistency statistics, and describe the exact thresholding rule used to obtain the HaarPSI cutoff from the scaled distances. revision: yes
-
Referee: [Results / Discussion] The assumption that pairwise human judgments of “perceived difference” between total-variation reconstructions accurately reflect quality differences relevant to denoising is load-bearing yet untested. No validation against an independent perceptual quality scale or against objective metrics other than HaarPSI is reported, leaving open the possibility that the derived threshold reflects task-specific artifacts rather than general perceptual utility.
Authors: The manuscript centers on direct measurement of perceived similarity through pairwise comparisons to support parameter selection, rather than claiming a general perceptual quality metric. We will revise the discussion to explicitly note this scope, acknowledge the absence of cross-validation against other scales, and outline how the released data sets could support such validation in follow-up studies. revision: partial
Circularity Check
No significant circularity; framework rests on new human experiments and psychometric scaling
full rationale
The paper constructs denoised image samples via total-variation denoising, collects fresh pairwise comparison data from human participants, and applies psychometric scaling to those results to obtain a HaarPSI threshold for parameter discretization. This chain is empirical and self-contained: the threshold is not obtained by fitting a parameter to a subset of the same data and relabeling it a prediction, nor by self-citation of a uniqueness theorem, nor by smuggling an ansatz through prior work. No equations or steps reduce the output to the input by construction. The derivation therefore stands on independent perceptual data rather than tautological re-labeling.
Axiom & Free-Parameter Ledger
free parameters (1)
- HaarPSI threshold value
axioms (1)
- domain assumption Psychometric scaling of comparison test data provides a valid measure of perceived similarity between images
Reference graph
Works this paper leans on
-
[1]
Jari Kaipio and Erkki Somersalo.Statistical and Computational Inverse Problems. Vol. 160. Applied Mathematical Sciences. Springer-Verlag, New York, 2005, pp. xvi+339.isbn: 0-387-22073-9
2005
-
[2]
European Congress of Mathematics
Martin Burger. “European Congress of Mathematics”. In: EMS Press,
-
[3]
Variational regularization in inverse problems and machine learning, pp
Chap. Variational regularization in inverse problems and machine learning, pp. 253–275.doi:10.4171/8ECM/01
-
[4]
Leon Bungert et al. “Variational regularisation for inverse problems with imperfect forward operators and general noise models”. In:Inverse Prob- lems36.125014 (2020).doi:10.1088/1361-6420/abc531
-
[5]
Variational Methods in Imaging
Otmar Scherzer Markus Grasmair Harald Grossauer Markus Haltmeier and Frank Lenzen. “Variational Methods in Imaging”. In: New York, New York, USA: Springer, 2009. Chap. Variational Regularization Methods for the Solution of Inverse Problems, pp. 53–113.doi:10.1007/978-0-387- 69277-7_3
-
[6]
GitHub documentation
Tristan van Leeuwen and Christoph Brune.Variational formulations for inverse problems. GitHub documentation. A repository containing lecture notes on inverse problems and imaging. This chapter lists common choices for a regularizer. 2026.url:https://tristanvanleeuwen.github.io/ IP_and_Im_Lectures/variational_formulations.html
2026
-
[7]
Least squares methods for ill-posed problems with a pre- scribed bound
Keith Miller. “Least squares methods for ill-posed problems with a pre- scribed bound”. In:SIAM J. Math. Anal.1 (1970), pp. 52–74
1970
-
[8]
Lawson and Richard J
Charles L. Lawson and Richard J. Hanson.Solving Least Squares Prob- lems. Reprint by SIAM in 1995. Engelwood Cliffs, New Jersey, USA: Prentica–Hall, 1974
1995
-
[9]
Keijo H¨ am¨ al¨ ainen et al. “Sparse tomography”. In:SIAM Journal on Sci- entific Computing35.3 (2013), B644–B665.doi:10.1137/120876277. 28
-
[10]
Multiresolution Parameter Choice Method for To- tal Variation Regularized Tomography
Kati Niinim¨ aki et al. “Multiresolution Parameter Choice Method for To- tal Variation Regularized Tomography”. In:SIAM Journal on Imaging Sciences9.3 (2016), pp. 938–974.doi:10.1137/15M1034076
-
[11]
On the solution of functional equations by the method of regularization
Vladimir A. Morozov. “On the solution of functional equations by the method of regularization”. In:Doklady Akademii Nauk SSSR167.3 (1966), pp. 510–512
1966
-
[12]
Morozov’s discrepancy prin- ciple for Tikhonov regularization of severly ill-posed problems in finite- dimensional subspaces
Sergei Pereverzyev and Eberhard Schock. “Morozov’s discrepancy prin- ciple for Tikhonov regularization of severly ill-posed problems in finite- dimensional subspaces”. In:Numerical Functional Analysis and Optimiza- tion21.7 (2000)
2000
-
[13]
Sparsity-promoting Bayesian inversion
Ville Kolehmainen et al. “Sparsity-promoting Bayesian inversion”. In:In- verse Problems28.2 (2012).doi:10.1088/0266-5611/28/2/025005
-
[14]
Karl Pearson. “On the criterion that a given system of deviations from the probable in the case of a correlated system of variables is such that it can be reasonably supposed to have arisen from random sampling”. In: The Philosophical Magazine50 (1900), pp. 157–175
1900
-
[15]
The Chi-square test of independence
Mary L. McHugh. “The Chi-square test of independence”. In:Biochemia Medica23.2 (2013), pp. 143–149
2013
-
[16]
Blog post ongeeksforgeeks.org
Alind Gupta.Chi–Square Test for Feature Selection - Mathematical Ex- planation. Blog post ongeeksforgeeks.org. A post explaining how this test can be mathematically applied to feature selection, such as parame- ter selection. 2025.url:https://www.geeksforgeeks.org/machine- learning/chi-square-test-for-feature-selection-mathematical- explanation/
2025
-
[17]
Nonlinear total varia- tion based noise removal algorithms
Stanley Osher Leonid I. Rudin and Emad Fatemi. “Nonlinear total varia- tion based noise removal algorithms”. In:Physica D60.1-4 (1992), pp. 259– 268.doi:10.1016/0167-2789(92)90242-F. 29
-
[18]
A First–Order Primal–Dual Algo- rithm for Convex Problems with Applications to Imaging
Thomas Pock Antonin Chambolle. “A First–Order Primal–Dual Algo- rithm for Convex Problems with Applications to Imaging”. In:Journal of Mathematical Imaging and Vision(40(1) 2010), pp. 120–145.url:http: //dx.doi.org/10.1007/s10851-010-0251-1
-
[19]
Efficient Algorithms for Global Optimization Meth- ods in Computer Vision
Kristian Bredies. “Efficient Algorithms for Global Optimization Meth- ods in Computer Vision”. In: Berlin: Springer Berlin Heidelberg, 2014. Chap. Recovering piecewise smooth multichannel images by minimization of convex functionals with total generalized variation penalty, pp. 44–77
2014
-
[20]
A Law of Comparitive Judgment
L. L. Thurstone. “A Law of Comparitive Judgment”. In:Psychological Review34 (1929), pp. 273–286
1929
-
[21]
Winchester, Massachusetts, USA: Imcotek Press, 2000
Peter Engeldrum.Psychometric Scaling: A Toolkit for Imaging Systems Development. Winchester, Massachusetts, USA: Imcotek Press, 2000
2000
-
[22]
The Perception of Similarity, Dif- ference and Opposition
Ivana Bianchi and Roberto Burro. “The Perception of Similarity, Dif- ference and Opposition”. In:Journal of Intelligence11.9 (2023).doi: 10.3390/jintelligence11090172
-
[23]
U. B¨ ockenholt. “Models for paired comparisons”. In:Encyclopedia of So- cial Measurement(2005), pp. 735–740.doi:10.1016/B0- 12- 369398- 5/00454-0
work page doi:10.1016/b0- 2005
-
[24]
A Haar Wavelet–Based Perceptual Similarity Index for Image Qual- ity Assessment
Gitta Kutyniok Rafael Reisenhofer Sebastian Bosse and Thomas Wiegand. “A Haar Wavelet–Based Perceptual Similarity Index for Image Qual- ity Assessment”. In:Signal Processing: Image Communication(61 2018). Matlab and Python algorithms can be found at https://www.math.uni- bremen.de/cda/HaarPSI/, as well as a summary on the use and function of the method., ...
-
[25]
Image quality as- sessment: from error visibility to structural similarity
H. Sheikh Zhou Wang A. C. Bovik and E. Simoncelli. “Image quality as- sessment: from error visibility to structural similarity”. In:IEEE Transac- tions on Image Processing13.4 (2004), pp. 600–612.doi:10.1109/TIP. 2003.819861. 30
work page doi:10.1109/tip 2004
-
[26]
Leipzig, Germany: Breitkopf und H¨ artel, 1860
Gustav Fechner.Elemente der psychophysik. Leipzig, Germany: Breitkopf und H¨ artel, 1860
-
[27]
A Wavelet Tour of Signal Processing: The Sparse Way
St´ ephane Mallet. “A Wavelet Tour of Signal Processing: The Sparse Way”. In: Academic Press, 2009. Chap. 2: The Fourier Kingdom, pp. 33–57.doi: 10.1016/B978-0-12-374370-1.X0001-8
-
[28]
A Matlab code of the Chambolle–Pock algorithm written by Emilia Bl˚ asten and L´ ılian Ferreira de Freitas
L´ ılian Ferreira de Freitas Emilia Bl˚ asten.TV-Chambolle multicolor func- tion. A Matlab code of the Chambolle–Pock algorithm written by Emilia Bl˚ asten and L´ ılian Ferreira de Freitas. 2022
2022
-
[29]
Saara Isoranta Emilia Bl˚ asten L´ ılian Ferreira de Freitas Jukka H¨ akkinen Markus Juvonen and Samuli Siltanen.Psychometrically scaled image sets. Openly available dataset in Zenodo. The repository containing the data constracted over the course of this project. 2026.doi:10.5281/zenodo. 18457707
-
[30]
The fusiform face area: a cortical region specialized for the perception of faces
Nancy Kanwisher and Galit Yovel. “The fusiform face area: a cortical region specialized for the perception of faces”. In:Philos Trans R Soc Lond B Biol Sci.29.361 (2006), pp. 2109–2128.doi:10.1098/rstb.2006.1934. url:https://pmc.ncbi.nlm.nih.gov/articles/PMC1857737/
-
[31]
The neural basis of face pareidolia with human intracerebral recordings
Beg¨ um Cerraho˘ glu et al. “The neural basis of face pareidolia with human intracerebral recordings”. In:Imaging Neuroscience3 (2025). From MIT Press Direct.doi:https://doi.org/10.1162/imag_a_00518
-
[32]
L´ ılian Ferreira de Freitas.Image Compare!https://compare.blasten. eu. The image comparison test built by L´ ılian Ferreira de Freitas, available online. 2024
2024
-
[33]
Is boredom a source of noise and/or a confound in behavioral science research?
Wanja Wolff Maria Meier Corinna S. Martarelli. “Is boredom a source of noise and/or a confound in behavioral science research?” In:Humanit Soc Sci Commun11.368 (2024).doi:10.1057/s41599-024-02851-7
-
[34]
fi / en/
Tutkijoiden y¨ o.Researchers’ night.https : / / tutkijoidenyo . fi / en/. The European Researchers’ night event in Finland, where researchers at four different universities present their research to the public, the inverse 31 problems research unit at University of Helsinki among them. The pro- gramme of UH can be found on this page:https://www.helsinki.f...
2025
discussion (0)
Sign in with ORCID, Apple, or X to comment. Anyone can read and Pith papers without signing in.