Agentic Authoring of Interactive Multiview Visualizations in Genomics
Pith reviewed 2026-06-28 20:38 UTC · model grok-4.3
The pith
Agentic iteration substantially improves the perceived quality of LLM-generated interactive multiview visualizations for genomics.
A machine-rendered reading of the paper's core claim, the machinery that carries it, and where it could break.
Core claim
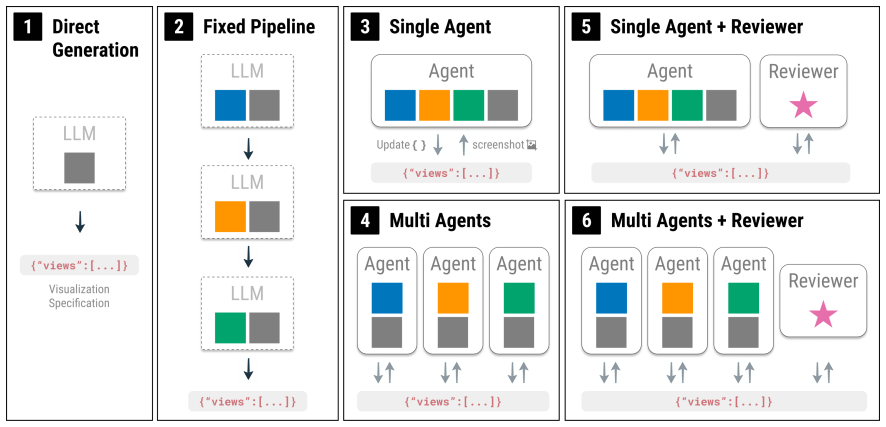
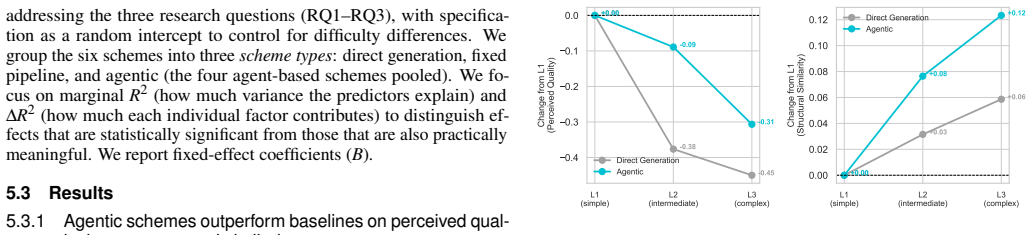
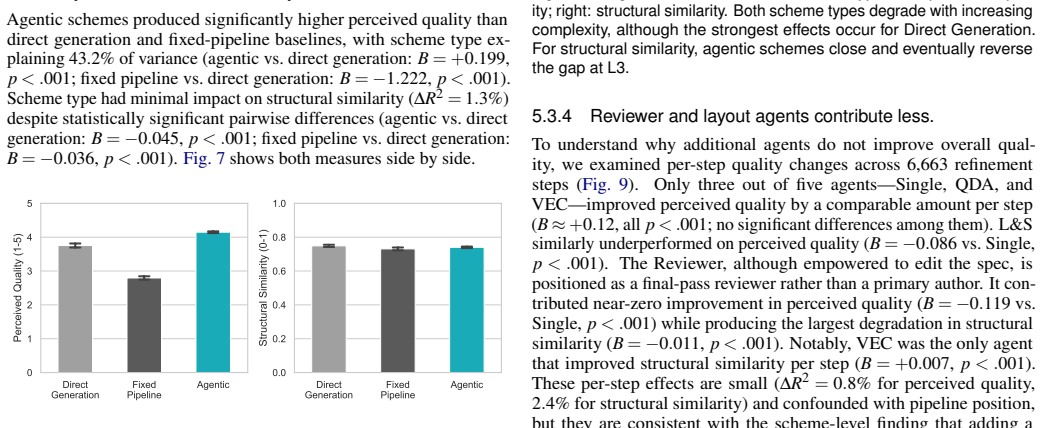
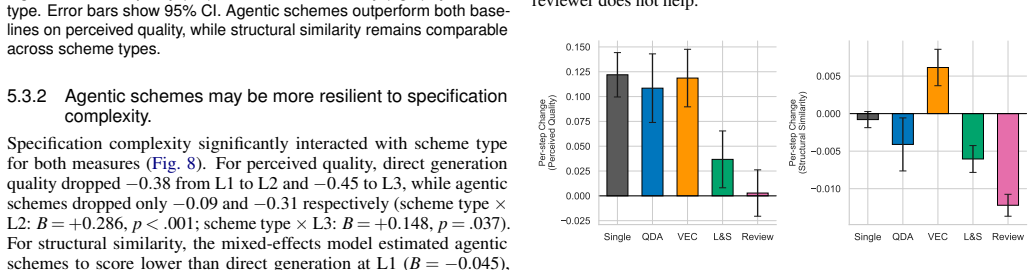
Agentic iteration substantially improves perceived quality over both baselines, while more complex agent architectures yield no additional benefit. The evaluation covers six schemes across 159 test cases at three levels of query ambiguity and specification complexity, using eight quality dimensions from an initial characterization of where vanilla LLM generation succeeds and fails.
What carries the argument
Agentic configurations that vary the number of specialist agents and include a reviewer, producing structured output in the Gosling visualization grammar.
Load-bearing premise
The eight quality dimensions accurately capture what matters for usable genomics visualizations, and the 159 test cases represent real user requests that biologists would make.
What would settle it
An experiment in which practicing biologists rate the generated visualizations on their own actual analysis tasks and report no quality difference between agentic iteration and the direct or pipeline baselines.
Figures


read the original abstract
Diverse genomics data, scientific questions, and analysis tasks typically demand highly specialized visualizations. Therefore, users often must customize or author new ones tailored to their data. Existing tools are usually either limited in customization or require substantial learning or programming, and even expressive tools assume visualization expertise many users lack. Agentic and large language model (LLM) approaches are increasingly applied to complex scientific tasks, including visualization. Natural-language conversational interfaces offer a promising path to democratizing the authoring of complex visualizations. In the context of genomics, these approaches face additional challenges: genomics visualizations typically integrate heterogeneous data types and are composed of multiple linked interactive views. These challenges motivate more structured LLM-based schemes. We first characterize where vanilla LLM generation succeeds and fails for genomics visualization, identifying eight quality dimensions. We then compare six schemes--direct generation, a fixed pipeline, and four agentic configurations varying in the number of specialist agents and the presence of a reviewer--across 159 cases spanning three levels of query ambiguity and specification complexity. All schemes use the Gosling visualization grammar as structured output. Agentic iteration substantially improves perceived quality over both baselines, while more complex agent architectures yield no additional benefit. We discuss implications for designing agentic systems for domain-specific visualization authoring. All supplemental materials are available at https://osf.io/uqe83.
Editorial analysis
A structured set of objections, weighed in public.
Referee Report
Summary. The paper characterizes failures of vanilla LLM generation for genomics visualizations into eight quality dimensions, then empirically compares six schemes (direct generation, fixed pipeline, and four agentic configurations differing in specialist agents and reviewer presence) on 159 synthetic test cases spanning three levels of ambiguity and complexity. All schemes output Gosling grammar specifications. The central finding is that agentic iteration substantially improves perceived quality over baselines while added architectural complexity yields no further benefit, with discussion of implications for agentic systems in domain-specific visualization authoring.
Significance. If the evaluation holds, the work offers concrete, evidence-based guidance on when and how to apply agentic LLM designs for authoring complex, linked multiview visualizations in genomics. It directly addresses the gap between expressive but expert-oriented tools and the needs of biologists lacking visualization expertise, and the finding that iteration helps but complexity does not could inform more efficient agent architectures in other scientific domains.
major comments (3)
- [Characterization of LLM failures] Characterization section: the eight quality dimensions are derived solely from the authors' initial analysis of LLM failures; the manuscript reports neither external validation against practicing biologists nor inter-rater reliability statistics for the dimensions or the subsequent scoring, which is load-bearing for the headline claim that agentic iteration improves 'perceived quality'.
- [Comparison of schemes] Evaluation / test-case construction: the 159 cases are described as spanning three ambiguity/complexity levels, yet no procedure is given for generating or externally validating that these cases match real biologist requests; if the distribution over-represents certain query styles or omits factors such as biological interpretability of linked views, the reported advantage of agentic iteration may not generalize.
- [Results] Results reporting: the abstract states that agentic iteration 'substantially improves' quality and that more complex architectures yield 'no additional benefit,' but the manuscript provides neither statistical tests, effect sizes, nor raw per-dimension scores; without these, the strength of the central empirical claim cannot be assessed.
minor comments (2)
- [Abstract / Methods] The abstract and methods should explicitly state whether the quality scoring was performed by the authors or by independent raters and whether any blinding was used.
- [Evaluation] Supplemental materials link is provided, but the main text should include at least one example prompt, generated visualization, and dimension-by-dimension score table to allow readers to assess the evaluation protocol.
Simulated Author's Rebuttal
We thank the referee for their constructive comments on our manuscript. We address each of the major comments below, indicating the revisions we plan to make to strengthen the paper.
read point-by-point responses
-
Referee: [Characterization of LLM failures] Characterization section: the eight quality dimensions are derived solely from the authors' initial analysis of LLM failures; the manuscript reports neither external validation against practicing biologists nor inter-rater reliability statistics for the dimensions or the subsequent scoring, which is load-bearing for the headline claim that agentic iteration improves 'perceived quality'.
Authors: We agree that the eight quality dimensions were derived from our internal analysis of LLM failures without external validation or reported inter-rater reliability, which limits the generalizability of the evaluation framework. To address this, we will expand the characterization section to detail the iterative process used to identify the dimensions, provide concrete examples from our pilot studies, and include a dedicated limitations subsection acknowledging the lack of external biologist validation and inter-rater statistics. If additional resources permit, we will explore obtaining inter-rater reliability in a follow-up. This constitutes a partial revision. revision: partial
-
Referee: [Comparison of schemes] Evaluation / test-case construction: the 159 cases are described as spanning three ambiguity/complexity levels, yet no procedure is given for generating or externally validating that these cases match real biologist requests; if the distribution over-represents certain query styles or omits factors such as biological interpretability of linked views, the reported advantage of agentic iteration may not generalize.
Authors: The test cases were constructed internally to systematically vary ambiguity and complexity levels based on common patterns in genomics visualization queries. We acknowledge that without an explicit generation procedure or external validation against actual biologist requests, the representativeness cannot be fully assured. In the revision, we will add a subsection detailing the test case construction methodology, including the criteria for each complexity level and examples, and discuss the potential limitations regarding real-world query distributions and factors like biological interpretability. This will be a full revision to the evaluation section. revision: yes
-
Referee: [Results] Results reporting: the abstract states that agentic iteration 'substantially improves' quality and that more complex architectures yield 'no additional benefit,' but the manuscript provides neither statistical tests, effect sizes, nor raw per-dimension scores; without these, the strength of the central empirical claim cannot be assessed.
Authors: We concur that the results would be more robust with statistical support. The current manuscript relies on descriptive comparisons of perceived quality scores. We will revise the results section to include appropriate non-parametric statistical tests (such as Wilcoxon signed-rank tests for paired comparisons), report effect sizes, and provide tables or figures with raw per-dimension scores across all schemes. The abstract claims will be qualified accordingly based on these analyses. This is a full revision. revision: yes
Circularity Check
Empirical comparison with no derivation chain or self-referential reduction.
full rationale
The paper conducts an empirical user study comparing LLM prompting schemes for visualization authoring. It identifies eight quality dimensions via initial characterization and evaluates six schemes on 159 synthetic cases using perceived quality ratings. No equations, fitted parameters, predictions derived from inputs by construction, or load-bearing self-citations appear in the reported chain. The central claim (agentic iteration improves quality) rests on human ratings along author-derived dimensions rather than reducing to those dimensions tautologically. This is a standard empirical design with independent evaluation content; external validation concerns are validity issues, not circularity.
Axiom & Free-Parameter Ledger
axioms (2)
- domain assumption Gosling is a suitable structured output format for the target multiview genomics visualizations
- domain assumption The eight quality dimensions capture the relevant failure modes for genomics visualizations
Reference graph
Works this paper leans on
-
[2]
M. Brehmer and T. Munzner. A Multi-Level Typology of Abstract Vi- sualization Tasks.IEEE Transactions on Visualization and Computer Graphics, 19(12):2376–2385, Dec. 2013. doi: 10.1109/TVCG.2013.124 3
-
[3]
Buels, E
R. Buels, E. Yao, C. M. Diesh, R. D. Hayes, M. Munoz-Torres, G. Helt et al. Jbrowse: a dynamic web platform for genome visualization and analysis.Genome biology, 17(1):66, 2016. 2
2016
-
[4]
S. Card. Information visualization. InHuman-computer interaction, pp. 199–234. CRC press, 2009. 5
2009
-
[5]
J. Chen, J. Wu, J. Guo, V . Mohanty, X. Li, J. P. Ono et al. InterChat: Enhancing Generative Visual Analytics using Multimodal Interactions. Computer Graphics Forum, 44(3):e70112, June 2025. doi: 10.1111/cgf. 70112 1
work page doi:10.1111/cgf 2025
-
[6]
N. Chen, Y . Zhang, J. Xu, K. Ren, and Y . Yang. VisEval: A Benchmark for Data Visualization in the Era of Large Language Models.IEEE Transactions on Visualization and Computer Graphics, 31(1):1301–1311, Jan. 2025. doi: 10.1109/TVCG.2024.3456320 2
-
[7]
Z. Chen, J. Chen, S. Ö. Arık, M. Sra, T. Pfister, and J. Yoon. CoDA: AGENTIC SYSTEMS FOR COLLABORATIVE DATA VISUALIZA- TION. 2026. 1, 2, 3
2026
-
[8]
Choi and J
J. Choi and J. Jo. Waltzboard: Multi-criteria automated dashboard de- sign for exploratory analysis. In2025 IEEE 18th Pacific Visualization Conference (PacificVis), pp. 258–268. IEEE, 2025. 6
2025
-
[9]
J. Choi, J. Lee, and J. Jo. Bavisitter: Integrating design guidelines into large language models for visualization authoring. In2024 IEEE Visualization and Visual Analytics (VIS), pp. 121–125. IEEE, 2024. 6
2024
-
[10]
M. R. Corces, A. Shcherbina, S. Kundu, M. J. Gloudemans, L. Frésard, J. M. Granja et al. Single-cell epigenomic analyses implicate candidate causal variants at inherited risk loci for Alzheimer’s and Parkinson’s diseases.Nature Genetics, 52(11):1158–1168, Nov. 2020. doi: 10.1038/ s41588-020-00721-x 1, 8
2020
-
[11]
A. K. Das, M. Tarun, and K. Mueller. Charts-of-Thought: Enhancing LLM Visualization Literacy Through Structured Data Extraction. 2025. 1, 2
2025
-
[12]
V . Dibia. LIDA: A Tool for Automatic Generation of Grammar-Agnostic Visualizations and Infographics using Large Language Models. InPro- ceedings of the 61st Annual Meeting of the Association for Computational Linguistics (Volume 3: System Demonstrations), pp. 113–126. Association for Computational Linguistics, Toronto, Canada, 2023. doi: 10.18653/v1/ 202...
-
[13]
Diehl, A
A. Diehl, A. Abdul-Rahman, M. El-Assady, B. Bach, D. A. Keim, and M. Chen. Visguides: A forum for discussing visualization guidelines. EuroVis (Short Papers), 6(7):61–65, 2018. 6
2018
-
[14]
L. Dong and A. Crisan. Probing the Visualization Literacy of Vision Language Models: The Good, the Bad, and the Ugly.IEEE Transactions on Visualization and Computer Graphics, pp. 1–11, 2025. doi: 10.1109/ TVCG.2025.3634791 1
-
[15]
L. Gao, J. Lu, Z. Shao, Z. Lin, S. Yue, C. Leong et al. Fine-Tuned Large Language Model for Visualization System: A Study on Self-Regulated Learning in Education.IEEE Transactions on Visualization and Computer Graphics, 31(1):514–524, Jan. 2025. doi: 10.1109/TVCG.2024.3456145 2
-
[16]
S. Gao, R. Zhu, P. Sui, Z. Kong, S. Aldogom, Y . Huang et al. Democratiz- ing AI scientists using ToolUniverse, 2025. doi: 10.48550/ARXIV.2509. 23426 2
-
[17]
K. Goswami, P. Mathur, R. Rossi, and F. Dernoncourt. PlotGen: Multi- Agent LLM-based Scientific Data Visualization via Multimodal Retrieval Feedback. InCompanion Proceedings of the ACM on Web Conference 2025, pp. 1672–1676. ACM, Sydney NSW Australia, May 2025. doi: 10. 1145/3701716.3716888 1, 2
-
[18]
Hong and A
M.-H. Hong and A. Crisan. Data Has Entered the Chat: How Data Workers Conduct Exploratory Visual Analytic Conversations with GenAI Agents. ACM Transactions on Interactive Intelligent Systems, 15(4):1–40, Dec
-
[19]
doi: 10.1145/3744750 2
-
[20]
M. Hostnik, R. Kurbanov, Y . Sokolov, and A. Trofimov. VegaChat: A Robust Framework for LLM-Based Chart Generation and Assessment, Jan. 2026. doi: 10.48550/arXiv.2601.15385 1, 2
-
[21]
H. Kim, S. L’Yi, N. Gehlenborg, and J. Heer. Automatic Synthesis of Visualization Design Knowledge Bases, Jan. 2026. doi: 10.1145/3772318. 3790286 6
-
[22]
N. W. Kim, Y . Ahn, G. Myers, and B. Bach. How Good Is CHATGPT in Giving Advice on Your Visualization Design?ACM Transactions on Computer-Human Interaction, 32(5):1–33, Oct. 2025. doi: 10.1145/ 3745768 1, 6
2025
-
[23]
N. W. Kim, G. Myers, J. Choi, Y . Cho, C. Oh, and Y .-S. Kim. Understand- ing the research-practice gap in visualization design guidelines.IEEE Transactions on Visualization and Computer Graphics, 2025. 6
2025
-
[24]
H.-K. Ko, H. Jeon, G. Park, D. H. Kim, N. W. Kim, J. Kim et al. Natural Language Dataset Generation Framework for Visualizations Powered by Large Language Models. InProceedings of the CHI Conference on Human Factors in Computing Systems, pp. 1–22. ACM, Honolulu HI USA, May
-
[25]
doi: 10.1145/3613904.3642943 2
-
[26]
D. Lange, S. Gao, P. Sui, A. Money, P. Misner, M. Zitnik et al. YAC: Bridging Natural Language and Interactive Visual Exploration with Gener- ative AI for Biomedical Data Discovery, Sept. 2025. doi: 10.48550/arXiv. 2509.19182 1
work page internal anchor Pith review Pith/arXiv arXiv doi:10.48550/arxiv 2025
-
[27]
Lange, P
D. Lange, P. Sui, S. Gao, M. Zitnik, and N. Gehlenborg. DQVis Dataset: Natural Language to Biomedical Visualization. 2025. 2
2025
-
[28]
C. Lee, W. Park, H. Kim, J. Lee, and H. Pfister. An Agentic Drawer– Advisor for Content-Aligned Visualization. 2025. 2, 3
2025
-
[29]
S. Li, X. Chen, Y . Song, Y . Song, and C. Zhang. Prompt4Vis: Prompting Large Language Models with Example Mining and Schema Filtering for Tabular Data Visualization, Jan. 2024. doi: 10.48550/arXiv.2402.07909 1
-
[30]
J. Lu, Y . Song, C. Zhang, and R. C.-W. Wong. MultiVis-Agent: A Multi- Agent Framework with Logic Rules for Reliable and Comprehensive Cross-Modal Data Visualization, Jan. 2026. doi: 10.48550/arXiv.2601. 18320 2, 3
-
[31]
S. L’Yi and N. Gehlenborg. Multi-View Design Patterns and Responsive Visualization for Genomics Data.IEEE Transactions on Visualization and Computer Graphics, 29(1):559–569, Jan. 2023. doi: 10.1109/TVCG.2022 .3209398 2
-
[32]
S. L’Yi, A. Van Den Brandt, E. Adams, H. N. Nguyen, and N. Gehlenborg. Learnable and Expressive Visualization Authoring Through Blended In- terfaces.IEEE Transactions on Visualization and Computer Graphics, 31(1):459–469, Jan. 2025. doi: 10.1109/TVCG.2024.3456598 1, 2
-
[33]
S. LYi, Q. Wang, F. Lekschas, and N. Gehlenborg. Gosling: A Grammar- based Toolkit for Scalable and Interactive Genomics Data Visualization. IEEE Transactions on Visualization and Computer Graphics, 28(1):140– 150, Jan. 2022. doi: 10.1109/TVCG.2021.3114876 2
-
[34]
P. Maddigan and T. Susnjak. Chat2VIS: Generating Data Visualizations via Natural Language Using ChatGPT, Codex and GPT-3 Large Language Models.IEEE Access, 11:45181–45193, 2023. doi: 10.1109/ACCESS. 2023.3274199 1, 2
-
[35]
Meyer, T
M. Meyer, T. Munzner, and H. Pfister. Mizbee: a multiscale synteny browser.IEEE transactions on visualization and computer graphics, 15(6):897–904, 2009. 2
2009
-
[36]
Moritz, C
D. Moritz, C. Wang, G. L. Nelson, H. Lin, A. M. Smith, B. Howe et al. Formalizing visualization design knowledge as constraints: Actionable and extensible models in draco.IEEE transactions on visualization and computer graphics, 25(1):438–448, 2018. 6
2018
-
[37]
H. N. Nguyen, S. L’Yi, T. C. Smits, S. Gao, M. Zitnik, and N. Gehlenborg. Geranium: Multimodal Retrieval of Genomics Data Visualizations. 2025. 2, 3, 6
2025
-
[38]
S. Nusrat, T. Harbig, and N. Gehlenborg. Tasks, Techniques, and Tools for Genomic Data Visualization.Computer Graphics Forum, 38(3):781–805, June 2019. doi: 10.1111/cgf.13727 1, 2, 6 10
-
[39]
Ouyang, J
G. Ouyang, J. Chen, Z. Nie, Y . Gui, Y . Wan, H. Zhang et al. NV AGENT: Automated Data Visualization from Natural Language via Collaborative Agent Workflow. 1, 2
-
[40]
A. Pandey, S. L’Yi, Q. Wang, M. A. Borkin, and N. Gehlenborg. GenoREC: A Recommendation System for Interactive Genomics Data Visualization. IEEE Transactions on Visualization and Computer Graphics, 29(1):570– 580, Jan. 2023. doi: 10.1109/TVCG.2022.3209407 2, 5, 6
-
[41]
N. Ponochevnyi, Y .-H. Kim, J. J. Williams, and A. Kuzminykh. Talk Me Through It: Developing Effective Systems for Chart Authoring, Jan. 2026. doi: 10.48550/arXiv.2601.14707 1
-
[42]
Ribalta-Albado and P.-P
M. Ribalta-Albado and P.-P. Vázquez. Evaluating LLMs’ abilities to create charts, a systematic approach.Computers & Graphics, 135:104544, Apr
-
[43]
doi: 10.1016/j.cag.2026.104544 1
-
[44]
S. Ruan, R. Sheng, X. Wen, J. Wang, T. Zhang, Y . Wang et al. Qualitative Study for LLM-assisted Design Study Process: Strategies, Challenges, and Roles. 2025. 1
2025
-
[45]
T. C. Smits, S. L’Yi, A. P. Mar, and N. Gehlenborg. Altgosling: automatic generation of text descriptions for accessible genomics data visualization. Bioinformatics, 40(12):btae670, 2024. 2
2024
-
[46]
A. Srinivasan, N. Nyapathy, B. Lee, S. M. Drucker, and J. Stasko. Collect- ing and Characterizing Natural Language Utterances for Specifying Data Visualizations. InProceedings of the 2021 CHI Conference on Human Fac- tors in Computing Systems, pp. 1–10, May 2021. doi: 10.1145/3411764. 3445400 2, 3
-
[47]
Thorvaldsdóttir, J
H. Thorvaldsdóttir, J. T. Robinson, and J. P. Mesirov. Integrative ge- nomics viewer (igv): high-performance genomics data visualization and exploration.Briefings in bioinformatics, 14(2):178–192, 2013. 2
2013
-
[48]
Y . Tian, W. Cui, D. Deng, X. Yi, Y . Yang, H. Zhang et al. ChartGPT: Leveraging LLMs to Generate Charts From Abstract Natural Language. IEEE Transactions on Visualization and Computer Graphics, 31(3):1731– 1745, Mar. 2025. doi: 10.1109/TVCG.2024.3368621 2
-
[49]
A. van den Brandt, S. L’Yi, H. N. Nguyen, A. Vilanova, and N. Gehlenborg. Understanding Visualization Authoring Techniques for Genomics Data in the Context of Personas and Tasks.IEEE Transactions on Visualization and Computer Graphics, 31(1):1180–1190, Jan. 2025. doi: 10.1109/TVCG. 2024.3456298 1
-
[50]
P.-P. Vázquez. Are LLMs ready for Visualization? In2024 IEEE 17th Pacific Visualization Conference (PacificVis), pp. 343–352. IEEE, Tokyo, Japan, Apr. 2024. doi: 10.1109/PacificVis60374.2024.00049 1
-
[51]
S. S. Walters, A. Valderrama, T. C. Smits, D. Kou ˇril, H. N. Nguyen, S. L’Yi et al. GQVis: A Dataset of Genomics Data Questions and Visual- izations for Generative AI. 2025. 2
2025
-
[52]
H. W. Wang, M. Gordon, L. Battle, and J. Heer. DracoGPT: Extracting Visualization Design Preferences from Large Language Models.IEEE Transactions on Visualization and Computer Graphics, 31(1):710–720, Jan. 2025. doi: 10.1109/TVCG.2024.3456350 1
-
[53]
J. Yang, P. F. Gyarmati, Z. Zeng, and D. Moritz. Draco 2: An extensible platform to model visualization design. In2023 IEEE Visualization and Visual Analytics (VIS), pp. 166–170. IEEE, 2023. 6
2023
-
[54]
Z. Yang, Z. Zhou, S. Wang, X. Cong, X. Han, Y . Yan et al. MatPlotA- gent: Method and Evaluation for LLM-Based Agentic Scientific Data Visualization, Mar. 2024. doi: 10.48550/arXiv.2402.11453 2, 3
-
[55]
Z. Zeng, J. Yang, D. Moritz, J. Heer, and L. Battle. Too many cooks: Exploring how graphical perception studies influence visualization recom- mendations in draco.IEEE Transactions on Visualization and Computer Graphics, 30(1):1063–1073, 2023. 6
2023
-
[56]
C. Zhang, Y . Dong, Y . Wang, Y . Han, G. Shan, and B. Tang. AuraGenome: An LLM-Powered Framework for On-the-Fly Reusable and Scalable Cir- cular Genome Visualizations.IEEE Computer Graphics and Applications, 45(5):78–92, Sept. 2025. doi: 10.1109/MCG.2025.3581560 1, 2, 3 11
discussion (0)
Sign in with ORCID, Apple, or X to comment. Anyone can read and Pith papers without signing in.