Graph Attention-Based Virtual Metrology for Film Deposition Processes in Semiconductor Manufacturing
Pith reviewed 2026-06-28 17:35 UTC · model grok-4.3
The pith
A graph attention model predicts semiconductor film thickness from sensor data more accurately than baselines while showing interpretable parameter relationships.
A machine-rendered reading of the paper's core claim, the machinery that carries it, and where it could break.
Core claim
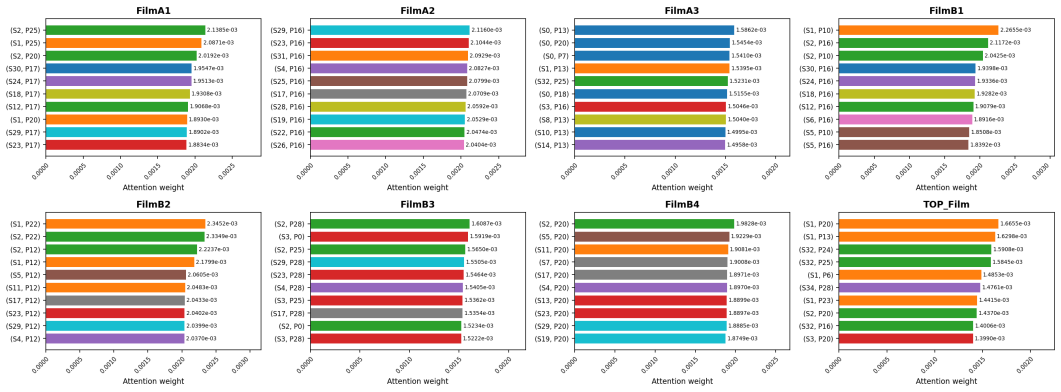
The framework represents process steps and parameters as nodes, extracts temporal embeddings via convolutional encoders, and applies a parameter-to-layer graph attention mechanism so each film layer aggregates the most relevant process signals; on industrial deposition data this yields higher prediction accuracy for film thickness than baseline models while the attention weights recover dominant factors and temporal patterns that match physical process behavior.
What carries the argument
The parameter-to-layer graph attention mechanism, which builds a directed graph over step-parameter nodes and lets each film layer selectively aggregate temporal features from relevant upstream parameters.
If this is right
- The model achieves better predictive performance than baseline models when tested on the collected industrial deposition data.
- Attention weights identify dominant process factors and temporal dependencies that align with physical deposition behavior.
- The framework supplies both thickness predictions and process insights that can support monitoring and optimization decisions.
- Temporal feature extraction combined with structured graph dependencies reduces the impact of heterogeneous sensor variables on prediction quality.
Where Pith is reading between the lines
- If attention weights prove stable across tools, the same graph structure could be reused to flag which sensor channels to prioritize during equipment maintenance.
- Extending the node definition to include upstream etch or clean steps might allow end-to-end virtual metrology across multiple process modules without retraining from scratch.
- Real-time sensor streams fed through the same encoders could support closed-loop thickness control rather than post-process prediction only.
Load-bearing premise
The industrial production-wafer dataset is representative and unbiased enough that performance gains and attention interpretations will hold on new tools or process variations.
What would settle it
Running the same model on deposition data from a different tool or with deliberate process shifts and finding that prediction error does not beat baselines or that attention weights no longer match documented physical dependencies.
Figures


read the original abstract
Artificial intelligence-driven semiconductor manufacturing increasingly operates at nanometer and angstrom scales, where precise process control depends on accurate and timely metrology. However, physical metrology is limited by measurement latency, cost, and sampling constraints, restricting its scalability in high-volume production. Virtual metrology (VM) has emerged as an effective alternative by predicting wafer-level characteristics from equipment sensor data. Despite recent advances, many existing VM models remain correlation-driven and lack the ability to capture structured dependencies among heterogeneous process variables, while providing limited interpretability. This study presents a graph attention-based VM framework for film deposition processes that integrates temporal feature learning with structured parameter-layer dependency modeling. The proposed approach represents each step-parameter pair as a node and extracts temporal embeddings from high-frequency equipment traces using convolutional feature encoders. A parameter-to-layer graph attention mechanism is employed to model directional dependencies, enabling each film layer to aggregate relevant process information. The framework is evaluated using industrial deposition data collected from production wafers, where the model predicts film thickness from multivariate sensor signals. Experimental results demonstrate improved predictive performance compared to baseline models. In addition, analysis of the learned attention weights reveals interpretable parameter-layer relationships consistent with physical process behavior, capturing dominant process factors and temporal dependencies across deposition stages. These results indicate that the proposed framework enhances prediction accuracy and provides meaningful insight into process dynamics, supporting effective monitoring and optimization in semiconductor manufacturing.
Editorial analysis
A structured set of objections, weighed in public.
Referee Report
Summary. The paper presents a graph attention-based virtual metrology framework for film deposition processes in semiconductor manufacturing. It models each step-parameter pair as a node, extracts temporal embeddings from high-frequency equipment traces via convolutional encoders, and employs a parameter-to-layer graph attention mechanism to model directional dependencies so that each film layer aggregates relevant process information. Evaluated on industrial deposition data from production wafers, the model predicts film thickness; the manuscript claims improved predictive performance over baselines plus interpretable attention weights that capture dominant process factors and temporal dependencies consistent with physical behavior.
Significance. If the performance gains and physical consistency of the attention weights are substantiated with quantitative evidence, the work could advance virtual metrology by combining structured dependency modeling with interpretability, aiding process monitoring and optimization where physical metrology is costly or slow.
major comments (2)
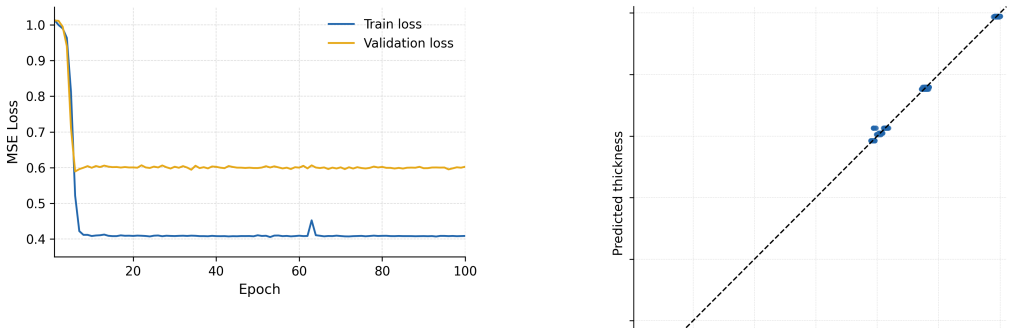
- [Experimental Results] Experimental Results section: the claim of improved predictive performance supplies no quantitative metrics, baseline descriptions, error bars, dataset size, or validation protocol, so the central empirical claim cannot be evaluated.
- [Attention Weight Analysis] Attention weight analysis: the claim that learned attention weights reveal 'interpretable parameter-layer relationships consistent with physical process behavior' rests on post-hoc inspection alone; no ablation removing known physical drivers, no comparison to a physics-based reference model, and no out-of-distribution test on a different tool or recipe are described, leaving open the possibility that patterns reflect training-distribution correlations rather than causal dependencies.
minor comments (1)
- [Abstract] Abstract: the statement 'experimental results demonstrate improved predictive performance' should include at least a high-level reference to the specific metrics or tables that support it.
Simulated Author's Rebuttal
We thank the referee for the constructive feedback. We address each major comment below and will revise the manuscript to strengthen the presentation of results and analysis.
read point-by-point responses
-
Referee: [Experimental Results] Experimental Results section: the claim of improved predictive performance supplies no quantitative metrics, baseline descriptions, error bars, dataset size, or validation protocol, so the central empirical claim cannot be evaluated.
Authors: We agree that the Experimental Results section in the submitted manuscript omits these essential details, which prevents evaluation of the performance claims. In the revised manuscript we will expand the section to report quantitative metrics including MAE and RMSE with error bars across runs, describe the baseline models, state the dataset size (number of production wafers and sensor traces), and specify the validation protocol such as the train/test split or cross-validation procedure. revision: yes
-
Referee: [Attention Weight Analysis] Attention weight analysis: the claim that learned attention weights reveal 'interpretable parameter-layer relationships consistent with physical process behavior' rests on post-hoc inspection alone; no ablation removing known physical drivers, no comparison to a physics-based reference model, and no out-of-distribution test on a different tool or recipe are described, leaving open the possibility that patterns reflect training-distribution correlations rather than causal dependencies.
Authors: The current analysis is indeed limited to post-hoc inspection of attention weights for consistency with known process physics. We will add an ablation study that removes parameters identified as dominant by the attention mechanism and quantifies the resulting change in prediction error and attention patterns. Direct comparison to a physics-based reference model is not straightforward for this deposition process, but we will provide a more detailed mapping to process engineering knowledge. Out-of-distribution evaluation on a different tool or recipe is not possible with the available industrial dataset. revision: partial
Circularity Check
No significant circularity; model trained on external data with independent evaluation
full rationale
The paper describes an end-to-end graph attention neural network trained on industrial deposition sensor traces to predict film thickness. Reported performance metrics are standard held-out test errors from this external dataset; no equations define the predictions in terms of the fitted parameters themselves, and no self-citation chain or ansatz is invoked to justify the central results. Attention-weight analysis is presented as post-hoc inspection rather than a load-bearing derivation. The framework therefore remains self-contained against external benchmarks with no reduction of outputs to inputs by construction.
Axiom & Free-Parameter Ledger
free parameters (1)
- model hyperparameters
axioms (2)
- domain assumption Sensor data from equipment traces contains the information needed to predict film thickness at each layer
- domain assumption Directional dependencies between process parameters and film layers can be represented as a directed graph
invented entities (1)
-
parameter-to-layer graph attention mechanism
no independent evidence
Reference graph
Works this paper leans on
-
[1]
Silicon minds: The rise of AI- powered chips
Talati, Dhruvitkumar. “Silicon minds: The rise of AI- powered chips.” (2021)
2021
-
[2]
Development trendsandprospectsofsemiconductordevicesandtechnol- ogy
Qiu, Zekun, Shen, Xianao and Zhao, Zirui. “Development trendsandprospectsofsemiconductordevicesandtechnol- ogy.”DevelopmentVol. 81 (2024)
2024
-
[3]
Nanoscale technologies: design challenges and advance- ments
Srivastava, Sumit, Jaiswal, Abhinav and Khan, Arman. “Nanoscale technologies: design challenges and advance- ments.”Semiconductor Nanoscale Devices: Materials and Design Challenges. Bentham Science Publishers (2025): pp. 1–26
2025
-
[4]
Generative Model PredictiveControlinManufacturingProcesses: AReview
Lee,SukKi,Stone,RonnieFP,Gao,Max,Zhang,Wenlong, Sha, Zhenghui and Ko, Hyunwoong. “Generative Model PredictiveControlinManufacturingProcesses: AReview.” arXiv preprint arXiv:2511.17865(2025)
arXiv 2025
-
[5]
A review of thin-film growth, properties, applications, and future prospects
Sakthinathan, Subramanian, Meenakshi, Ganesh Abi- naya, Vinothini, Sivaramakrishnan, Yu, Chung-Lun, Chen, Ching-Lung, Chiu, Te-Wei and Vittayakorn, Naratip. “A review of thin-film growth, properties, applications, and future prospects.”ProcessesVol. 13 No. 2 (2025): p. 587
2025
-
[6]
Cambridge Univer- sity Press (2023)
Plummer, James D and Griffin, Peter B.Integrated Circuit Fabrication: Science and Technology. Cambridge Univer- sity Press (2023)
2023
-
[7]
Metrology for the next generation of semiconductor 8 FIGURE 6: BAR CHARTS OF THE TOP-k(k=10) PARAMETERS FOR SELECTED LAYERS devices
Orji, Ndubuisi G, Badaroglu, Mustafa, Barnes, Bryan M, Beitia, Carlos, Bunday, Benjamin D, Celano, Umberto, Kline, Regis J, Neisser, Mark, Obeng, Yaw and Vladar, AE. “Metrology for the next generation of semiconductor 8 FIGURE 6: BAR CHARTS OF THE TOP-k(k=10) PARAMETERS FOR SELECTED LAYERS devices.”Nature electronicsVol. 1 No. 10 (2018): pp. 532–547
2018
-
[8]
7/5nm logic manufacturing capabilities and requirements ofmetrology
Bunday,Benjamin,Bello,AF,Solecky,EricandVaid,Alok. “7/5nm logic manufacturing capabilities and requirements ofmetrology.”Metrology,Inspection,andProcessControl forMicrolithographyXXXII,Vol.10585: pp.81–124.2018. SPIE
2018
-
[9]
Exploring machine learning for semiconductor pro- cess optimization: A systematic review
Chen, Ying-Lin, Sacchi, Sara, Dey, Bappaditya, Blanco, Victor, Halder, Sandip, Leray, Philippe and De Gendt, Ste- fan. “Exploring machine learning for semiconductor pro- cess optimization: A systematic review.”IEEE Transac- tions on Artificial IntelligenceVol. 5 No. 12 (2024): pp. 5969–5989
2024
-
[10]
An approach for factory-wide control utilizing virtual metrol- ogy
Khan,AftabA,Moyne,JamesRandTilbury,DawnM. “An approach for factory-wide control utilizing virtual metrol- ogy.”IEEE Transactions on semiconductor Manufacturing Vol. 20 No. 4 (2007): pp. 364–375
2007
-
[11]
Developmentofthevirtualmetrologyforthenitridethick- ness in multi-layer plasma-enhanced chemical vapor depo- sition using plasma-information variables
Roh, Hyun-Joon, Ryu, Sangwon, Jang, Yunchang, Kim, Nam-Kyun,Jin,Younggil,Park,SeolhyeandKim,Gon-Ho. “Developmentofthevirtualmetrologyforthenitridethick- ness in multi-layer plasma-enhanced chemical vapor depo- sition using plasma-information variables.”IEEE Trans- actions on Semiconductor ManufacturingVol. 31 No. 2 (2018): pp. 232–241
2018
-
[12]
AI-Powered Next-Generation Technology for Semiconductor Optical Metrology: A Review
Xu, Weiwang, Zhang, Houdao, Ji, Lingjing and Li, Zhongyu. “AI-Powered Next-Generation Technology for Semiconductor Optical Metrology: A Review.”Microma- chinesVol. 16 No. 8 (2025). DOI 10.3390/mi16080838
-
[13]
El-Kareh,BadihandHutter,LouN.Fundamentalsofsemi- conductorprocessingtechnology.SpringerScience&Busi- ness Media (2012)
2012
-
[14]
Decision-based virtual metrol- ogyforadvancedprocesscontroltoempowersmartproduc- tion and an empirical study for semiconductor manufactur- ing
Chien, Chen-Fu, Hung, Wei-Tse, Pan, Chin-Wei and Van Nguyen, Tran Hong. “Decision-based virtual metrol- ogyforadvancedprocesscontroltoempowersmartproduc- tion and an empirical study for semiconductor manufactur- ing.”Computers&IndustrialEngineeringVol.169(2022): p. 108245
2022
-
[15]
Critical- dimension metrology and the scanning electron micro- scope
Postek, Michael T and Vladár, András E. “Critical- dimension metrology and the scanning electron micro- scope.”Handbook of Silicon Semiconductor Metrology. CRC Press (2001): pp. 244–275
2001
-
[16]
Spectro- scopicellipsometry: advancements,applicationsandfuture prospects in optical characterization
Politano, Grazia Giuseppina and Versace, Carlo. “Spectro- scopicellipsometry: advancements,applicationsandfuture prospects in optical characterization.”Spectroscopy Jour- nalVol. 1 No. 3 (2023): pp. 163–181
2023
-
[17]
Metrology
Bunday, Benjamin and Orji, George. “Metrology.”2021 IEEEInternationalRoadmapforDevicesandSystemsOut- briefs: pp. 01–68. 2021. IEEE
2021
-
[18]
Data-driven modeling in metrology–A short in- troduction, current developments and future perspectives
Schneider, Linda-Sophie, Krauss, Patrick, Schiering, Na- dine, Syben, Christopher, Schielein, Richard and Maier, Andreas. “Data-driven modeling in metrology–A short in- troduction, current developments and future perspectives.” tm-TechnischesMessenVol.91No.9(2024): pp.480–503
2024
-
[19]
Virtual metrology for semiconductor manufacturing applications
Bertorelle, Nicola. “Virtual metrology for semiconductor manufacturing applications.”
-
[20]
Review of Ap- plications of Regression and Predictive Modeling in Wafer Manufacturing
Chen, Hsuan-Yu and Chen, Chiachung. “Review of Ap- plications of Regression and Predictive Modeling in Wafer Manufacturing.”ElectronicsVol. 14 No. 20 (2025): p. 4083
2025
-
[21]
CNN–BiLSTM–Attention-Based Hybrid- Driven Modeling for Diameter Prediction of Czochralski SiliconSingleCrystals
Zhang, Pengju, Pan, Hao, Chen, Chen, Jing, Yiming and Liu, Ding. “CNN–BiLSTM–Attention-Based Hybrid- Driven Modeling for Diameter Prediction of Czochralski SiliconSingleCrystals.”Crystals(2073-4352)Vol.16No.1 (2026)
2073
-
[22]
AMTransformer: A Koopman theory-based transformer for learning additive manufacturing dynamics in laser processes
Lee, Suk Ki and Ko, Hyunwoong. “AMTransformer: A Koopman theory-based transformer for learning additive manufacturing dynamics in laser processes.”International JournalofAIforMaterialsandDesignVol.1No.2(2024): pp. 76–91
2024
-
[23]
Virtual Metrology Based on Graph Convolu- tional Neural Network for Semiconductor PVD Process
Zhou,Longfei,Jin,Dong,Chen,Shuangwu,Yang,Jianand Xie, Jian. “Virtual Metrology Based on Graph Convolu- tional Neural Network for Semiconductor PVD Process.” 20245thInternationalConferenceonArtificialIntelligence 9 andElectromechanicalAutomation(AIEA):pp.1053–1058
-
[24]
Lee, Suk Ki, Kim, Wonah, Lee, Sungbeom, Park, Jeonghyeon, Chun, Sejin, Yeung, Ho and Ko, Hyunwoong. “Graphattention-baseddynamicalandcausalspatiotempo- ral learning for anomaly detection in additive manufactur- ing.”VirtualandPhysicalPrototypingVol.21No.1(2026): p. e2611194. DOI 10.1080/17452759.2025.2611194
-
[25]
Multi-stage pro- cess diagnosis networks in semiconductor manufacturing
Choi, Jongwon and Kim, Seoung Bum. “Multi-stage pro- cess diagnosis networks in semiconductor manufacturing.” IEEE AccessVol. 12 (2024): pp. 39495–39504
2024
-
[26]
XplAInable: Explainable AI Smoke Detection at the Edge
Lehnert, Alexander, Gawantka, Falko, During, Jonas, Just, Franz and Reichenbach, Marc. “XplAInable: Explainable AI Smoke Detection at the Edge.”Big Data and Cognitive ComputingVol. 8 No. 5 (2024): p. 50
2024
-
[27]
Seshan,Krishna.Handbookofthinfilmdeposition.William Andrew (2012). 10
2012
discussion (0)
Sign in with ORCID, Apple, or X to comment. Anyone can read and Pith papers without signing in.