Inside-Out vs. Outside-In Quenching of MaNGA Galaxies: Dependence on Stellar Mass and Environment
Pith reviewed 2026-06-28 16:53 UTC · model grok-4.3
The pith
The choice of observational tracer for quenched regions changes whether galaxies are classified as quenching inside-out or outside-in.
A machine-rendered reading of the paper's core claim, the machinery that carries it, and where it could break.
Core claim
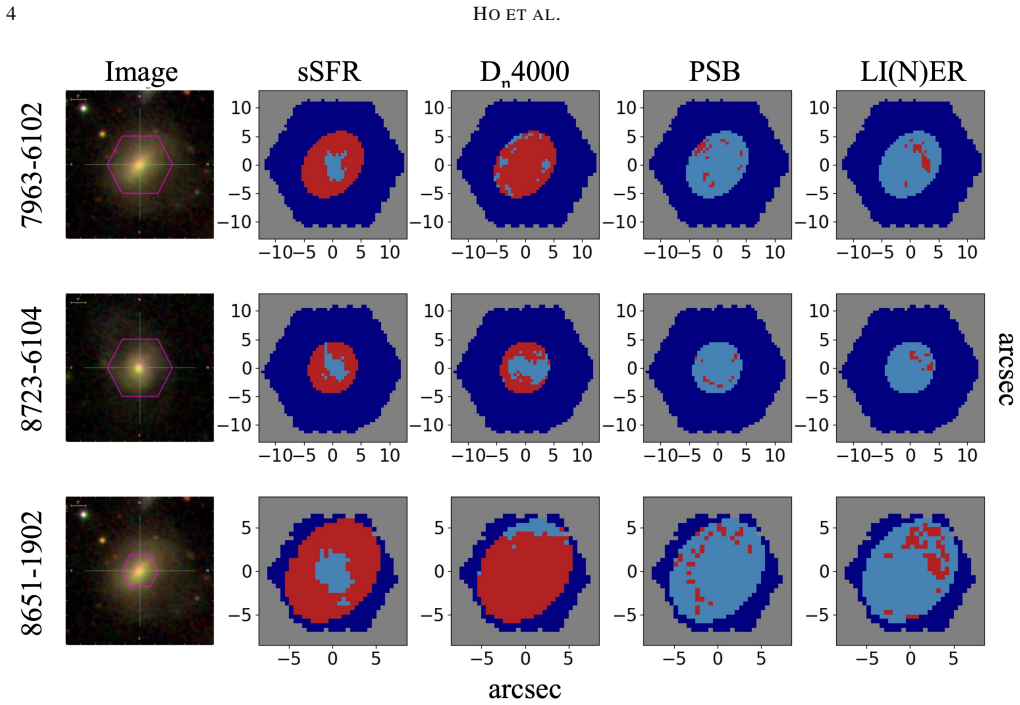
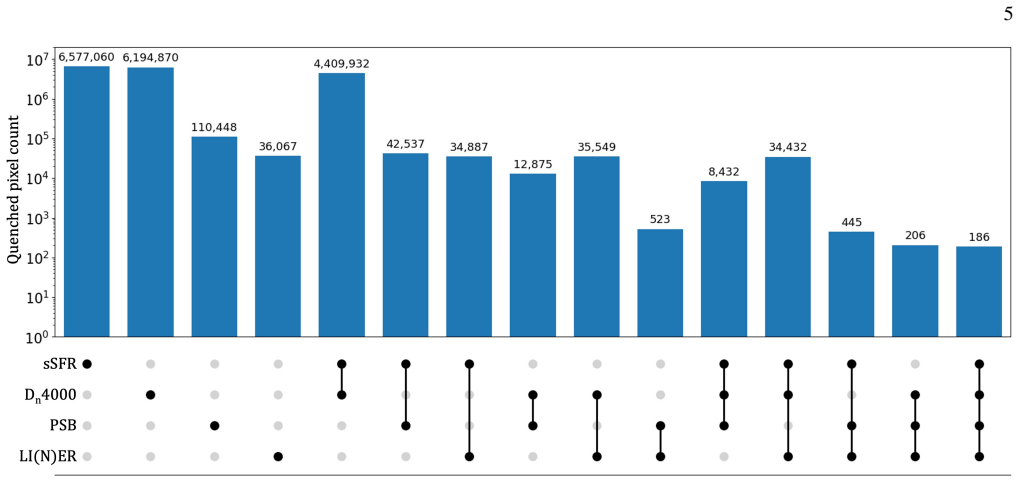
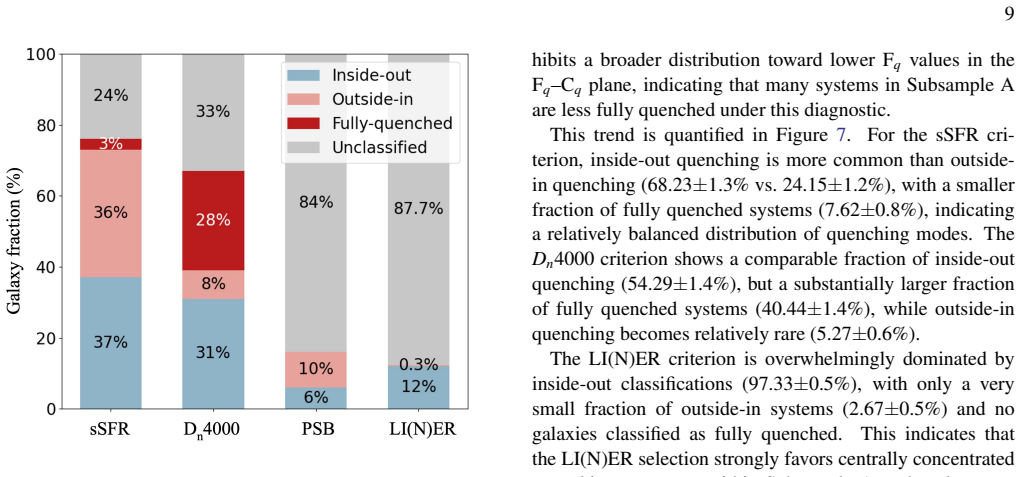
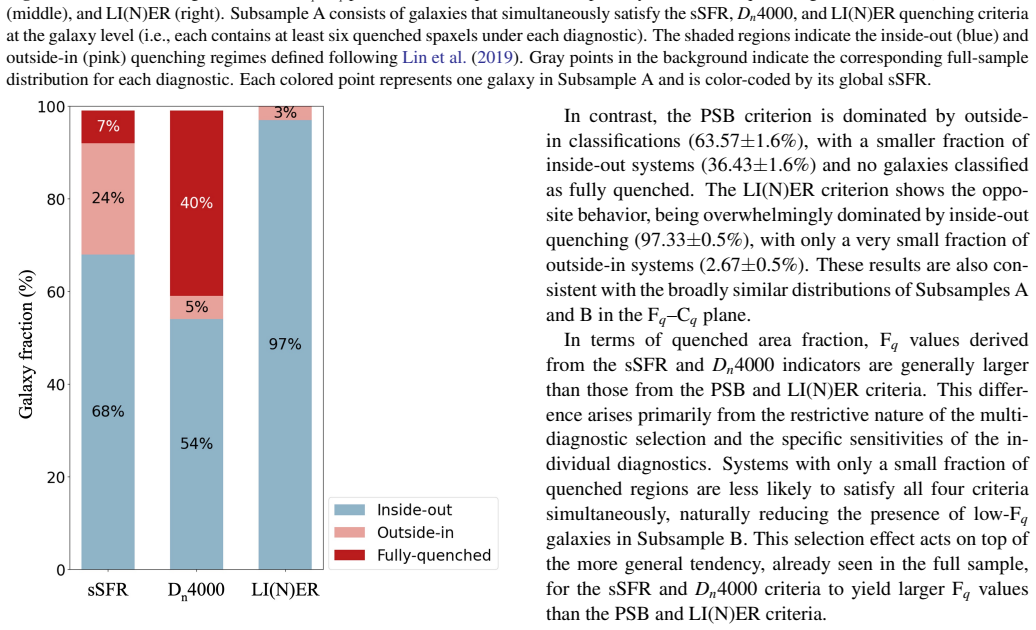
Galaxies are classified into inside-out and outside-in quenching using the location on the plane defined by the fraction of quenched area and the concentration of that area. The specific star formation rate diagnostic yields comparable numbers of each mode. The 4000 angstrom break and low-ionization emission line diagnostics strongly favor inside-out patterns. Post-starburst regions occupy a distinct area on the plane. Across most diagnostics the inside-out fraction rises with stellar mass while outside-in is more common at low mass especially for satellites, with weaker and less consistent trends with halo mass.
What carries the argument
The non-parametric classification on the Fq-Cq plane, where Fq is the fraction of the quenched area and Cq is the concentration of the quenched area, used to distinguish inside-out from outside-in quenching modes.
Load-bearing premise
The classification using the fraction and concentration of quenched areas assigns the correct inside-out or outside-in mode for each tracer without being affected by other physical processes or selection effects.
What would settle it
Finding that the mass and environment trends in quenching mode are identical when using any of the four tracers in the same set of galaxies would indicate that the differences are not real.
Figures


read the original abstract
Galaxy quenching, the cessation of star formation, can proceed in spatially distinct ways, commonly described as inside-out or outside-in. However, the inferred quenching pattern depends strongly on how quenched or quenching regions are defined observationally. We utilize a sample of approximately 10,000 galaxies from the Mapping Nearby Galaxies at APO (MaNGA) DR17 survey to systematically compare four widely used diagnostics of star formation suppression: specific star formation rate (sSFR), the 4000 {\AA} break (Dn4000), post-starburst (PSB), and low-ionization (nuclear) emission-line region (LI(N)ER) emission, to examine how tracer choice influences the inferred spatial quenching pattern. Using the non-parametric method developed by Lin et al. (2019), we classify galaxies into inside-out and outside-in quenching modes based on the location on the plane of the fraction of the quenched area (Fq) and the concentration of quenched area (Cq). We find that the sSFR criterion yields comparable proportions of galaxies classified as inside-out and outside-in, while Dn4000 and LI(N)ER diagnostics strongly favor inside-out patterns. Because PSB traces a distinct transitional phase, PSB-selected spaxels occupy a different region of the Fq-Cq plane. Across most diagnostics, the fraction of galaxies classified as inside-out increases with stellar mass, while outside-in patterns are more common in lower-mass systems, especially among satellites. In contrast, the dependence of quenching mode on halo mass is weaker and less consistent across diagnostics. These differences show that the tracers probe complementary stages and timescales of star-formation suppression, and together provide a more complete view of spatially resolved quenching.
Editorial analysis
A structured set of objections, weighed in public.
Referee Report
Summary. The manuscript analyzes ~10,000 MaNGA DR17 galaxies to compare four diagnostics of star-formation suppression (sSFR, Dn4000, PSB, LI(N)ER) for classifying inside-out versus outside-in quenching modes via the non-parametric Fq-Cq plane method of Lin et al. (2019). It reports that sSFR yields roughly equal inside-out and outside-in fractions, Dn4000 and LI(N)ER strongly favor inside-out, PSB occupies a distinct region of the plane, inside-out fractions increase with stellar mass across most diagnostics, and outside-in is more common in lower-mass satellites, while halo-mass dependence is weaker; the differences are interpreted as evidence that the tracers probe complementary stages and timescales of quenching.
Significance. If the Fq-Cq classifications prove robust across tracers, the work demonstrates that quenching-mode inferences are sensitive to the choice of diagnostic and that multi-tracer analyses can provide a more complete view of spatially resolved quenching, with potential implications for distinguishing environmental and mass-driven processes in galaxy evolution models.
major comments (1)
- [Abstract] The central claim that differences across the four diagnostics demonstrate complementary stages and timescales rests on the assumption that the Lin et al. (2019) Fq-Cq classification assigns quenching mode independently of tracer-specific physics. The abstract provides no indication that the method was re-validated or tested with mocks for sSFR (recent SF), Dn4000 (age), PSB (post-burst), and LI(N)ER (ionization), each of which weights different stellar-population or emission properties; without such checks, apparent differences in Fq-Cq occupancy could arise from how quenched spaxels are defined rather than distinct evolutionary stages.
minor comments (1)
- [Abstract] The abstract reports trends but omits quantitative fractions, uncertainties, or sample-selection details (e.g., mass range, redshift cuts, or spaxel S/N thresholds) that would allow immediate assessment of the reported proportions.
Simulated Author's Rebuttal
We thank the referee for the constructive comment on our manuscript. We address the concern about validation of the Fq-Cq method below and agree that the abstract would benefit from clarification on this point.
read point-by-point responses
-
Referee: [Abstract] The central claim that differences across the four diagnostics demonstrate complementary stages and timescales rests on the assumption that the Lin et al. (2019) Fq-Cq classification assigns quenching mode independently of tracer-specific physics. The abstract provides no indication that the method was re-validated or tested with mocks for sSFR (recent SF), Dn4000 (age), PSB (post-burst), and LI(N)ER (ionization), each of which weights different stellar-population or emission properties; without such checks, apparent differences in Fq-Cq occupancy could arise from how quenched spaxels are defined rather than distinct evolutionary stages.
Authors: We agree that the abstract does not explicitly note re-validation of the Fq-Cq method for each tracer. The Lin et al. (2019) classification is non-parametric and determines quenching mode solely from the spatial distribution metrics Fq and Cq once quenched spaxels have been identified; it does not depend on the underlying stellar-population or emission physics of the tracer. We applied the published method consistently, using each diagnostic's standard criteria to flag quenched regions. The resulting differences in Fq-Cq occupancy are therefore expected to reflect the distinct timescales each tracer is sensitive to. Nevertheless, to address the referee's concern we will revise the abstract to state that the method is applied as validated in Lin et al. (2019) and add a short discussion paragraph noting the lack of new mock tests while emphasizing that the observed mass and environment trends are robust across tracers. This constitutes a partial revision. revision: partial
Circularity Check
Minor self-citation of Fq-Cq classification method; central results independent of fitted inputs
specific steps
-
self citation load bearing
[Abstract]
"Using the non-parametric method developed by Lin et al. (2019), we classify galaxies into inside-out and outside-in quenching modes based on the location on the plane of the fraction of the quenched area (Fq) and the concentration of quenched area (Cq)."
The load-bearing classification step cites prior work by an overlapping author (Lihwai Lin). However, because the method itself is external to this manuscript and the paper reports new applications to different tracers on independent survey data, the citation does not reduce the observed differences to a definition or fit constructed within the present analysis.
full rationale
The paper applies the non-parametric Fq-Cq classification from Lin et al. (2019) to MaNGA DR17 data across four diagnostics and reports empirical differences in inside-out vs. outside-in fractions. This constitutes one minor self-citation (Lihwai Lin is a co-author), but the classification is a previously published method applied to public survey data rather than a fit or definition internal to this work. No equations reduce any reported fraction or trend to a parameter defined by the same dataset, and the central claim rests on observed differences rather than a self-referential loop. This matches the expected low-circularity outcome for papers that reuse established external methods.
Axiom & Free-Parameter Ledger
axioms (1)
- domain assumption The Fq-Cq plane from Lin et al. (2019) correctly separates inside-out from outside-in quenching for each diagnostic.
Reference graph
Works this paper leans on
-
[1]
doi:10.1086/380092 Baldwin, J. A., Phillips, M. M., & Terlevich, R. 1981, PASP, 93, 5. doi:10.1086/130766 Belfiore, F., Maiolino, R., Maraston, C., et al. 2016, MNRAS, 461, 3, 3111. doi:10.1093/mnras/stw1234 Belfiore, F., Maiolino, R., Bundy, K., et al. 2018, MNRAS, 477,
-
[2]
F., Wolf, C., Meisenheimer, K., et al
doi:10.1093/mnras/sty768 Bell, E. F., Wolf, C., Meisenheimer, K., et al. 2004, ApJ, 608, 752. doi:10.1086/420778 Birnboim, Y . & Dekel, A. 2003, MNRAS, 345, 349. doi:10.1046/j.1365-8711.2003.06955.x Blanton, M. R. & Moustakas, J. 2009, ARA&A, 47, 159. doi:10.1146/annurev-astro-082708-101734 Bluck, A. F. L., Mendel, J. T., Ellison, S. L., et al. 2016, MNRA...
-
[3]
Energy input from quasars regulates the growth and activity of black holes and their host galaxies
doi:10.1038/nature03335 Dressler, A. & Gunn, J. E. 1983, ApJ, 270, 7. doi:10.1086/161093 Elbaz, D., Daddi, E., Le Borgne, D., et al. 2007, A&A, 468, 33. doi:10.1051/0004-6361:20077525 Elbaz, D., Dickinson, M., Hwang, H. S., et al. 2011, A&A, 533, A119. doi:10.1051/0004-6361/201117239 Ellison, S. L., Lin, L., Thorp, M. D., et al. 2021, MNRAS, 502, L6. doi:...
work page internal anchor Pith review doi:10.1038/nature03335 1983
-
[4]
doi:10.1086/519294 Fabian, A. C. 2012, ARA&A, 50, 455. doi:10.1146/annurev-astro-081811-125521 Feldmann, R. & Mayer, L. 2015, MNRAS, 446, 1939. doi:10.1093/mnras/stu2207 Fischera, J. & Dopita, M. 2005, ApJ, 619, 340. doi:10.1086/426185 Goto, T. 2003, Ph.D. Thesis, Environmental Effects on Galaxy Evolution, University of Tokyo, Japan. doi:10.48550/arXiv.as...
work page internal anchor Pith review Pith/arXiv arXiv doi:10.1086/519294 2012
-
[5]
doi:10.1093/mnras/sty1690 Hong, H., Wang, H., Mo, H. J., et al. 2023, ApJ, 954, 183. doi:10.3847/1538-4357/ace96f Ilbert, O., Salvato, M., Le Floc’h, E., et al. 2010, ApJ, 709, 644. doi:10.1088/0004-637X/709/2/644 Jian, H.-Y ., Lin, L., Koyama, Y ., et al. 2020, ApJ, 894, 125. doi:10.3847/1538-4357/ab86a8 Kalinova, V ., Colombo, D., Sánchez, S. F., et al....
work page internal anchor Pith review doi:10.1093/mnras/sty1690 2023
-
[6]
doi:10.1093/mnras/stx1762 Man, A. & Belli, S. 2018, Nature Astronomy, 2, 695. doi:10.1038/s41550-018-0558-1 Mao, Z., Kodama, T., Pérez-Martínez, J. M., et al. 2022, A&A, 666, A141. doi:10.1051/0004-6361/202243733 Martin, D. C., Wyder, T. K., Schiminovich, D., et al. 2007, ApJS, 173, 342. doi:10.1086/516639 Martig, M., Bournaud, F., Teyssier, R., et al. 20...
-
[7]
Indicators of star formation: 4000 Angstrom break and Balmer lines
doi:10.1088/0004-637X/777/1/18 23 Noeske, K. G., Weiner, B. J., Faber, S. M., et al. 2007, ApJL, 660, L43. doi:10.1086/517926 Pan, H.-A., Lin, L., Ellison, S. L., et al. 2024, ApJ, 964, 120. doi:10.3847/1538-4357/ad28c1 Pannella, M., Carilli, C. L., Daddi, E., et al. 2009, ApJL, 698, L116. doi:10.1088/0004-637X/698/2/L116 Papaderos, P., Breda, I., Humphre...
work page internal anchor Pith review Pith/arXiv arXiv doi:10.1088/0004-637x/777/1/18 2007
-
[8]
doi:10.1093/mnras/stac871 Renzini, A. & Peng, Y .-. jie . 2015, ApJL, 801, L29. doi:10.1088/2041-8205/801/2/L29 Salim, S., Rich, R. M., Charlot, S., et al. 2007, ApJS, 173, 267. doi:10.1086/519218 Sanchez, N. N., Tremmel, M., Werk, J. K., et al. 2021, ApJ, 911,
-
[9]
doi:10.3847/1538-4357/abeb15 Sánchez, S. F., Barrera-Ballesteros, J. K., Lacerda, E., et al. 2022, ApJS, 262, 36. doi:10.3847/1538-4365/ac7b8f Schiminovich, D., Wyder, T. K., Martin, D. C., et al. 2007, ApJS, 173, 315. doi:10.1086/524659 Schawinski, K., Urry, C. M., Simmons, B. D., et al. 2014, MNRAS, 440, 889. doi:10.1093/mnras/stu327 Smethurst, R. J., L...
-
[10]
doi:10.1038/nature03597 Stasi´nska, G., Cid Fernandes, R., Mateus, A., et al. 2006, MNRAS, 371, 972. doi:10.1111/j.1365-2966.2006.10732.x Stasi´nska, G., Vale Asari, N., Cid Fernandes, R., et al. 2008, MNRAS, 391, 1, L29. doi:10.1111/j.1745-3933.2008.00550.x Strateva, I., Ivezi´c, Ž., Knapp, G. R., et al. 2001, AJ, 122, 1861. doi:10.1086/323301 V ogt, F. ...
-
[11]
doi:10.1111/j.1365-2966.2012.21188.x Whitaker, K. E., van Dokkum, P. G., Brammer, G., et al. 2012, ApJL, 754, L29. doi:10.1088/2041-8205/754/2/L29 Wong, O. I., Schawinski, K., Kaviraj, S., et al. 2012, MNRAS, Galaxy Zoo: building the low-mass end of the red sequence with local post-starburst galaxies, 420, 2, 1684. doi:10.1111/j.1365-2966.2011.20159.x Woo...
-
[12]
doi:10.1093/mnras/sts274 Wu, P.-F., van der Wel, A., Bezanson, R., et al. 2018, ApJ, 868, 1,
-
[13]
doi:10.3847/1538-4357/aae822 Wyder, T. K., Martin, D. C., Schiminovich, D., et al. 2007, ApJS, 173, 293. doi:10.1086/521402 Yan, R. & Blanton, M. R. 2012, ApJ, 747, 61. doi:10.1088/0004-637X/747/1/61 Yan, R., Tremonti, C., Bershady, M. A., et al. 2016, AJ, 151, 8. doi:10.3847/0004-6256/151/1/8 Yan, R., Bundy, K., Law, D. R., et al. 2016, AJ, 152, 197. doi...
discussion (0)
Sign in with ORCID, Apple, or X to comment. Anyone can read and Pith papers without signing in.