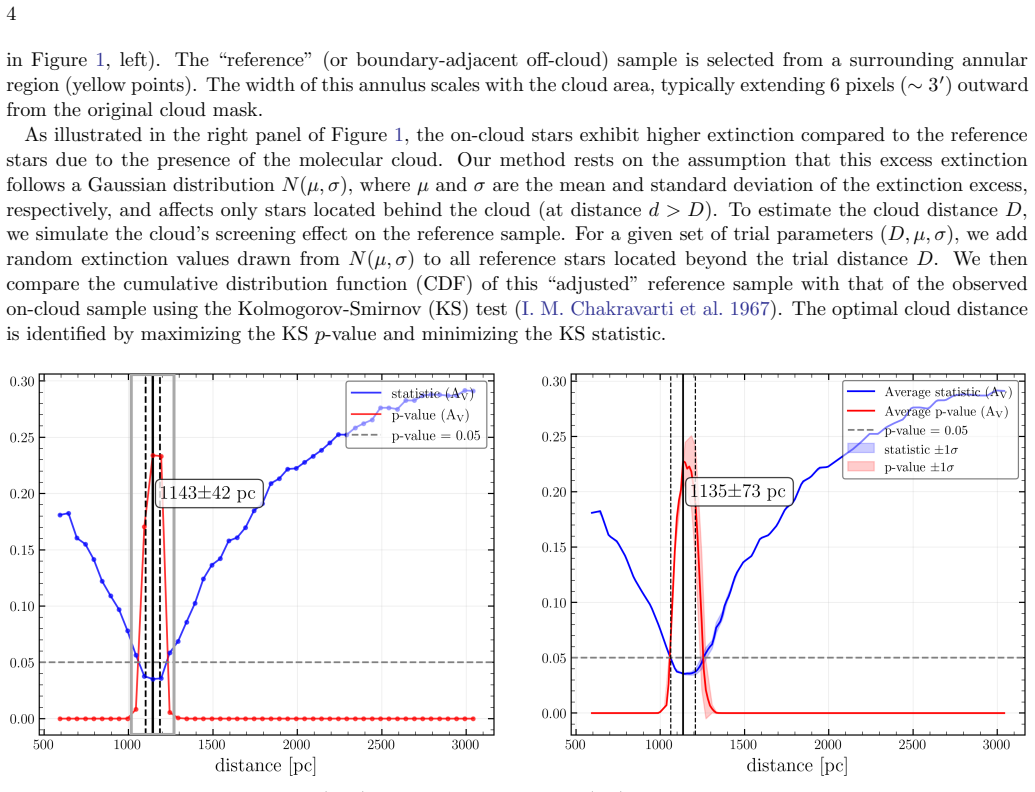
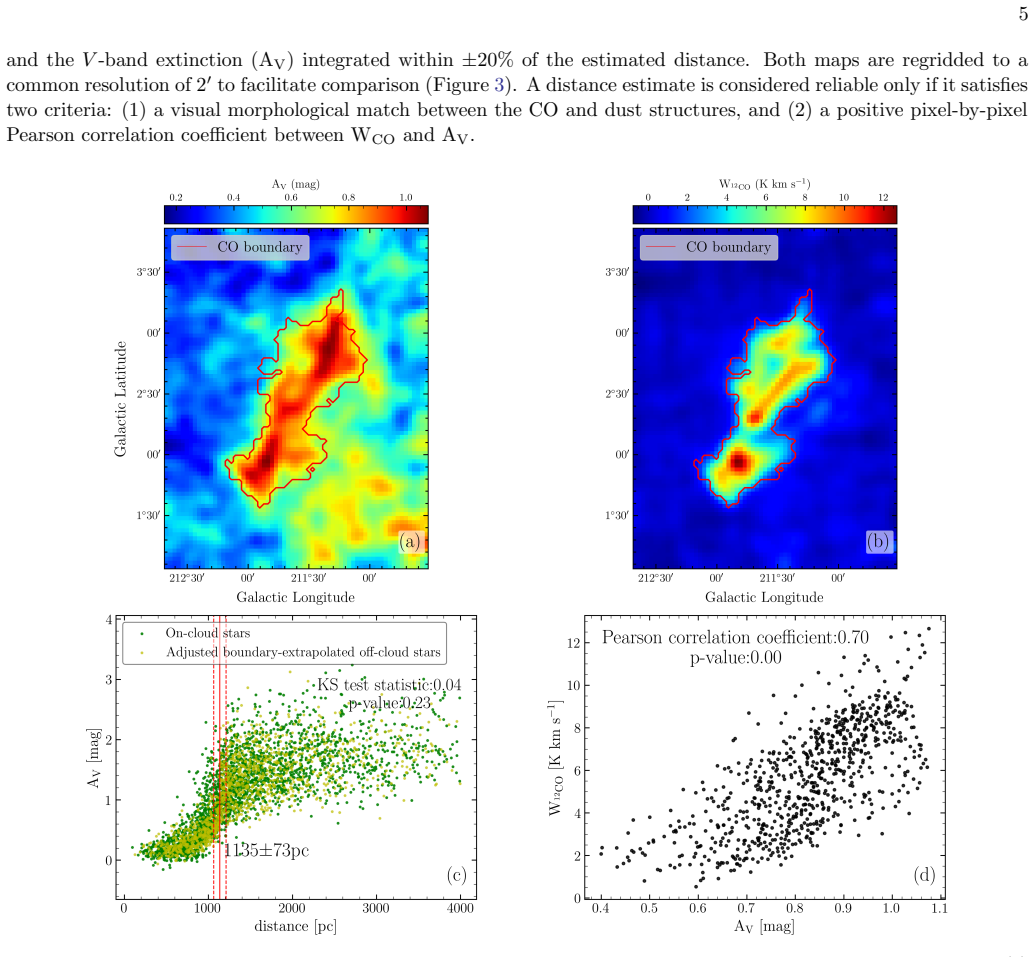
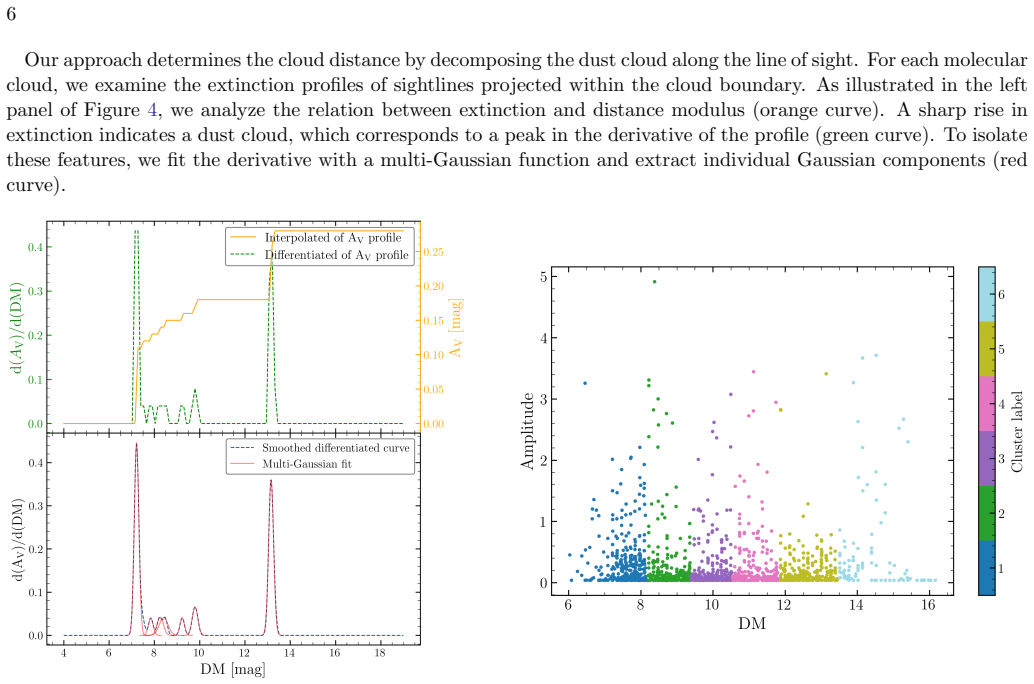
A study of the Physical Properties and Star Formation Activity of a Large Sample of Molecular Clouds: I Distances
Pith reviewed 2026-06-28 14:04 UTC · model grok-4.3
The pith
Matching CO intensity maps to 3D dust extinction maps yields distances for 1573 molecular clouds.
A machine-rendered reading of the paper's core claim, the machinery that carries it, and where it could break.
Core claim
We propose three independent methods, all of which match the molecular cloud's velocity-integrated intensity maps of 12CO lines from the MWISP with the three-dimensional dust extinction maps derived from Gaia, Pan-STARRS 1, and 2MASS, to determine molecular cloud distances. We present a catalog of 1,573 molecular clouds with robust distances ranging from approximately 150 pc to 3000 pc, 90 percent of which are measured for the first time, with typical statistical and systematic uncertainties of approximately 20% and 10%, respectively. We also derive their physical properties, such as their mass and sizes.
What carries the argument
Matching velocity-integrated 12CO intensity maps to three-dimensional dust extinction maps from Gaia, Pan-STARRS 1, and 2MASS.
If this is right
- Masses and sizes can be computed for each of the 1573 clouds once distances are assigned.
- The catalog supplies a data set for testing molecular cloud scaling relations.
- Cloud conditions can be compared to star formation activity across different Galactic locations.
- The distances support mapping of Galactic spiral structure.
Where Pith is reading between the lines
- The same matching approach could be tested on other large CO surveys to expand the sample.
- Future Gaia data releases might reduce the statistical uncertainties below the current 20 percent level.
- If distances prove consistent with other tracers, the catalog could anchor comparisons between molecular gas and young stellar populations.
Load-bearing premise
The CO emission structures line up with the dust extinction features closely enough that overlaps along the line of sight and differences between gas and dust distributions do not create large distance errors.
What would settle it
A large fraction of the clouds showing distances that disagree with independent checks such as stellar parallax measurements or kinematic distances from other gas tracers.
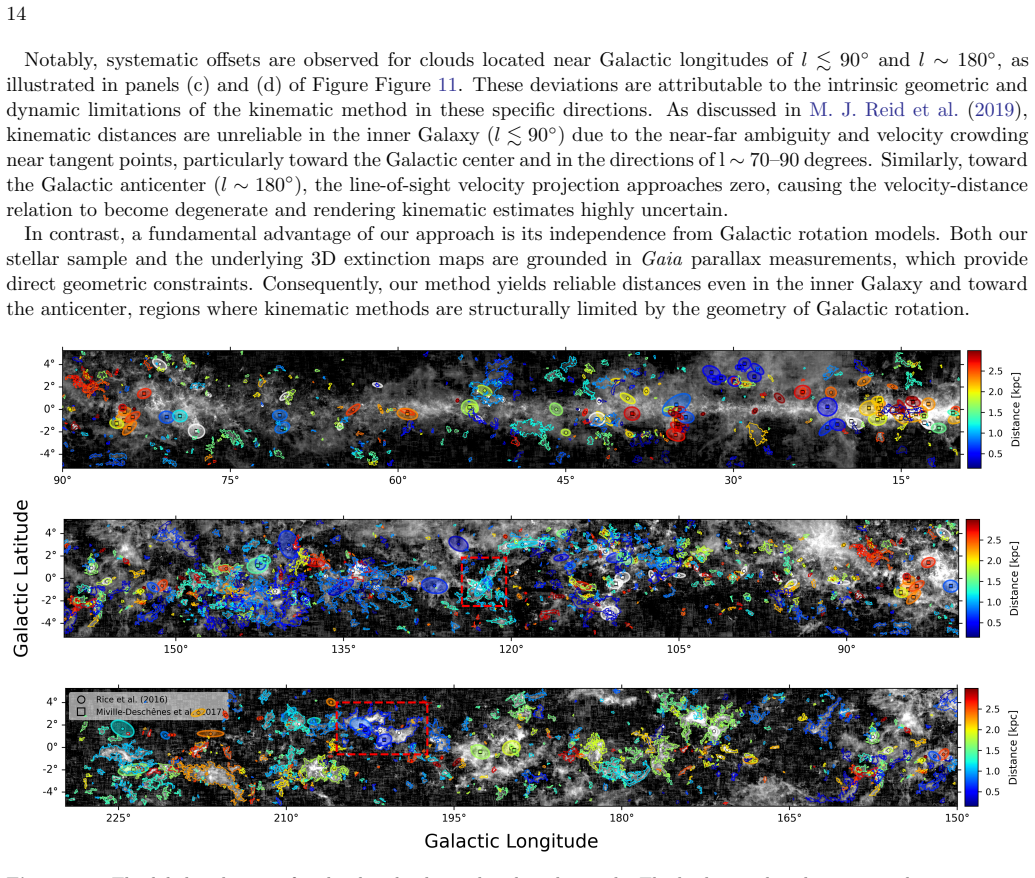
Figures


read the original abstract
Accurate distances to molecular clouds are crucial for determining their physical properties, understanding star formation, and tracing Galactic spiral structure. A number of 103,517 molecular clouds has been identified by the DBSCAN algorithm in the MWISP Phase I CO survey (l = 9.75-229.75 deg, |b| <= 5.25 deg), most of which lack reliable distances. In this work, we propose three independent methods, all of which match the molecular cloud's velocity-integrated intensity maps of 12CO lines from the MWISP with the three-dimensional dust extinction maps derived from Gaia, Pan-STARRS 1, and 2MASS, to determine molecular cloud distances. We present a catalog of 1,573 molecular clouds with robust distances ranging from approximately 150 pc to 3000 pc, 90 percent of which are measured for the first time, with typical statistical and systematic uncertainties of approximately 20% and 10%, respectively. We also derive their physical properties, such as their mass and sizes. This publicly available catalog of molecular clouds with distances provides a foundation for testing molecular cloud scaling relations and probing how cloud conditions influence star formation across diverse Galactic environments.
Editorial analysis
A structured set of objections, weighed in public.
Referee Report
Summary. The manuscript identifies 103,517 molecular clouds via DBSCAN in the MWISP Phase I 12CO survey (l=9.75–229.75°, |b|≤5.25°) and develops three independent methods that match each cloud's velocity-integrated 12CO intensity map against 3D dust extinction cubes from Gaia, Pan-STARRS 1, and 2MASS to assign distances. It delivers a catalog of 1,573 clouds (90 % new) spanning ~150–3000 pc with quoted typical uncertainties of 20 % statistical and 10 % systematic, plus derived masses and sizes.
Significance. A vetted catalog of this size with homogeneous distances would enable statistical tests of cloud scaling relations and environment-dependent star formation across a wide Galactic baseline. The multi-survey matching approach and public release are constructive; however, the result's utility hinges on whether the matching procedure demonstrably recovers correct distances amid line-of-sight overlaps.
major comments (3)
- [Abstract] Abstract: the assertion that the three methods yield 'robust distances' with 20 % / 10 % uncertainties is unsupported by any reported validation (recovery tests on synthetic multi-layer sightlines, comparison to parallax or kinematic distances for a control sample, or quantitative assessment of projection coincidences).
- [Abstract] Abstract / Methods description: velocity-integrated maps discard the PPV information used in the original DBSCAN cloud identification; no test is described that quantifies the fraction of sightlines where multiple extinction layers or velocity-crowded components produce ambiguous matches.
- [Abstract] Abstract: the one-to-one spatial correspondence between integrated CO morphology and a single dust feature is assumed without demonstrated safeguards against differential gas-dust distributions or chance alignments in the crowded inner Galaxy strip.
minor comments (1)
- [Abstract] The abstract states that physical properties (mass, size) are derived but does not specify the adopted CO-to-H2 conversion factor or how distance uncertainty propagates into those quantities.
Simulated Author's Rebuttal
We thank the referee for their careful reading and constructive comments. We address each major comment below and have revised the manuscript to incorporate additional validation and clarifications.
read point-by-point responses
-
Referee: [Abstract] Abstract: the assertion that the three methods yield 'robust distances' with 20 % / 10 % uncertainties is unsupported by any reported validation (recovery tests on synthetic multi-layer sightlines, comparison to parallax or kinematic distances for a control sample, or quantitative assessment of projection coincidences).
Authors: We agree that the abstract claim requires explicit supporting validation. The revised manuscript adds a dedicated validation section presenting recovery tests on synthetic multi-layer sightlines, direct comparisons to Gaia parallax distances for a control sample, and a quantitative assessment of projection coincidences. These tests underpin the quoted statistical and systematic uncertainties. revision: yes
-
Referee: [Abstract] Abstract / Methods description: velocity-integrated maps discard the PPV information used in the original DBSCAN cloud identification; no test is described that quantifies the fraction of sightlines where multiple extinction layers or velocity-crowded components produce ambiguous matches.
Authors: DBSCAN was performed in full PPV space to isolate velocity-coherent structures; the integrated maps are used only for spatial matching to the velocity-unresolved extinction cubes. The revision adds a quantitative test that measures the fraction of sightlines showing multiple extinction layers or velocity crowding and evaluates the resulting ambiguity rate against the original PPV cubes. revision: yes
-
Referee: [Abstract] Abstract: the one-to-one spatial correspondence between integrated CO morphology and a single dust feature is assumed without demonstrated safeguards against differential gas-dust distributions or chance alignments in the crowded inner Galaxy strip.
Authors: The three independent dust surveys already provide cross-validation against chance alignments. The revision adds explicit discussion of differential gas-dust effects and inner-Galaxy crowding, together with quantitative checks that require consistency across the three methods and flag potential ambiguous cases. revision: yes
Circularity Check
No circularity; distances from external map matching
full rationale
The derivation assigns distances by matching integrated 12CO maps to independent 3D extinction cubes from Gaia/Pan-STARRS/2MASS. No equations, fitted parameters, or self-citations are shown that reduce the output distances or catalog to the input cloud properties by construction. The method is presented as observational cross-matching, and the subsequent physical properties follow directly from those distances without load-bearing internal loops.
Axiom & Free-Parameter Ledger
axioms (1)
- domain assumption Three-dimensional dust extinction maps from Gaia, Pan-STARRS 1, and 2MASS accurately trace the spatial distribution of material associated with the identified molecular clouds.
Reference graph
Works this paper leans on
-
[1]
Anders, F., Khalatyan, A., Queiroz, A. B. A., et al. 2022, A&A, 658, A91, doi: 10.1051/0004-6361/202142369 Astropy Collaboration, Price-Whelan, A. M., Lim, P. L., et al. 2022, ApJ, 935, 167, doi: 10.3847/1538-4357/ac7c74
-
[2]
2013, ApJ, 768, 132, doi: 10.1088/0004-637X/768/2/132
Bauermeister, A., Blitz, L., Bolatto, A., et al. 2013, ApJ, 768, 132, doi: 10.1088/0004-637X/768/2/132
-
[3]
Blitz, L., & Williams, J. P. 1999, in NATO Advanced Study Institute (ASI) Series C, Vol. 540, The Origin of Stars and Planetary Systems, ed. C. J. Lada & N. D. Kylafis, 3
1999
-
[4]
1993, A&A, 275, 67
Brand, J., & Blitz, L. 1993, A&A, 275, 67
1993
-
[5]
Castro-Ginard, A., McMillan, P. J., Luri, X., et al. 2021, A&A, 652, A162, doi: 10.1051/0004-6361/202039751
-
[6]
M., Laha, R
Chakravarti, I. M., Laha, R. G., & Roy, J. 1967, Handbook of Methods of Applied Statistics, Volume 1: Techniques of Computation (New York: John Wiley & Sons)
1967
-
[7]
2020, MNRAS, 496, 4637, doi: 10.1093/mnras/staa1827
Chen, B., Wang, S., Hou, L., et al. 2020, MNRAS, 496, 4637, doi: 10.1093/mnras/staa1827
-
[8]
Chen, B. Q., Huang, Y., Hou, L. G., et al. 2019, MNRAS, 487, 1400, doi: 10.1093/mnras/stz1357
-
[9]
Chen, B. Q., Li, G. X., Yuan, H. B., et al. 2020, MNRAS, 493, 351, doi: 10.1093/mnras/staa235
-
[10]
The Milky Way in Molecular Clouds: A New Complete CO Survey
Dame, T. M., Hartmann, D., & Thaddeus, P. 2001, ApJ, 547, 792, doi: 10.1086/318388
work page internal anchor Pith review doi:10.1086/318388 2001
-
[11]
Summary of the contents and survey properties
Ester, M., Kriegel, H.-P., Sander, J., & Xu, X. 1996, in Second International Conference on Knowledge Discovery and Data Mining (KDD’96). Proceedings of a conference held August 2-4, 226–331 Gaia Collaboration, Brown, A. G. A., Vallenari, A., et al. 2021, A&A, 649, A1, doi: 10.1051/0004-6361/202039657
-
[12]
2019, ApJ, 887, 93, doi: 10.3847/1538-4357/ab5362
Finkbeiner, D. 2019, ApJ, 887, 93, doi: 10.3847/1538-4357/ab5362
work page internal anchor Pith review doi:10.3847/1538-4357/ab5362 2019
-
[13]
Guo, H. L., Chen, B. Q., & Liu, X. W. 2022, MNRAS, 511, 2302, doi: 10.1093/mnras/stac213
-
[14]
Guo, H. L., Chen, B. Q., Yuan, H. B., et al. 2021, ApJ, 906, 47, doi: 10.3847/1538-4357/abc68a
-
[15]
Harris, C. R., Millman, K. J., van der Walt, S. J., et al. 2020, Nature, 585, 357, doi: 10.1038/s41586-020-2649-2 18
-
[16]
Heyer, M., & Dame, T. M. 2015, ARA&A, 53, 583, doi: 10.1146/annurev-astro-082214-122324
-
[17]
Hunter, J. D. 2007, Computing in Science and Engineering, 9, 90, doi: 10.1109/MCSE.2007.55
-
[18]
Kennicutt, R. C., & Evans, N. J. 2012, ARA&A, 50, 531, doi: 10.1146/annurev-astro-081811-125610
work page internal anchor Pith review doi:10.1146/annurev-astro-081811-125610 2012
-
[19]
Lallement, R., Babusiaux, C., Vergely, J. L., et al. 2019, A&A, 625, A135, doi: 10.1051/0004-6361/201834695
-
[20]
2022, arXiv e-prints, arXiv:2206.05796, doi: 10.48550/arXiv.2206.05796
Marton, G., ´Abrah´ am, P., Rimoldini, L., et al. 2022, arXiv e-prints, arXiv:2206.05796, doi: 10.48550/arXiv.2206.05796
-
[21]
Malicious User Experience Design Research for Cybersecurity
McKee, C. F., & Ostriker, E. C. 2007, ARA&A, 45, 565, doi: 10.1146/annurev.astro.45.051806.110602
work page internal anchor Pith review Pith/arXiv arXiv doi:10.1146/annurev.astro.45.051806.110602 2007
-
[22]
Mei, J., Chen, Z., Jiang, Z., Zheng, S., & Feng, H. 2024, A&A, 685, A39, doi: 10.1051/0004-6361/202347952 Miville-Deschˆ enes, M.-A., Murray, N., & Lee, E. J. 2017, ApJ, 834, 57, doi: 10.3847/1538-4357/834/1/57
-
[23]
Queiroz, A. B. A., Anders, F., Santiago, B. X., et al. 2018, MNRAS, 476, 2556, doi: 10.1093/mnras/sty330
-
[24]
Reid, M. J., Menten, K. M., Brunthaler, A., et al. 2014, ApJ, 783, 130, doi: 10.1088/0004-637X/783/2/130
-
[25]
Reid, M. J., Menten, K. M., Brunthaler, A., et al. 2019, ApJ, 885, 131, doi: 10.3847/1538-4357/ab4a11
-
[26]
Rice, T. S., Goodman, A. A., Bergin, E. A., Beaumont, C., & Dame, T. M. 2016, ApJ, 822, 52, doi: 10.3847/0004-637X/822/1/52
-
[27]
Russeil, D., Adami, C., & Georgelin, Y. M. 2007, A&A, 470, 161, doi: 10.1051/0004-6361:20066051
-
[28]
2019, ApJS, 240, 9, doi: 10.3847/1538-4365/aaf1c8
Su, Y., Yang, J., Zhang, S., et al. 2019, ApJS, 240, 9, doi: 10.3847/1538-4365/aaf1c8
-
[29]
2020, ApJ, 893, 91, doi: 10.3847/1538-4357/ab7fff
Su, Y., Yang, J., Yan, Q.-Z., et al. 2020, ApJ, 893, 91, doi: 10.3847/1538-4357/ab7fff
-
[30]
2024, AJ, 168, 203, doi: 10.3847/1538-3881/ad7b2f
Sun, M., Jiang, B., Guo, H., & Cui, W. 2024, AJ, 168, 203, doi: 10.3847/1538-3881/ad7b2f
-
[31]
2021a, ApJS, 254, 38, doi: 10.3847/1538-4365/abf929
Sun, M., Jiang, B., Yuan, H., & Li, J. 2021a, ApJS, 254, 38, doi: 10.3847/1538-4365/abf929
-
[32]
2021b, ApJS, 256, 46, doi: 10.3847/1538-4365/ac1601
Sun, M., Jiang, B., Zhao, H., & Ren, Y. 2021b, ApJS, 256, 46, doi: 10.3847/1538-4365/ac1601
-
[33]
Vergely, J. L., Lallement, R., & Cox, N. L. J. 2022, A&A, 664, A174, doi: 10.1051/0004-6361/202243319
-
[34]
2025a, ApJS, 280, 16, doi: 10.3847/1538-4365/aded89
Wang, T., Yuan, H., Chen, B., et al. 2025a, ApJS, 280, 16, doi: 10.3847/1538-4365/aded89
-
[35]
2025b, ApJS, 280, 15, doi: 10.3847/1538-4365/adea39
Wang, T., Yuan, H., Chen, B., et al. 2025b, ApJS, 280, 15, doi: 10.3847/1538-4365/adea39
-
[36]
2024, ApJ, 975, 39, doi: 10.3847/1538-4357/ad7378
Xie, Y.-H., Li, G.-X., & Chen, B.-Q. 2024, ApJ, 975, 39, doi: 10.3847/1538-4357/ad7378
-
[37]
2018, Research in Astronomy and Astrophysics, 18, 146, doi: 10.1088/1674-4527/18/12/146
Xu, Y., Hou, L.-G., & Wu, Y.-W. 2018, Research in Astronomy and Astrophysics, 18, 146, doi: 10.1088/1674-4527/18/12/146
-
[38]
Xu, Y., Reid, M. J., Zheng, X. W., & Menten, K. M. 2006, Science, 311, 54, doi: 10.1126/science.1120914
-
[39]
2020, ApJ, 898, 80, doi: 10.3847/1538-4357/ab9f9c
Yan, Q.-Z., Yang, J., Su, Y., Sun, Y., & Wang, C. 2020, ApJ, 898, 80, doi: 10.3847/1538-4357/ab9f9c
-
[40]
2021, ApJ, 922, 8, doi: 10.3847/1538-4357/ac214f
Yan, Q.-Z., Yang, J., Su, Y., et al. 2021, ApJ, 922, 8, doi: 10.3847/1538-4357/ac214f
-
[41]
2019, ApJ, 885, 19, doi: 10.3847/1538-4357/ab458e
Yan, Q.-Z., Yang, J., Sun, Y., Su, Y., & Xu, Y. 2019, ApJ, 885, 19, doi: 10.3847/1538-4357/ab458e
-
[42]
2026, ApJS, 282, 65, doi: 10.3847/1538-4365/ae29e7
Yang, J., Yan, Q.-Z., Su, Y., et al. 2026, ApJS, 282, 65, doi: 10.3847/1538-4365/ae29e7
-
[43]
Zhang, M. 2023, ApJS, 265, 59, doi: 10.3847/1538-4365/acc1e8
-
[44]
2024, AJ, 167, 220, doi: 10.3847/1538-3881/ad2fcb
Zhang, S., Su, Y., Chen, X., et al. 2024, AJ, 167, 220, doi: 10.3847/1538-3881/ad2fcb
-
[45]
2025, AJ, 170, 185, doi: 10.3847/1538-3881/adf49b
Zhang, S., Su, Y., Chen, X., et al. 2025, AJ, 170, 185, doi: 10.3847/1538-3881/adf49b
-
[46]
2024, ApJ, 966, 202, doi: 10.3847/1538-4357/ad3552
Zhuang, Z., Su, Y., Zhang, S., et al. 2024, ApJ, 966, 202, doi: 10.3847/1538-4357/ad3552
-
[47]
Zucker, C., Speagle, J. S., Schlafly, E. F., et al. 2020, A&A, 633, A51, doi: 10.1051/0004-6361/201936145
-
[48]
Zucker, C., Speagle, J. S., Schlafly, E. F., et al. 2019, ApJ, 879, 125, doi: 10.3847/1538-4357/ab2388
discussion (0)
Sign in with ORCID, Apple, or X to comment. Anyone can read and Pith papers without signing in.