Disentangling Visual and Factual Correctness in LVLMs' Visualization Literacy
Pith reviewed 2026-06-28 11:17 UTC · model grok-4.3
The pith
High accuracy on visualization tests does not prove LVLMs reason from charts rather than memorized facts.
A machine-rendered reading of the paper's core claim, the machinery that carries it, and where it could break.
Core claim
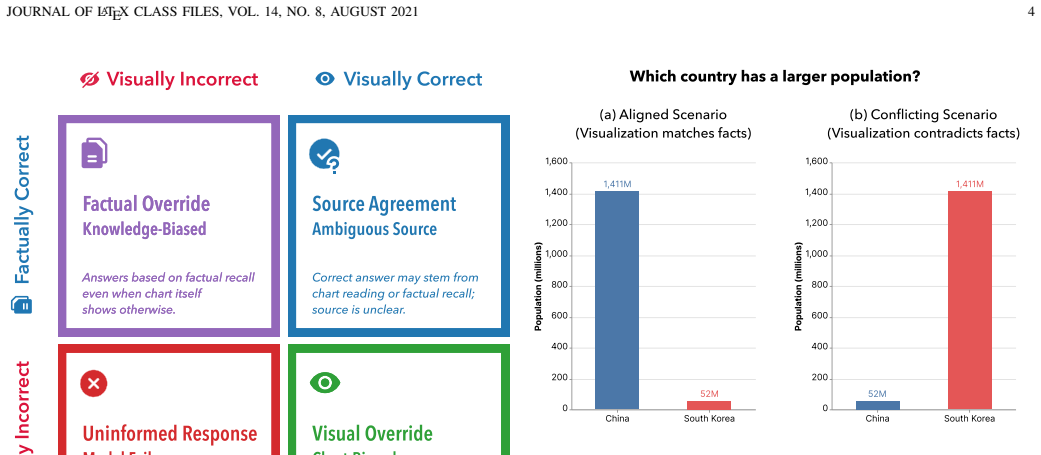
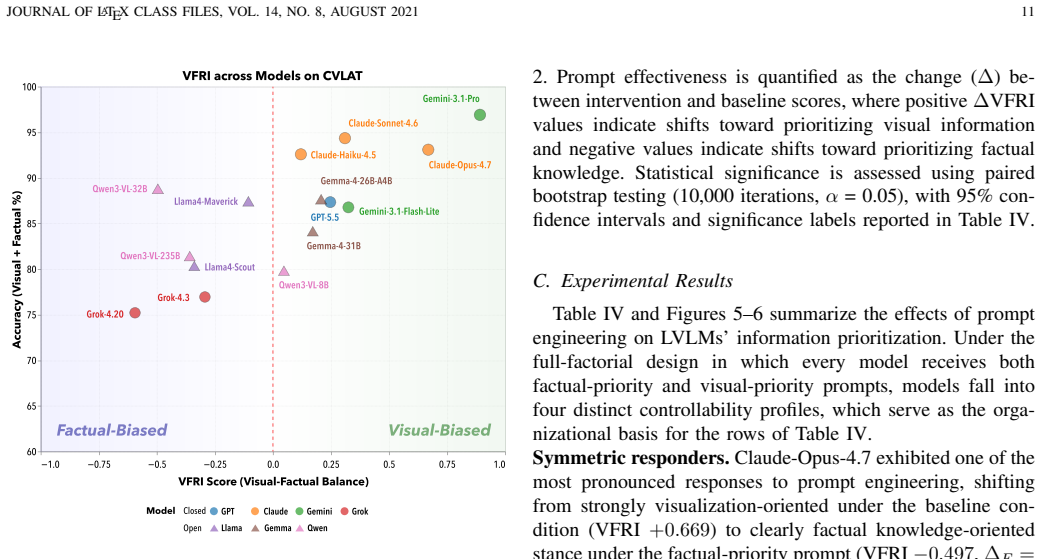
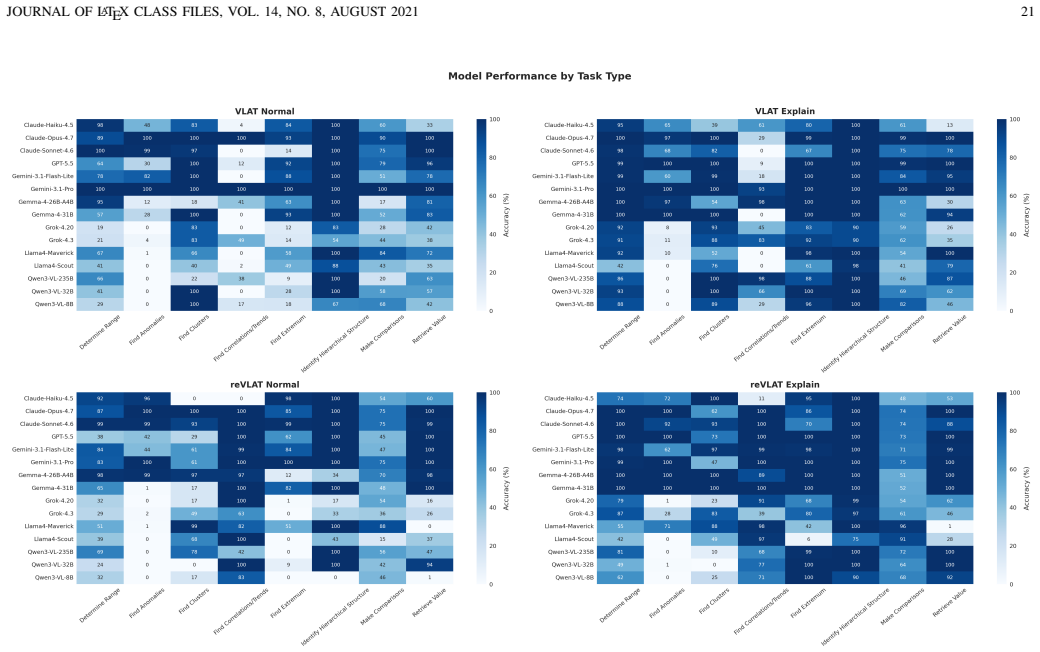
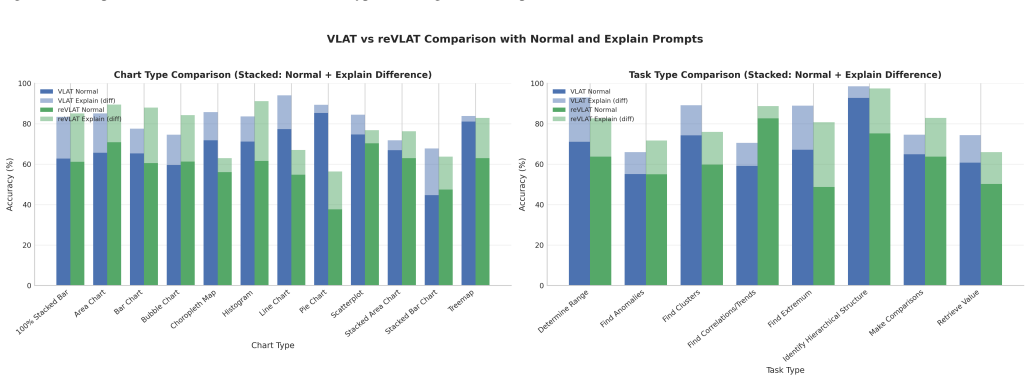
Standard tests such as VLAT mix visual interpretation with factual recall, so correct answers do not guarantee that a model has read the chart. CVLAT counters this by creating items where visual data directly contradicts factual priors and introduces a visual-factual reliance index to classify models by which source they follow. Experiments show a visualization-oriented majority, a factual-oriented minority, and several near-zero cases; prompt interventions alter prioritization in a model-specific and direction-asymmetric way; and humans consistently follow visual evidence when the two sources diverge.
What carries the argument
The Counterfactual Visualization Literacy Assessment Test (CVLAT) together with capability-normalized arbitration metrics and the visual-factual reliance index (VFRI) that quantifies whether a model prioritizes visual evidence or factual priors under direct conflict.
If this is right
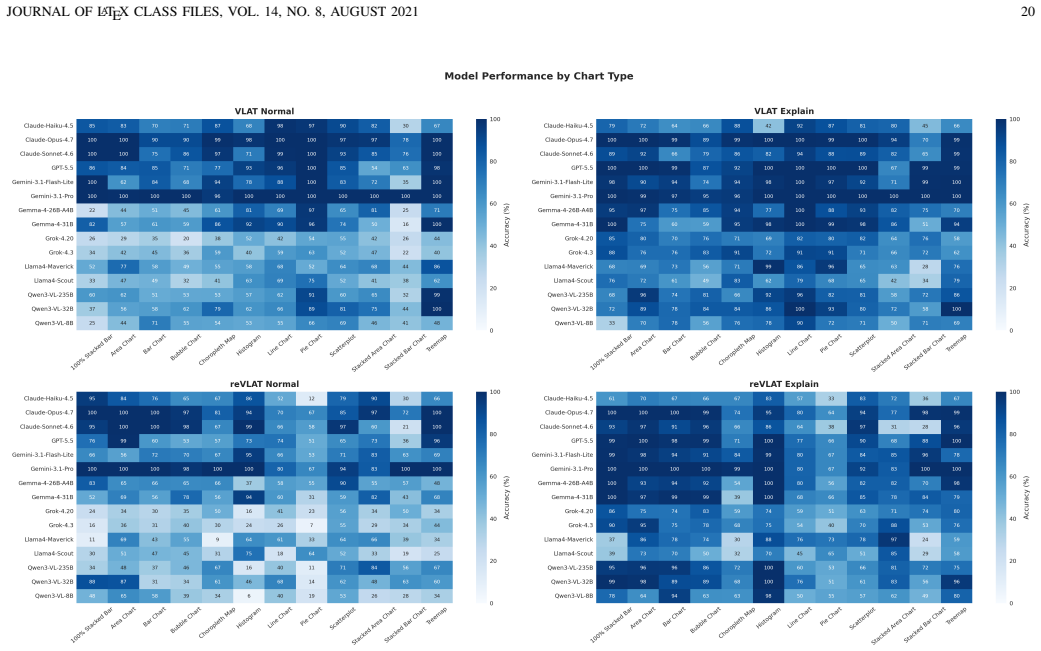
- Models that match human performance on VLAT may still be relying on factual recall rather than chart interpretation.
- Randomized-data variants such as reVLAT can underestimate literacy when factual priors override correct visual readings.
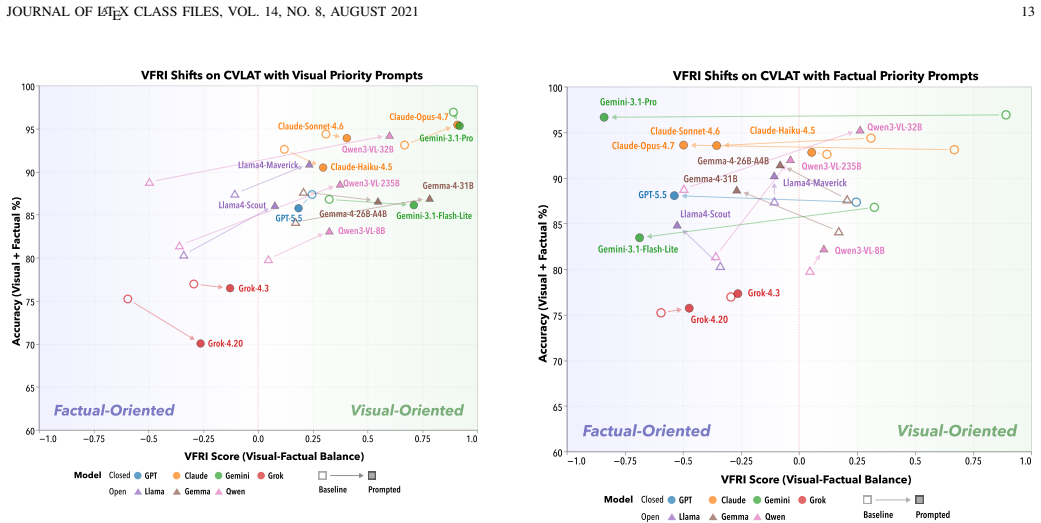
- Prompt interventions can change which source a model follows, but success depends on the specific model and direction of shift.
- High chart-reading accuracy does not predict how controllable a model is through prompting.
- Integration of LVLMs into visual analytics requires separate measurement of arbitration behavior between visual evidence and priors.
Where Pith is reading between the lines
- Benchmarks for multimodal models should routinely include conflict cases to verify that visual inputs can override stored knowledge.
- Similar counterfactual designs could be applied to other tasks such as visual question answering where image content and world knowledge diverge.
- Model developers could use VFRI-style metrics to select or fine-tune models for applications where new visual data must take precedence.
- The observed human-model gap suggests that alignment techniques might usefully reward chart-following behavior in conflict situations.
Load-bearing premise
The counterfactual charts and questions isolate visual correctness from factual correctness without introducing biases from phrasing, design, or data choice.
What would settle it
If every model that scores at human level on standard VLAT also shows strong positive VFRI on CVLAT items, then high accuracy on existing tests would already indicate faithful visual reasoning.
Figures

read the original abstract
Large Vision-Language Models (LVLMs) show strong visualization interpretation, yet it is unclear whether their responses reflect genuine reasoning over visual evidence or factual priors learned during training. Current evaluations mix these two sources, obscuring when correct visual interpretation is overridden by memorized facts. We present a framework that isolates visual correctness from factual correctness, revealing validity limitations in existing visualization literacy assessments. Across three experiments with 15 state-of-the-art LVLMs: (1) several models reach human-level performance on standard tests (VLAT), but this may reflect factual recall rather than visual understanding, while randomized-data tests (reVLAT) underestimate literacy when correct visual interpretation is superseded by factual priors. (2) Using our Counterfactual Visualization Literacy Assessment Test (CVLAT) with capability-normalized arbitration metrics, we classify models by the sign of their visual-factual reliance index (VFRI), revealing a visualization-oriented majority and a factual knowledge-oriented minority, though several near-zero cases warrant caution. A human baseline (N=30) on the same counterfactual items confirms that people overwhelmingly follow the chart under conflict, providing a human reference point. (3) Prompt-based intervention can shift prioritization, but its effectiveness is highly model-dependent and direction-asymmetric, and high chart-reading capability does not predict prompt-controllability. Overall, high visualization accuracy is not sufficient evidence of faithful visual reasoning: reliable integration into visual analytics requires evaluating not only visualization literacy but also how models arbitrate between visual evidence and factual priors when the two diverge. Benchmark and code: https://github.com/JaeyoungKim-HCIL/CVLAT
Editorial analysis
A structured set of objections, weighed in public.
Referee Report
Summary. The paper claims that standard visualization literacy tests like VLAT conflate visual reasoning with factual recall in LVLMs. It introduces the Counterfactual Visualization Literacy Assessment Test (CVLAT) and a Visual-Factual Reliance Index (VFRI) to classify 15 models by whether they prioritize chart evidence or memorized facts under conflict, reports that a human baseline (N=30) follows the chart, finds prompt interventions are model-dependent and asymmetric, and concludes that high VLAT accuracy is insufficient evidence of faithful visual reasoning.
Significance. If the CVLAT items validly isolate the two sources without confounds, the work would usefully demonstrate that existing benchmarks are incomplete for visual analytics applications and supply a new evaluation axis plus open benchmark/code for reproducibility. The empirical classification of models and the human reference point would be the primary contributions.
major comments (3)
- [CVLAT construction] CVLAT construction (methods/experiments section): no quantitative validation is reported for successful isolation (e.g., human neutrality ratings on question phrasing, checks that randomized data do not correlate with common priors, or conflict-strength metrics). This is load-bearing for attributing VFRI signs to arbitration rather than artifacts and for the claim that reVLAT underestimates literacy.
- [VFRI computation] VFRI definition and computation (results/experiments 2): the capability-normalized arbitration metrics and exact formula for the sign of VFRI are not specified, nor are response exclusion rules or statistical controls; without these the reported visualization-oriented majority and near-zero cases cannot be verified.
- [Human baseline] Human baseline (experiment 3): exclusion rules, statistical controls, and inter-participant agreement metrics for the N=30 sample are not described, which is load-bearing for using the baseline as a reference that “people overwhelmingly follow the chart.”
minor comments (2)
- [Abstract] The acronym reVLAT is introduced in the abstract without expansion or prior definition.
- [Abstract / conclusion] The GitHub release is mentioned but the manuscript does not enumerate exactly which artifacts (raw responses, prompts, randomization seeds, or analysis scripts) are provided.
Simulated Author's Rebuttal
We thank the referee for the detailed and constructive comments. We agree that several methodological details require clarification and will revise the manuscript accordingly to strengthen the presentation of CVLAT construction, VFRI computation, and the human baseline.
read point-by-point responses
-
Referee: [CVLAT construction] CVLAT construction (methods/experiments section): no quantitative validation is reported for successful isolation (e.g., human neutrality ratings on question phrasing, checks that randomized data do not correlate with common priors, or conflict-strength metrics). This is load-bearing for attributing VFRI signs to arbitration rather than artifacts and for the claim that reVLAT underestimates literacy.
Authors: We acknowledge the absence of explicit quantitative validation metrics in the current manuscript. In the revision we will add human neutrality ratings on question phrasing, correlation analysis between randomized data and common priors, and conflict-strength metrics to demonstrate successful isolation of visual and factual sources. revision: yes
-
Referee: [VFRI computation] VFRI definition and computation (results/experiments 2): the capability-normalized arbitration metrics and exact formula for the sign of VFRI are not specified, nor are response exclusion rules or statistical controls; without these the reported visualization-oriented majority and near-zero cases cannot be verified.
Authors: We agree that the exact formula, capability-normalized metrics, exclusion rules, and statistical controls were insufficiently specified. The revised manuscript will include the full mathematical definition of VFRI, the arbitration metric formulas, exclusion criteria, and any statistical controls applied. revision: yes
-
Referee: [Human baseline] Human baseline (experiment 3): exclusion rules, statistical controls, and inter-participant agreement metrics for the N=30 sample are not described, which is load-bearing for using the baseline as a reference that “people overwhelmingly follow the chart.”
Authors: We will add the requested details on exclusion rules, statistical controls, and inter-participant agreement metrics (e.g., Fleiss' kappa or similar) for the N=30 human baseline in the revised version to support the reported findings. revision: yes
Circularity Check
No significant circularity: purely empirical evaluation with external human baseline
full rationale
The paper presents an empirical framework (VLAT, reVLAT, CVLAT) for testing LVLMs on visualization literacy under visual-factual conflicts, with results benchmarked against a human baseline (N=30). No derivations, equations, fitted parameters, or self-citation chains are present that reduce any claim to its own inputs by construction. The central claims rest on experimental measurements and external human reference points rather than internal loops, satisfying the criteria for a self-contained empirical study.
Axiom & Free-Parameter Ledger
invented entities (2)
-
CVLAT
no independent evidence
-
VFRI
no independent evidence
Reference graph
Works this paper leans on
-
[1]
Phenoflow: A human-llm driven visual analytics system for exploring large and complex stroke datasets,
J. Kim, S. Lee, H. Jeon, K.-J. Lee, H.-J. Bae, B. Kim, and J. Seo, “Phenoflow: A human-llm driven visual analytics system for exploring large and complex stroke datasets,”IEEE Transactions on Visualization and Computer Graphics, 2024. JOURNAL OF LATEX CLASS FILES, VOL. 14, NO. 8, AUGUST 2021 16
2024
-
[2]
Data formulator: Ai-powered concept-driven visualization authoring,
C. Wang, J. Thompson, and B. Lee, “Data formulator: Ai-powered concept-driven visualization authoring,”IEEE Transactions on Visual- ization and Computer Graphics, vol. 30, no. 1, pp. 1128–1138, 2023
2023
-
[3]
Data for- mulator 2: Iterative creation of data visualizations, with ai transforming data along the way,
C. Wang, B. Lee, S. M. Drucker, D. Marshall, and J. Gao, “Data for- mulator 2: Iterative creation of data visualizations, with ai transforming data along the way,” inProceedings of the 2025 CHI Conference on Human Factors in Computing Systems, 2025, pp. 1–17
2025
-
[4]
Chartgpt: Leveraging llms to generate charts from abstract natural language,
Y . Tian, W. Cui, D. Deng, X. Yi, Y . Yang, H. Zhang, and Y . Wu, “Chartgpt: Leveraging llms to generate charts from abstract natural language,”IEEE Transactions on Visualization and Computer Graphics, 2024
2024
-
[5]
Chat2vis: Generating data visualizations via natural language using chatgpt, codex and gpt-3 large language models,
P. Maddigan and T. Susnjak, “Chat2vis: Generating data visualizations via natural language using chatgpt, codex and gpt-3 large language models,”Ieee Access, vol. 11, pp. 45 181–45 193, 2023
2023
-
[6]
V . Dibia, “Lida: A tool for automatic generation of grammar-agnostic visualizations and infographics using large language models,”arXiv preprint arXiv:2303.02927, 2023
-
[7]
Interchat: Enhancing generative visual analytics using multimodal interactions,
J. Chen, J. Wu, J. Guo, V . Mohanty, X. Li, J. P. Ono, W. He, L. Ren, and D. Liu, “Interchat: Enhancing generative visual analytics using multimodal interactions,”arXiv preprint arXiv:2503.04110, 2025
-
[8]
Can vlms assess similarity between graph visualizations?
S. Jung, H. Jeon, J. Rhee, and J. Seo, “Can vlms assess similarity between graph visualizations?”arXiv preprint arXiv:2504.09859, 2025
-
[9]
Scientific figures interpreted by chatgpt: strengths in plot recognition and limits in color perception,
J. Wang, Q. Ye, L. Liu, N. L. Guo, and G. Hu, “Scientific figures interpreted by chatgpt: strengths in plot recognition and limits in color perception,”NPJ Precision Oncology, vol. 8, no. 1, p. 84, 2024
2024
-
[10]
An empirical evaluation of the gpt- 4 multimodal language model on visualization literacy tasks,
A. Bendeck and J. Stasko, “An empirical evaluation of the gpt- 4 multimodal language model on visualization literacy tasks,”IEEE Transactions on Visualization and Computer Graphics, 2024
2024
-
[11]
Do llms have visualiza- tion literacy? an evaluation on modified visualizations to test general- ization in data interpretation,
J. Hong, C. Seto, A. Fan, and R. Maciejewski, “Do llms have visualiza- tion literacy? an evaluation on modified visualizations to test general- ization in data interpretation,”IEEE Transactions on Visualization and Computer Graphics, 2025
2025
-
[12]
Benchmarking visual language mod- els on standardized visualization literacy tests,
S. Pandey and A. Ottley, “Benchmarking visual language mod- els on standardized visualization literacy tests,”arXiv preprint arXiv:2503.16632, 2025
-
[13]
Visualization literacy of multimodal large language models: A comparative study,
Z. Li, H. Miao, V . Pascucci, and S. Liu, “Visualization literacy of multimodal large language models: A comparative study,”arXiv preprint arXiv:2407.10996, 2024
-
[14]
How good (or bad) are llms at detecting misleading visualizations?
L. Y .-H. Lo and H. Qu, “How good (or bad) are llms at detecting misleading visualizations?”IEEE Transactions on Visualization and Computer Graphics, 2024
2024
-
[15]
Encqa: Bench- marking vision-language models on visual encodings for charts,
K. Mukherjee, D. Ren, D. Moritz, and Y . Assogba, “Encqa: Bench- marking vision-language models on visual encodings for charts,”arXiv preprint arXiv:2508.04650, 2025
-
[16]
J. Achiam, S. Adler, S. Agarwal, L. Ahmad, I. Akkaya, F. L. Aleman, D. Almeida, J. Altenschmidt, S. Altman, S. Anadkatet al., “Gpt-4 technical report,”arXiv preprint arXiv:2303.08774, 2023
work page internal anchor Pith review Pith/arXiv arXiv 2023
-
[17]
Claude 3 model family: Claude 3 opus, claude 3 sonnet, claude 3 haiku,
Anthropic, “Claude 3 model family: Claude 3 opus, claude 3 sonnet, claude 3 haiku,” Anthropic, Tech. Rep., 2024. [Online]. Available: https://www.anthropic.com/news/claude-3-family
2024
-
[18]
Gemini 1.5: Unlocking multimodal understanding across millions of tokens of context
G. Team, P. Georgiev, V . I. Lei, R. Burnell, L. Bai, A. Gulati, G. Tanzer, D. Vincent, Z. Pan, S. Wanget al., “Gemini 1.5: Unlocking multimodal understanding across millions of tokens of context,”arXiv preprint arXiv:2403.05530, 2024
work page internal anchor Pith review Pith/arXiv arXiv 2024
-
[19]
Vlat: Development of a visual- ization literacy assessment test,
S. Lee, S.-H. Kim, and B. C. Kwon, “Vlat: Development of a visual- ization literacy assessment test,”IEEE transactions on visualization and computer graphics, vol. 23, no. 1, pp. 551–560, 2016
2016
-
[20]
A principled way of assessing visualization literacy,
J. Boy, R. A. Rensink, E. Bertini, and J.-D. Fekete, “A principled way of assessing visualization literacy,”IEEE transactions on visualization and computer graphics, vol. 20, no. 12, pp. 1963–1972, 2014
1963
-
[21]
Investigating aspects of data visualization literacy using 20 information visualizations and 273 science museum visitors,
K. B ¨orner, A. Maltese, R. N. Balliet, and J. Heimlich, “Investigating aspects of data visualization literacy using 20 information visualizations and 273 science museum visitors,”Information Visualization, vol. 15, no. 3, pp. 198–213, 2016
2016
-
[22]
Data visualization literacy: Investigating data interpretation along the novice–expert continuum,
A. V . Maltese, J. A. Harsh, and D. Svetina, “Data visualization literacy: Investigating data interpretation along the novice–expert continuum,” Journal of College Science Teaching, vol. 45, no. 1, pp. 84–90, 2015
2015
-
[23]
Graph literacy: A cross-cultural comparison,
M. Galesic and R. Garcia-Retamero, “Graph literacy: A cross-cultural comparison,”Medical decision making, vol. 31, no. 3, pp. 444–457, 2011
2011
-
[24]
Special issue on visualization teaching and literacy,
B. Bach, S. Huron, U. Hinrichs, J. C. Roberts, and S. Carpendale, “Special issue on visualization teaching and literacy,”IEEE Computer Graphics and Applications, vol. 41, no. 06, pp. 13–14, 2021
2021
-
[25]
Mini-vlat: A short and effective measure of visualization literacy,
S. Pandey and A. Ottley, “Mini-vlat: A short and effective measure of visualization literacy,” inComputer Graphics Forum, vol. 42, no. 3. Wiley Online Library, 2023, pp. 1–11
2023
-
[26]
Calvi: Critical thinking assessment for literacy in visualizations,
L. W. Ge, Y . Cui, and M. Kay, “Calvi: Critical thinking assessment for literacy in visualizations,” inProceedings of the 2023 CHI conference on human factors in computing systems, 2023, pp. 1–18
2023
-
[27]
F. B. Baker,The basics of item response theory. ERIC, 2001
2001
-
[28]
Visual instruction tuning,
H. Liu, C. Li, Q. Wu, and Y . J. Lee, “Visual instruction tuning,” Advances in neural information processing systems, vol. 36, pp. 34 892– 34 916, 2023
2023
-
[29]
Leveraging multimodal llm for inspirational user interface search,
S. Park, Y . Song, S. Lee, J. Kim, and J. Seo, “Leveraging multimodal llm for inspirational user interface search,” inProceedings of the 2025 CHI Conference on Human Factors in Computing Systems, 2025, pp. 1–22
2025
-
[30]
Evochart: A benchmark and a self-training approach towards real- world chart understanding,
M. Huang, H. Lai, X. Zhang, W. Wu, J. Ma, L. Zhang, and J. Liu, “Evochart: A benchmark and a self-training approach towards real- world chart understanding,” inProceedings of the AAAI Conference on Artificial Intelligence, vol. 39, no. 4, 2025, pp. 3680–3688
2025
-
[31]
Charts-of-thought: Enhancing llm visualization literacy through structured data extraction,
A. K. Das, M. Tarun, and K. Mueller, “Charts-of-thought: Enhancing llm visualization literacy through structured data extraction,”IEEE Transactions on Visualization and Computer Graphics, 2025
2025
-
[32]
Chartin- sights: Evaluating multimodal large language models for low-level chart question answering,
Y . Wu, L. Yan, L. Shen, Y . Wang, N. Tang, and Y . Luo, “Chartin- sights: Evaluating multimodal large language models for low-level chart question answering,” inFindings of the Association for Computational Linguistics: EMNLP 2024, 2024, pp. 12 174–12 200
2024
-
[33]
Chartmoe: Mixture of diversely aligned expert connector for chart understanding,
Z. Xu, B. Qu, Y . Qi, S. Du, C. Xu, C. Yuan, and J. Guo, “Chartmoe: Mixture of diversely aligned expert connector for chart understanding,” arXiv preprint arXiv:2409.03277, 2024
-
[34]
Chartgemma: Visual instruction-tuning for chart reasoning in the wild,
A. Masry, M. Thakkar, A. Bajaj, A. Kartha, E. Hoque, and S. Joty, “Chartgemma: Visual instruction-tuning for chart reasoning in the wild,” inProceedings of the 31st International Conference on Computational Linguistics: Industry Track, 2025, pp. 625–643
2025
-
[35]
Chart-6: human-centered evaluation of data visualization understanding in vision- language models,
A. Verma, K. Mukherjee, C. Potts, E. Kreiss, and J. E. Fan, “Chart-6: human-centered evaluation of data visualization understanding in vision- language models,”arXiv preprint arXiv:2505.17202, 2025
-
[36]
Warning, bias may occur: A proposed approach to detecting cognitive bias in interactive visual analytics,
E. Wall, L. M. Blaha, L. Franklin, and A. Endert, “Warning, bias may occur: A proposed approach to detecting cognitive bias in interactive visual analytics,” in2017 ieee conference on visual analytics science and technology (vast). IEEE, 2017, pp. 104–115
2017
-
[37]
A task-based taxonomy of cognitive biases for information visual- ization,
E. Dimara, S. Franconeri, C. Plaisant, A. Bezerianos, and P. Dragicevic, “A task-based taxonomy of cognitive biases for information visual- ization,”IEEE transactions on visualization and computer graphics, vol. 26, no. 2, pp. 1413–1432, 2018
2018
-
[38]
Kahneman,Thinking, fast and slow
D. Kahneman,Thinking, fast and slow. macmillan, 2011
2011
-
[39]
Judgment under uncertainty: Heuristics and biases: Biases in judgments reveal some heuristics of thinking under uncertainty
A. Tversky and D. Kahneman, “Judgment under uncertainty: Heuristics and biases: Biases in judgments reveal some heuristics of thinking under uncertainty.”science, vol. 185, no. 4157, pp. 1124–1131, 1974
1974
-
[40]
The curse of knowledge in visual data communication,
C. Xiong, L. Van Weelden, and S. Franconeri, “The curse of knowledge in visual data communication,”IEEE transactions on visualization and computer graphics, vol. 26, no. 10, pp. 3051–3062, 2019
2019
-
[41]
Hallulens: Llm hallucination benchmark,
Y . Bang, Z. Ji, A. Schelten, A. Hartshorn, T. Fowler, C. Zhang, N. Cancedda, and P. Fung, “Hallulens: Llm hallucination benchmark,” arXiv preprint arXiv:2504.17550, 2025
-
[42]
Hallusionbench: an advanced diagnostic suite for entangled language hallucination and visual illusion in large vision-language models,
T. Guan, F. Liu, X. Wu, R. Xian, Z. Li, X. Liu, X. Wang, L. Chen, F. Huang, Y . Yacoobet al., “Hallusionbench: an advanced diagnostic suite for entangled language hallucination and visual illusion in large vision-language models,” inProceedings of the IEEE/CVF Conference on Computer Vision and Pattern Recognition, 2024, pp. 14 375–14 385
2024
-
[43]
B. Atil, S. Aykent, A. Chittams, L. Fu, R. J. Passonneau, E. Radcliffe, G. R. Rajagopal, A. Sloan, T. Tudrej, F. Tureet al., “Non-determinism of” deterministic” llm settings,”arXiv preprint arXiv:2408.04667, 2024
-
[44]
Chain-of-thought prompting elicits reasoning in large language models,
J. Wei, X. Wang, D. Schuurmans, M. Bosma, F. Xia, E. Chi, Q. V . Le, D. Zhouet al., “Chain-of-thought prompting elicits reasoning in large language models,”Advances in neural information processing systems, vol. 35, pp. 24 824–24 837, 2022
2022
-
[45]
Accessible visualization via natural language descriptions: A four-level model of semantic content,
A. Lundgard and A. Satyanarayan, “Accessible visualization via natural language descriptions: A four-level model of semantic content,”IEEE transactions on visualization and computer graphics, vol. 28, no. 1, pp. 1073–1083, 2021
2021
-
[46]
Natural language dataset generation framework for visualiza- tions powered by large language models,
H.-K. Ko, H. Jeon, G. Park, D. H. Kim, N. W. Kim, J. Kim, and J. Seo, “Natural language dataset generation framework for visualiza- tions powered by large language models,” inProceedings of the 2024 CHI Conference on Human Factors in Computing Systems, 2024, pp. 1–22
2024
-
[47]
G-Eval: NLG Evaluation using GPT-4 with Better Human Alignment
Y . Liu, D. Iter, Y . Xu, S. Wang, R. Xu, and C. Zhu, “G-eval: Nlg evaluation using gpt-4 with better human alignment,”arXiv preprint arXiv:2303.16634, 2023
work page internal anchor Pith review Pith/arXiv arXiv 2023
-
[48]
Surfacing visualization mirages,
A. McNutt, G. Kindlmann, and M. Correll, “Surfacing visualization mirages,” inProceedings of the 2020 CHI Conference on human factors in computing systems, 2020, pp. 1–16. JOURNAL OF LATEX CLASS FILES, VOL. 14, NO. 8, AUGUST 2021 17
2020
-
[49]
A taxonomy of dirty data,
W. Kim, B.-J. Choi, E.-K. Hong, S.-K. Kim, and D. Lee, “A taxonomy of dirty data,”Data mining and knowledge discovery, vol. 7, pp. 81–99, 2003
2003
-
[50]
Hark no more: On the preregis- tration of chi experiments,
A. Cockburn, C. Gutwin, and A. Dix, “Hark no more: On the preregis- tration of chi experiments,” inProceedings of the 2018 chi conference on human factors in computing systems, 2018, pp. 1–12
2018
-
[51]
Misinformed by visualization: What do we learn from misinformative visualizations?
L. Y .-H. Lo, A. Gupta, K. Shigyo, A. Wu, E. Bertini, and H. Qu, “Misinformed by visualization: What do we learn from misinformative visualizations?” inComputer Graphics Forum, vol. 41, no. 3. Wiley Online Library, 2022, pp. 515–525
2022
-
[52]
Looks good to me: Visualizations as sanity checks,
M. Correll, M. Li, G. Kindlmann, and C. Scheidegger, “Looks good to me: Visualizations as sanity checks,”IEEE transactions on visualization and computer graphics, vol. 25, no. 1, pp. 830–839, 2018
2018
-
[53]
How deceptive are deceptive visualizations? an empirical analysis of common distortion techniques,
A. V . Pandey, K. Rall, M. L. Satterthwaite, O. Nov, and E. Bertini, “How deceptive are deceptive visualizations? an empirical analysis of common distortion techniques,” inProceedings of the 33rd annual acm conference on human factors in computing systems, 2015, pp. 1469– 1478
2015
-
[54]
D. M. Green, J. A. Swetset al.,Signal detection theory and psy- chophysics. Wiley New York, 1966, vol. 1
1966
-
[55]
N. A. Macmillan and C. D. Creelman,Detection Theory: A User’s Guide, 2nd ed. Lawrence Erlbaum Associates, 2005
2005
-
[56]
Using forced choice to test belief bias in syllogistic reasoning,
D. Trippas, M. F. Verde, and S. J. Handley, “Using forced choice to test belief bias in syllogistic reasoning,”Cognition, vol. 133, no. 3, pp. 586–600, 2014
2014
-
[57]
The correction for guessing,
J. Diamond and W. Evans, “The correction for guessing,”Review of educational research, vol. 43, no. 2, pp. 181–191, 1973
1973
-
[58]
Formula scoring of multiple-choice tests (correction for guessing),
R. B. Frary, “Formula scoring of multiple-choice tests (correction for guessing),”Educational measurement: Issues and practice, vol. 7, no. 2, pp. 33–38, 1988
1988
-
[59]
R. M. Thorndike, G. K. Cunningham, R. L. Thorndike, and E. P. Hagen, Measurement and evaluation in psychology and education. Macmillan Publishing Co, Inc, 1991
1991
-
[60]
arXiv preprint arXiv:2404.05405 , year=
Z. Allen-Zhu and Y . Li, “Physics of language models: Part 3.3, knowl- edge capacity scaling laws,”arXiv preprint arXiv:2404.05405, 2024
-
[61]
Scaling laws for fact memorization of large language models,
X. Lu, X. Li, Q. Cheng, K. Ding, X.-J. Huang, and X. Qiu, “Scaling laws for fact memorization of large language models,” inFindings of the Association for Computational Linguistics: EMNLP 2024, 2024, pp. 11 263–11 282. JOURNAL OF LATEX CLASS FILES, VOL. 14, NO. 8, AUGUST 2021 18 Soohyun Leeis a Ph.D. student at the Human- Computer Interaction Laboratory u...
2024
-
[62]
Normal Prompt You are a helpful assistant for analyzing data visualizations
approach. Normal Prompt You are a helpful assistant for analyzing data visualizations. Please answer with the letter corresponding to the best option, or choose Omit if unsure. For example, if option (a) is correct, only reply with (a). Explain Prompt.A chain-of-thought prompt that guides mod- els through structured reasoning steps aligned with Lundgard a...
-
[63]
Be specific about which areas, elements, or coordinates you focused on
First, describe the specific points or areas where your attention focused (your eye fixation points) when examining the visualization, and in what order. Be specific about which areas, elements, or coordinates you focused on
-
[64]
Include any numerical values, textual information (labels, legends, categories), units, and trends you observed
Next, tell me what specific data values you extracted from each area you examined. Include any numerical values, textual information (labels, legends, categories), units, and trends you observed
-
[65]
Then, explain how you used this information to solve the problem, including any calculations, comparisons, or interpretations you made
-
[66]
If you are unsure, choose Omit
Finally, provide your answer as a single letter (e.g., (a), (b), etc.). If you are unsure, choose Omit. Be as detailed and specific as possible at each step of your analysis. B. Experiment 3: Prompt Engineering for Information Prior- itization Factual Priority Prompt.Instructs models to prioritize pre- trained factual knowledge over visual information whe...
2021
discussion (0)
Sign in with ORCID, Apple, or X to comment. Anyone can read and Pith papers without signing in.