ShrinkageTrees: An R Package for Bayesian Tree Ensembles for Survival Analysis and Causal Inference
Pith reviewed 2026-06-27 08:35 UTC · model grok-4.3
The pith
ShrinkageTrees is the first R package to implement the Horseshoe Forest for regularized Bayesian tree ensembles in survival analysis and causal inference.
A machine-rendered reading of the paper's core claim, the machinery that carries it, and where it could break.
Core claim
ShrinkageTrees provides the first implementation of the Horseshoe Forest, which places a horseshoe prior on the step heights of Bayesian additive regression trees, together with structure-regularising priors, thereby extending Bayesian tree ensembles to high-dimensional settings for survival analysis and causal inference under the accelerated failure time model.
What carries the argument
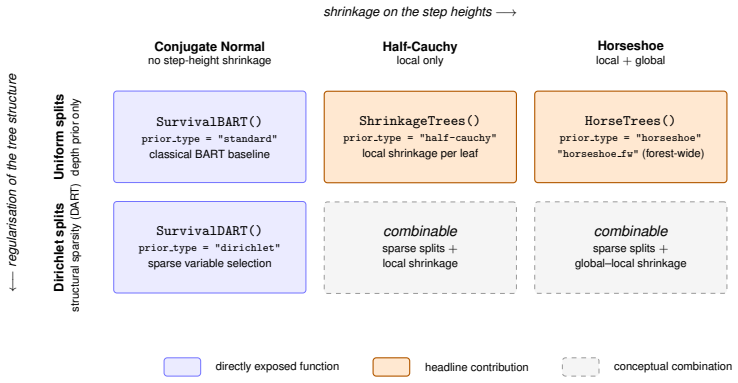
The Horseshoe Forest, which places a horseshoe prior on the step heights, combined with depth-penalising priors and Dirichlet splitting priors for tree structure.
If this is right
- The package handles both right-censored and interval-censored survival outcomes.
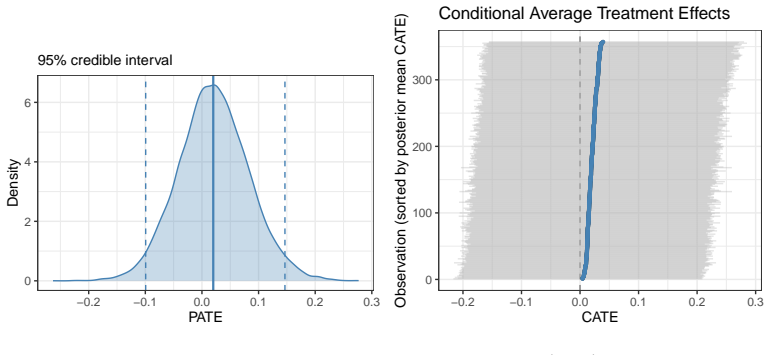
- It supports optional decomposition into prognostic and treatment-effect components for causal inference.
- An efficient Rcpp backend together with multi-chain MCMC and S3 methods covers fitting, prediction, causal effect estimation, and convergence diagnostics.
- The regularization strategies are presented as the means to extend Bayesian tree ensembles to high-dimensional data.
Where Pith is reading between the lines
- This implementation could be applied to clinical datasets with dozens of covariates to test whether the shrinkage reduces overfitting relative to unregularized BART variants.
- Direct comparisons on public survival benchmarks against penalized Cox models or random survival forests would clarify practical gains.
- Future work might add support for left censoring or time-varying covariates while retaining the same prior structure.
- The causal inference module could be linked to existing R packages for doubly robust estimation to check consistency of treatment effect estimates.
Load-bearing premise
The accelerated failure time framework combined with the chosen tree priors is assumed to be flexible enough and sufficiently regularized to produce reliable inferences in high-dimensional survival data without further validation or comparison to alternative survival models.
What would settle it
A simulation study on high-dimensional survival data with known ground truth that shows the fitted models yield systematically biased survival predictions or causal effect estimates would falsify the claim of reliable extension to high-dimensional settings.
Figures


read the original abstract
ShrinkageTrees is an R package for Bayesian tree ensembles in survival analysis and causal inference. The package implements Bayesian additive regression tree models for right- and interval-censored survival outcomes within an accelerated failure time (AFT) framework, with optional decomposition into prognostic and treatment-effect components for causal inference. Two complementary forms of regularisation are available: regularisation of the tree structure, via depth-penalising priors and Dirichlet splitting priors, and regularisation of the step heights, via global-local shrinkage priors. ShrinkageTrees provides the first implementation of the Horseshoe Forest, which places a horseshoe prior on the step heights. These regularisation strategies extend Bayesian tree ensembles to high-dimensional settings. An efficient Rcpp backend, multi-chain MCMC, and S3 methods support the full workflow: fitting, prediction, causal effect estimation, and convergence diagnostics.
Editorial analysis
A structured set of objections, weighed in public.
Referee Report
Summary. The manuscript describes ShrinkageTrees, an R package implementing Bayesian additive regression tree (BART) models for right- and interval-censored survival outcomes in an accelerated failure time (AFT) framework. It supports optional decomposition into prognostic and treatment-effect components for causal inference, with two forms of regularization: tree-structure regularization via depth-penalizing and Dirichlet splitting priors, and step-height regularization via global-local shrinkage priors including the first implementation of the Horseshoe Forest. The package features an efficient Rcpp backend, multi-chain MCMC, and S3 methods for the full workflow including fitting, prediction, causal effect estimation, and convergence diagnostics.
Significance. If the implementation performs as described, the package would provide a useful extension of existing BART methods by making available regularization strategies (particularly the Horseshoe Forest) that target high-dimensional survival and causal inference problems. This could enable more reliable inference in settings where standard tree ensembles overfit, building directly on prior BART literature without introducing new theoretical derivations.
minor comments (3)
- The abstract asserts that the regularization strategies 'extend Bayesian tree ensembles to high-dimensional settings,' but the manuscript provides no simulation studies, real-data benchmarks, or comparisons to existing survival BART implementations (e.g., in the BART or dbarts packages) to support this claim; adding at least one illustrative example or benchmark table would strengthen the paper.
- The description of the Horseshoe Forest as the 'first implementation' would benefit from an explicit citation to the originating work on horseshoe priors in tree ensembles to allow readers to trace the novelty.
- Consider adding a dedicated section or vignette reference detailing installation instructions, a minimal reproducible example for AFT survival fitting, and output interpretation for causal effect estimates.
Simulated Author's Rebuttal
We thank the referee for their positive summary of the ShrinkageTrees manuscript, the assessment of its significance for extending BART methods to high-dimensional survival and causal settings, and the recommendation of minor revision. No major comments were listed in the report.
Circularity Check
No significant circularity identified
full rationale
The document is a package announcement describing an implementation of existing BART models within the standard AFT framework, augmented by known regularization techniques (depth-penalizing priors, Dirichlet splitting, horseshoe priors on step heights). No derivation chain, theorems, or new empirical predictions are advanced; the central claim is simply the provision of the first software implementation of the Horseshoe Forest. No equations, self-citations, or fitted quantities are presented that reduce to their own inputs by construction.
Axiom & Free-Parameter Ledger
Reference graph
Works this paper leans on
-
[1]
doi: 10.1111/rssa.12824. [p1, 6] C. M. Carvalho, N. G. Polson, and J. G. Scott. The horseshoe estimator for sparse signals.Biometrika, 97(2):465–480,
-
[2]
doi: 10.1093/biomet/asq017. [p1, 5] H. A. Chipman, E. I. George, and R. E. McCulloch. Bayesian CART model search.Journal of the American Statistical Association, 93(443):935–948,
-
[3]
doi: 10.1080/01621459.1998.10473750. [p4] 15 H. A. Chipman, E. I. George, and R. E. McCulloch. BART: Bayesian additive regression trees.The Annals of Applied Statistics, 4(1):266–298,
-
[4]
doi: 10.1214/09-AOAS285. [p1, 2, 3, 4] V. Dorie, J. Hill, U. Shalit, M. Scott, and D. Cervone. Automated versus do-it-yourself methods for causal inference: Lessons learned from a data analysis competition.Statistical Science, 34(1): 43–68,
-
[5]
doi: 10.1214/18-STS667. [p6] V. Dorie, H. Chipman, and R. McCulloch.dbarts: Discrete Bayesian additive regression trees sampler,
-
[6]
doi: 10.18637/jss.v040.i08. [p1, 11] J. H. Friedman. Multivariate adaptive regression splines.The Annals of Statistics, 19(1):1–67,
-
[7]
doi: 10.1214/aos/1176347963. [p10] P. R. Hahn, J. S. Murray, and C. M. Carvalho. Bayesian regression tree models for causal inference: Regularization, confounding, and heterogeneous effects.Bayesian Analysis, 15(3):965–1056,
-
[8]
[p1, 6, 14] F.E.Harrell, K.L.Lee, andD.B.Mark
doi: 10.1214/19-BA1195. [p1, 6, 14] F.E.Harrell, K.L.Lee, andD.B.Mark. Multivariableprognosticmodels: Issuesindevelopingmodels, evaluating assumptions and adequacy, and measuring and reducing errors.Statistics in Medicine, 15(4):361–387,
-
[9]
doi: 10.1002/(SICI)1097-0258(19960229)15:4<361::AID-SIM168>3.0.CO;2-4. [p2] T. Hastie and R. Tibshirani. Bayesian backfitting (with comments and a rejoinder by the authors). Statistical Science, 15(3):196–223,
-
[10]
doi: 10.1214/ss/1009212815. [p6] J. He, S. Yalov, and P. R. Hahn. XBART: Accelerated Bayesian additive regression trees. InPro- ceedings of the 22nd International Conference on Artificial Intelligence and Statistics (AISTATS), volume 89, pages 1130–1138,
-
[11]
doi: 10.1198/jcgs.2010.08162. [p6] T. Jacobs, W. N. van Wieringen, and S. L. van der Pas. Horseshoe forests for high-dimensional causal survival analysis.arXiv preprint arXiv:2507.22004,
-
[12]
Horseshoe Forests for High-Dimensional Causal Survival Analysis
doi: 10.48550/arXiv.2507.22004. Accepted for publication inBayesian Analysis. [p1, 3, 5, 7, 15] A. Kapelner and J. Bleich. bartMachine: Machine learning with Bayesian additive regression trees. Journal of Statistical Software, 70(4):1–40,
work page internal anchor Pith review Pith/arXiv arXiv doi:10.48550/arxiv.2507.22004
-
[13]
doi: 10.18637/jss.v070.i04. [p6] F. Li, P. Ding, and F. Mealli. Bayesian causal inference: A critical review.Philosophical Transactions of the Royal Society A, 381(2247):20220153,
-
[14]
doi: 10.1098/rsta.2022.0153. [p9] A. R. Linero. Bayesian regression trees for high-dimensional prediction and variable selection. Journal of the American Statistical Association, 113(522):626–636,
-
[15]
doi: 10.1080/01621459. 2016.1264957. [p1, 3, 4, 5] A. R. Linero and Y. Yang. Bayesian regression tree ensembles that adapt to smoothness and sparsity. Journal of the Royal Statistical Society: Series B (Statistical Methodology), 80(5):1087–1110,
-
[16]
doi: 10.1111/rssb.12293. [p14] M. Plummer, N. Best, K. Cowles, and K. Vines. CODA: Convergence diagnosis and output analysis for MCMC.R News, 6(1):7–11,
-
[17]
[p5] R Core Team.R: A language and environment for statistical computing
doi: 10.1214/12-BA730. [p5] R Core Team.R: A language and environment for statistical computing. R Foundation for Statistical Computing, Vienna, Austria,
-
[18]
doi: 10.1214/ aos/1176345338. [p9] R. Sparapani, C. Spanbauer, and R. McCulloch. Nonparametric machine learning and efficient computation with Bayesian additive regression trees: The BART R package.Journal of Statistical Software, 97(1):1–66,
-
[19]
[p14] The Cancer Genome Atlas Research Network
doi: 10.18637/jss.v097.i01. [p14] The Cancer Genome Atlas Research Network. Integrated genomic analyses of ovarian carcinoma. Nature, 474:609–615,
-
[20]
doi: 10.1038/nature10166. [p1, 2] T. M. Therneau.A package for survival analysis in R,
-
[21]
URL https: //journal.r-project.org/articles/RJ-2011-002/. [p11] H. Wickham.ggplot2: Elegant graphics for data analysis. Springer-Verlag New York,
2011
discussion (0)
Sign in with ORCID, Apple, or X to comment. Anyone can read and Pith papers without signing in.