Shared Channel Capacity and Node Lifetime: An Empirical Study of the Lightning Network
Pith reviewed 2026-07-05 08:38 UTC · model glm-5.2
The pith
Connectivity, not time, drives Lightning Network liquidity
A machine-rendered reading of the paper's core claim, the machinery that carries it, and where it could break.
Core claim
The central finding is a mediation effect: node degree transmits the positive relationship between node lifetime and shared channel capacity. Longer-lived nodes accumulate more connections (β≈0.09-0.13, p<0.001), and higher degree strongly predicts capacity (β≈1.9-2.3, p<0.001). Once degree is included as a control, the lifetime coefficient reverses sign (β≈-0.08 to -0.15, p<0.001), meaning that holding connectivity constant, time itself is associated with lower capacity. The total positive effect of lifetime on capacity thus runs through the connectivity channel, not through direct temporal accumulation.
What carries the argument
The analytical machinery is a mediation-moderation regression framework applied to log-transformed node-level variables. The mediation claim is established through a two-step procedure: first regressing degree on lifetime, then regressing capacity on both degree and lifetime and observing the sign reversal of the lifetime coefficient. Robustness is tested via OLS, robust linear models (M-estimators), quantile regression, country/region fixed effects, mixed-level hierarchical models with random intercepts, and an explicit GDP-per-capita control.
If this is right
- Node operators seeking to maximize routing capacity should prioritize expanding their number of channel connections rather than simply staying online longer, since the mediation analysis shows degree is the operative variable for liquidity accumulation.
- Protocol-level incentive mechanisms that reward connectivity formation (especially for new or geographically underrepresented nodes) may be more effective at redistributing liquidity than measures aimed at prolonging node lifetime.
- The finding that GDP per capita correlates with node capacity but not with degree suggests that economic conditions affect how much liquidity a node can commit to channels but not how many connections it forms, pointing to capital access as a binding constraint distinct from network topology.
- The sign reversal of the lifetime coefficient when degree is controlled implies that among nodes with identical connectivity, older nodes may actually hold less capacity, possibly due to channel aging, outdated fee structures, or failure to rebalance.
Load-bearing premise
The mediation analysis assumes that the causal chain runs from lifetime to degree to capacity, but all three variables are constructed as cross-sectional averages (degree and capacity averaged across snapshots, lifetime as the span between first and last appearance). This design collapses the temporal ordering needed to support a causal mediation claim, so the finding could equally reflect reverse causation, where well-connected, high-capacity nodes simply tend to persist for
What would settle it
If a longitudinal (panel) analysis tracking the same nodes over time showed that degree and capacity do not increase with node age after controlling for initial conditions, or if it showed that high-degree and high-capacity nodes are formed early and then persist longer (rather than degree growing over time), the mediation claim would be undermined.
Figures



read the original abstract
The Lightning Network (LN) is a rapidly evolving payment channel network that enables scalable, off-chain transactions on top of Bitcoin. While prior research has documented its topological structure and liquidity concentration, the joint relationships between node lifetime, connectivity, and capacity remain insufficiently understood. This study provides a comprehensive empirical analysis of these relationships using a large-scale dataset of LN topology snapshots spanning the period 2019-2023. We examine whether node lifetime influences shared channel capacity, and whether this effect is mediated and moderated by node degree. In addition, we account for hierarchical geographic structure and explore the role of country-level economic conditions. The results show that node lifetime has a positive but relatively modest direct effect on capacity. This relationship is largely mediated by node degree, indicating that liquidity accumulation primarily occurs through increased connectivity. Furthermore, the interaction between lifetime and degree reveals significant heterogeneity, with stronger effects observed among highly connected and high-capacity nodes. Mixed-level models demonstrate superior explanatory power, highlighting the importance of country- and region-level variation. The inclusion of GDP per capita confirms that broader economic conditions significantly influence capacity distribution. Overall, the findings suggest that liquidity in the LN emerges from the interplay of temporal dynamics, network structure, and economic context. This study contributes to a more integrated understanding of payment channel networks and provides a foundation for future research on their evolution and efficiency.
Editorial analysis
A structured set of objections, weighed in public.
Referee Report
Summary. This manuscript empirically examines the relationships between node lifetime, degree (connectivity), and shared channel capacity in the Lightning Network (LN) using a large-scale dataset of topology snapshots spanning 2019–2023. The authors specify and estimate a series of regression models (OLS, robust, quantile, and mixed-level) to test three hypotheses: (H1) lifetime positively affects capacity, (H2) degree mediates the lifetime-capacity relationship, and (H3) degree moderates the lifetime-capacity relationship. The study finds that while lifetime has a modest positive total effect on capacity, this effect is largely mediated by degree, with the direct effect of lifetime reversing sign upon inclusion of degree. The paper also incorporates country-level fixed/random effects and GDP per capita, finding that geographic and economic context significantly influence capacity distribution. The dataset and geolocation pipeline are drawn from the authors' prior work [26, 27, 28] and have been validated against external benchmarks.
Significance. The paper tackles a relevant gap in the LN literature by moving beyond descriptive topology studies to a multivariate explanatory framework integrating temporal, structural, and geographic factors. The use of mixed-level models and the inclusion of GDP per capita as a country-level control are methodological strengths that add value over prior pairwise association studies. The authors provide a public repository for code and data, enhancing reproducibility. The robustness strategy—comparing OLS, RLM, QLM, and MLM specifications—is appropriate and thorough. However, the central mediation claim is subject to a structural concern regarding the definitional relationship between the mediator and the dependent variable, which must be addressed for the findings to be fully convincing.
major comments (3)
- §4.2.1, Eq. (1) and §5.3.2, Table 6: The mediation analysis (H2) is affected by a mechanical definitional link between the mediator (degree) and the outcome (capacity). Capacity is defined in Eq. (1) as (1/2)·Σ capacity[e] over incident edges, while degree is the count of those edges. In log space, log(capacity) ≈ log(degree) + log(avg_channel_capacity). This means that including degree in the H2'' regression (Table 6) will absorb variation in capacity by construction, making the sign reversal of the lifetime coefficient a near-mathematical necessity rather than evidence of a substantive mediation mechanism. The coefficient on degree (β≈1.9–2.3) exceeding 1.0 indicates super-linear scaling beyond the mechanical baseline, which is interesting, but the paper does not discuss or account for the mechanical relationship. The authors should explicitly acknowledge this definitional link and re-
- §4.2.1 and §5.3.2: The mediation analysis assumes temporal ordering (lifetime → degree → capacity), but all three variables are constructed as cross-sectional node-level summaries: lifetime = last_snapshot − first_snapshot, while degree and capacity are per-node averages across all snapshots. This construction collapses within-node temporal dynamics. A node that established high degree and high capacity early could persist longer precisely because it was well-connected (reverse causation: degree → lifetime), which would produce the same coefficient pattern observed in Tables 5–6 without any mediation occurring. The paper acknowledges in §6.2 that 'the empirical framework is based on statistical associations rather than causal identification,' but the mediation framing in H2 and the causal language throughout ('transmission channel,' 'accumulation mechanism') exceed what the cross-
- §5.3.3, Table 7: The moderation analysis (H3) reports opposite signs for the interaction term across subsamples—negative for non-geolocated nodes (β≈−0.035 to −0.046) and positive for geolocated nodes (β≈0.04–0.08). The paper attributes this to possible Simpson's paradox or 'systematically different connectivity dynamics,' but does not test this claim. Given that the non-geolocated subsample is 3.5× larger, the practical implication of this sign reversal for the overall network is unclear. The authors should either provide a formal test for why the sign flips or substantially temper the claim that H3 is supported.
minor comments (7)
- §5.3.1: The text states 'β≃ 0.05—2.1' for the lifetime coefficient, but Table 4 shows values ranging from 0.045 to 0.212. The '2.1' appears to be a typo for '0.21'.
- §4.2.2: The filtering removes nodes with zero degree (1.8%), zero capacity (6.6%), or zero lifetime (1.8%), but it is unclear whether these categories overlap. Reporting the joint distribution or the total percentage removed would improve clarity.
- Table 4: The R² values for H1 models range from 0.001 to 0.11, which the authors honestly acknowledge as 'limited.' However, the abstract's claim that 'node lifetime has a positive but relatively modest direct effect' could be strengthened by noting the near-zero explanatory power in the abstract itself.
- §5.3.4, Table 8: The sample size drops from 7,917 (Tables 4–7) to 7,893 when GDP per capita is included. The reason for this drop (likely missing GDP data for some countries) should be noted.
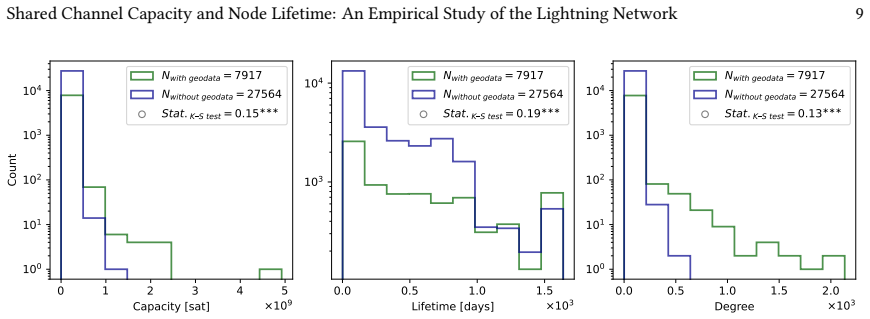
- Fig. 2: The x-axis label for the capacity histogram reads 'Capacity [sat] ×10^9' but the tick marks range from 0 to 4, suggesting the axis is in billions of satoshis. This should be clarified, as raw satoshi values would be much larger.
- §4.3.1: The paper uses 'mediation' and 'moderation' in the standard Baron and Kenny sense but does not cite the foundational mediation/moderation literature (e.g., Baron & Kenny 1986; Hayes 2013). Including at least one reference would situate the analytical approach.
- §6.1: The practical implications section suggests node operators should 'prioritize... the timely expansion of connectivity,' but given the cross-sectional, non-causal nature of the data, this recommendation should be stated more cautiously.
Simulated Author's Rebuttal
We thank the referee for a careful and constructive review. The referee raises three substantive points: (1) a mechanical/definitional link between degree and capacity that may inflate the mediation result, (2) temporal ordering concerns given the cross-sectional construction of variables, and (3) unexplained sign reversal of the moderation interaction across subsamples. We agree that all three points identify genuine limitations of the current manuscript. We will revise the manuscript to explicitly acknowledge the mechanical relationship, substantially temper the causal and mediation language, and either provide a formal test for the sign reversal or downgrade the H3 claim. Details are below.
read point-by-point responses
-
Referee: §4.2.1, Eq. (1) and §5.3.2, Table 6: The mediation analysis (H2) is affected by a mechanical definitional link between the mediator (degree) and the outcome (capacity). Capacity is defined as (1/2)·Σ capacity[e] over incident edges, while degree is the count of those edges. In log space, log(capacity) ≈ log(degree) + log(avg_channel_capacity). Including degree in the H2'' regression will absorb variation in capacity by construction, making the sign reversal of the lifetime coefficient a near-mathematical necessity rather than evidence of a substantive mediation mechanism. The coefficient on degree (β≈1.9–2.3) exceeding 1.0 indicates super-linear scaling beyond the mechanical baseline, which is interesting, but the paper does not discuss or account for the mechanical relationship.
Authors: The referee is correct, and we acknowledge this as a genuine limitation of the current manuscript. As the referee notes, because capacity is defined as the sum of per-edge capacities divided by two, and degree is the count of those edges, log(capacity) = log(degree) + log(average per-channel capacity). This means that including degree as a regressor for log(capacity) will mechanically absorb a large portion of the variation by construction. We agree that the sign reversal of the lifetime coefficient upon inclusion of degree is therefore not, by itself, convincing evidence of a substantive mediation mechanism—it is largely a mathematical consequence of the definitional link. We will revise the manuscript to explicitly acknowledge this mechanical relationship in both the methods section and the discussion of Table 6. We will also reframe the interpretation: the coefficient on degree exceeding 1.0 (β≈1.9–2.3) indicates super-linear scaling of capacity with connectivity beyond the mechanical baseline, which is a substantively interesting finding about preferential attachment and hub concentration, but it does not constitute clean evidence of mediation in the causal sense. We will add a decomposition showing how much of the degree–capacity association is mechanical versus substantive, and we will substantially temper the mediation language throughout the paper, including in the abstract, H2 framing, and discussion. We will also consider an alternative specification using average per-channel capacity as the dependent variable to remove the mechanical link, though we note this changes the research question. At minimum, the revised manuscript will explicitly state that the mediation analysis is confounded by the definitional relationship and that the H2 results should be интерп revision: yes
-
Referee: §4.2.1 and §5.3.2: The mediation analysis assumes temporal ordering (lifetime → degree → capacity), but all three variables are constructed as cross-sectional node-level summaries: lifetime = last_snapshot − first_snapshot, while degree and capacity are per-node averages across all snapshots. This construction collapses within-node temporal dynamics. A node that established high degree and high capacity early could persist longer precisely because it was well-connected (reverse causation: degree → lifetime), which would produce the same coefficient pattern observed in Tables 5–6 without any mediation occurring. The paper acknowledges in §6.2 that 'the empirical framework is based on statistical associations rather than causal identification,' but the mediation framing in H2 and the causal language throughout ('transmission channel,' 'accumulation mechanism') exceed what the cross-
Authors: The referee is correct that the cross-sectional construction of all three variables collapses within-node temporal dynamics and does not establish the temporal ordering required for a causal mediation claim. Lifetime is defined as last_snapshot minus first_snapshot, while degree and capacity are per-node averages across all snapshots. This means the analysis cannot distinguish the proposed pathway (lifetime → degree → capacity) from the reverse causal pathway the referee identifies (degree → lifetime, where well-connected nodes persist longer precisely because they are well-connected). We agree that the causal language used throughout the manuscript—terms such as 'transmission channel,' 'accumulation mechanism,' and 'mediates'—exceeds what the cross-sectional framework can support. In the revised manuscript, we will (1) reframe H2 as an exploratory test of statistical association rather than causal mediation, (2) replace causal language with associational language throughout (e.g., 'degree accounts for the association between lifetime and capacity' rather than 'degree transmits the effect of lifetime to capacity'), (3) explicitly discuss the reverse causation concern in the limitations section, and (4) note that a proper causal mediation analysis would require panel data with time-lagged variables, which we leave for future work. We will also add a note that the cross-sectional averages may mask important within-node temporal dynamics that a panel or survival analysis framework could better capture. We cannot fully resolve this concern within the current data and design, and we will be transparent about that. revision: yes
-
Referee: §5.3.3, Table 7: The moderation analysis (H3) reports opposite signs for the interaction term across subsamples—negative for non-geolocated nodes (β≈−0.035 to −0.046) and positive for geolocated nodes (β≈0.04–0.08). The paper attributes this to possible Simpson's paradox or 'systematically different connectivity dynamics,' but does not test this claim. Given that the non-geolocated subsample is 3.5× larger, the practical implication of this sign reversal for the overall network is unclear. The authors should either provide a formal test for why the sign flips or substantially temper the claim that H3 is supported.
Authors: The referee is correct that the sign reversal of the interaction term across subsamples is currently under-investigated. We offer two responses. First, we note that the quantile regression analysis in §5.3.5 (Figure 4) already provides partial evidence that the apparent inconsistency reflects genuine distributional heterogeneity rather than a pure sampling artifact: across both subsamples, the interaction coefficient trends upward across quantiles, becoming less negative (and in some cases positive) at higher capacity deciles. This suggests the subsample-level sign difference is partly driven by differences in the capacity distribution composition between geolocated and non-geolocated nodes. However, we agree that this is not a formal test of the sign flip. In the revised manuscript, we will either (a) conduct a formal test—for example, by estimating a pooled model with a subsample indicator and its three-way interaction with lifetime and degree, or by applying a Chow-type test for coefficient equality across subsamples—or (b) if such a test does not conclusively explain the reversal, substantially temper the claim that H3 is supported. We are inclined toward option (a) as a first step, but if the test is inconclusive, we will revise the H3 conclusion to state that the moderation effect is present but directionally unstable across subsamples, and that the evidence for H3 is therefore mixed rather than supportive. We agree that the current language ('provide support for H3') is too strong given the sign reversal, and we will revise accordingly. revision: partial
- The mechanical/definitional link between degree and capacity (Comment 1) cannot be fully resolved without either changing the dependent variable (e.g., to average per-channel capacity) or adopting a fundamentally different analytical framework. We can acknowledge and partially address it, but the core structural issue is inherent to the variable definitions.
- The temporal ordering concern (Comment 2) cannot be resolved within the current cross-sectional data construction. A proper causal mediation analysis would require panel data with time-lged variables, which is beyond the scope of the current manuscript.
Circularity Check
No significant circularity; self-cited dataset is externally validated and no prediction reduces to its inputs by construction
full rationale
The paper's central claims are derived from standard regression, mediation, and moderation analyses applied to an observational dataset. The dataset (refs [26, 27]) is authored by the same authors but is validated against external benchmarks (BitcoinVisuals, mempool.space) with stated accuracy metrics in §4.1, and the GDP per capita data comes from the World Bank [31]. No fitted parameters are renamed as predictions, and no derivation step reduces to its inputs by definition. The mechanical relationship between degree (edge count) and capacity (sum over the same edges, Eq. 1) creates a baseline correlation that inflates the degree-capacity coefficient, but the estimated coefficient (β≈1.9–2.3) exceeds the mechanical benchmark of 1.0, indicating the result contains information beyond the definitional link. This is a methodological limitation (correctness risk), not circularity. The self-citations are for data provision and a literature review, not for a load-bearing theoretical premise or uniqueness theorem. Score 1 reflects the minor self-citation for the dataset, which is not load-bearing for the central claims.
Axiom & Free-Parameter Ledger
free parameters (1)
- None (fitted regression coefficients) =
Various β coefficients reported in Tables 4–8
axioms (4)
- domain assumption Gossip messages and reconstructed snapshots accurately represent the LN topology at each time point.
- domain assumption Geolocated subsample (declining from ~40% to ~15% over time) is representative of the full network.
- ad hoc to paper Cross-sectional averages of degree and capacity across snapshots can be used in mediation analysis that assumes temporal ordering (lifetime → degree → capacity).
- domain assumption GDP per capita is a valid proxy for country-level economic, infrastructural, and environmental conditions relevant to LN capacity.
Reference graph
Works this paper leans on
-
[1]
Samuel Block, John W. Emerson, Daniel C. Esty, Alex de Sherbinin, Zachary A. Wendling, et al . 2024. Environmental Performance Index. https://epi.yale.edu Environmental Performance Index (EPI), accessed 2026-03-19
work page 2024
-
[2]
Simina Branzei, Erel Segal-Halevi, and Aviv Zohar. 2022. How to Charge Lightning: The Economics of Bitcoin Transaction Channels. In2022 58th Annual Allerton Conference on Communication, Control, and Computing (Allerton). Institute of Electrical and Electronics Engineers Inc., Monticello, IL, USA, 1–8. doi:10.1109/Allerton49937.2022.9929412
-
[3]
Gustavo F. Camilo, Gabriel Antonio F. Rebello, Lucas Airam C. De Souza, Miguel Elias M. Campista, and Luís Henrique M.K. Costa. 2024. ProfitPilot: Enabling Rebalancing in Payment Channel Networks Through Profitable Cycle Creation.IEEE Transactions on Network and Service Management21 (2024), 3167–3178. Issue 3. doi:10.1109/TNSM.2024.3361250
-
[4]
Gustavo F. Camilo, Gabriel Antonio F. Rebello, Lucas Airam C. De Souza, Maria Potop-Butucaru, Marcelo D. Amorim, Miguel Elias M. Campista, and Luis Henrique M.K. Costa. 2022. Topological Evolution Analysis of Payment Channels in the Lightning Network. In2022 IEEE Latin- American Conference on Communications, LATINCOM 2022. Institute of Electrical and Elec...
-
[5]
Andrea Carotti, Cosimo Sguanci, and Anastasios Sidiropoulos. 2024. Rational Economic Behaviours in the Bitcoin Lightning Network. In2024 IEEE International Conference on Blockchain and Cryptocurrency, ICBC 2024. Institute of Electrical and Electronics Engineers Inc., Dublin, Ireland, 594–601. doi:10.1109/ICBC59979.2024.10634468 Preprint version – Not for ...
-
[6]
Thomas K. Dasaklis and Vangelis Malamas. 2023. A Review of the Lightning Network’s Evolution: Unraveling Its Present State and the Emergence of Disruptive Digital Business Models.Journal of Theoretical and Applied Electronic Commerce Research18 (9 2023), 1338–1364. Issue 3. doi:10.3390/ jtaer18030068
work page 2023
-
[7]
Christian Decker. 2023. Lightning Network Research — Topology Datasets. doi:10.5281/zenodo.4088530 Retrieved February 10, 2026 from https://github.com/lnresearch/topology
-
[8]
Anantha Divakaruni and Peter Zimmerman. 2023. The Lightning Network: Turning Bitcoin into money.Finance Research Letters52 (2023), 103480. doi:10.1016/j.frl.2022.103480
-
[9]
Jun Fan, Ailing Yan, and Naihua Xiu. 2014. Asymptotic properties for M-estimators in linear models with dependent random errors.Journal of Statistical Planning and Inference148 (2014), 49–66. doi:10.1016/j.jspi.2013.12.005
-
[10]
Florian Grötschla, Lioba Heimbach, Severin Richner, and Roger Wattenhofer. 2026. On the Lifecycle of a Lightning Network Payment Channel. In Financial Cryptography and Data Security. FC 2025 International Workshops, Bernhard Haslhofer, Java Xu, Friedhelm Victor, Massimo Bartoletti, Andrea Bracciali, Kanta Matsuura, Jarek Nabrzyski, Vero Estrada-Galiñanes,...
work page 2026
-
[11]
Paolo Guasoni, Gur Huberman, and Clara Shikhelman. 2025. Lightning Network Economics: Topology.Management Science71, 7 (2025), 5477–5490. doi:10.1287/mnsc.2023.03872
-
[12]
Longxia Huang, Changzhi Huo, Chengzhi Ge, and Mengmeng Yang. 2025. AERO: An adaptive and efficient routing for off-chain payment channel networks.Computer Networks257 (2 2025), 11 pages. doi:10.1016/j.comnet.2024.111009
-
[13]
Alvin Heng Jun Ren, Ling Feng, Siew Ann Cheong, and Rick Siow Mong Goh. 2018. Optimal Fee Structure for Efficient Lightning Networks. In 2018 IEEE 24th International Conference on Parallel and Distributed Systems (ICPADS). IEEE Computer Society, Los Alamitos, CA, USA, 980–985. doi:10.1109/PADSW.2018.8644930
-
[14]
Nida Khan and Radu State. 2020. Lightning Network: A Comparative Review of Transaction Fees and Data Analysis. InBlockchain and Applications, Javier Prieto, Ashok Kumar Das, Stefano Ferretti, António Pinto, and Juan Manuel Corchado (Eds.). Springer International Publishing, Cham, 11–18. doi:10.1007/978-3-030-23813-1_2
-
[15]
Jian-Hong Lin, Kevin Primicerio, Tiziano Squartini, Christian Decker, and Claudio J Tessone. 2020. Lightning network: a second path towards centralisation of the Bitcoin economy.New Journal of Physics22, 8 (aug 2020), 083022. doi:10.1088/1367-2630/aba062
-
[16]
Mohammad Saleh Mahdizadeh, Behnam Bahrak, and Mohammad Sayad Haghighi. 2023. Decentralizing the lightning network: a score-based recommendation strategy for the autopilot system.Applied Network Science8 (12 2023), 33 pages. Issue 1. doi:10.1007/s41109-023-00602-2
-
[17]
Stefano Martinazzi. 2019. The evolution of Lightning Network’s Topology during its first year and the influence over its core values. arXiv:1902.07307 [cs.CR] doi:10.48550/arXiv.1902.07307
work page internal anchor Pith review Pith/arXiv arXiv doi:10.48550/arxiv.1902.07307 2019
-
[18]
Ayelet Mizrahi and Aviv Zohar. 2021. Congestion Attacks in Payment Channel Networks. InLecture Notes in Computer Science, Vol. 12675 LNCS. Springer Science and Business Media Deutschland GmbH, Berlin, Heidelberg, 170–188. doi:10.1007/978-3-662-64331-0_9
-
[19]
Oleas-Chavez, Cristina Perez-Sola, and Jordi Herrera-Joancomarti
Luis E. Oleas-Chavez, Cristina Perez-Sola, and Jordi Herrera-Joancomarti. 2022. Apples and Oranges: On How to Measure Node Centrality in Payment Channel Networks.IEEE Access10 (2022), 55469–55487. doi:10.1109/ACCESS.2022.3174549
-
[20]
Elias Rohrer, Julian Malliaris, and Florian Tschorsch. 2019. Discharged Payment Channels: Quantifying the Lightning Network’s Resilience to Topology-Based Attacks. arXiv:1904.10253 [cs.NI] doi:10.48550/arXiv.1904.10253
work page internal anchor Pith review Pith/arXiv arXiv doi:10.48550/arxiv.1904.10253 2019
-
[21]
Skipper Seabold and Josef Perktold. 2010. statsmodels: Econometric and Statistical Modeling with Python. InProceedings of the 9th Python in Science Conference. SciPy Proceedings, Austin, Texas, United States, 57–61. doi:10.25080/Majora-92bf1922-011
-
[22]
Topological Analysis of Bitcoin's Lightning Network
István András Seres, László Gulyás, Dániel A. Nagy, and Péter Burcsi. 2019. Topological Analysis of Bitcoin’s Lightning Network. arXiv:1901.04972 [cs.CY] doi:10.48550/arXiv.1901.04972
work page internal anchor Pith review Pith/arXiv arXiv doi:10.48550/arxiv.1901.04972 2019
-
[23]
Janez Sušnik and Pieter van der Zaag. 2017. Correlation and causation between the UN Human Development Index and national and personal wealth and resource exploitation.Economic Research-Ekonomska Istraživanja30, 1 (2017), 1705–1723. doi:10.1080/1331677X.2017.1383175
-
[24]
United Nations Development Programme. 2024. Human Development Index. https://hdr.undp.org/data-center/human-development-index. Human Development Index (HDI), accessed 2026-03-19
work page 2024
-
[25]
Danila Valko and Daniel Kudenko. 2024. Reducing CO2 emissions in a peer-to-peer distributed payment network: Does geography matter in the lightning network?Computer Networks243 (4 2024), 110297. doi:10.1016/j.comnet.2024.110297
-
[26]
Danila Valko and Jorge Marx Gómez. 2025. Geolocated lightning network topology snapshots: A dataset covering 2019–2023.Scientific Data12 (9 2025), 1939. Issue 1. doi:10.1038/s41597-025-06413-7
-
[27]
Danila Valko and Jorge Marx Gómez. 2025. Geolocated Lightning Network topology snapshots: A dataset covering 2019–2023. Harvard Dataverse. doi:10.7910/DVN/2OAVO6
-
[28]
Danila Valko and Jorge Marx Gómez. 2025. Recent advances in global payment channel networks: A systematic literature review. Research Square. doi:10.21203/rs.3.rs-7705514/v1
-
[29]
Clifford H. Wagner. 1982. Simpson’s Paradox in Real Life.The American Statistician36, 1 (1982), 46–48. doi:10.1080/00031305.1982.10482778
work page internal anchor Pith review Pith/arXiv arXiv doi:10.1080/00031305.1982.10482778 1982
-
[30]
Bing Wang, Longmei Xia, and Alfred M. Wu. 2022. Social Development with Public Value: An International Comparison.Social Indicators Research 162, 2 (2022), 909–934. doi:10.1007/s11205-021-02805-5
-
[31]
World Bank. 2026. GDP per capita (constant 2015 US$) [NY.GDP.PCAP.CD]. https://data.worldbank.org/indicator/NY.GDP.PCAP.CD. World Development Indicators, accessed 2026-03-19. Preprint version – Not for redistribution. Shared Channel Capacity and Node Lifetime: An Empirical Study of the Lightning Network 21
work page 2026
-
[32]
World Economic Forum. 2019. The Global Competitiveness Index. https://data360.worldbank.org/en/dataset/WEF_GCI. Global Competitiveness Index (GCI), accessed 2026-03-19
work page 2019
-
[33]
Foerster, Stefan Schmid, and Christian Decker
Philipp Zabka, Klaus T. Foerster, Stefan Schmid, and Christian Decker. 2022. Empirical evaluation of nodes and channels of the lightning network. Pervasive and Mobile Computing83 (7 2022), 19 pages. doi:10.1016/j.pmcj.2022.101584
-
[34]
Philipp Zabka, Klaus-Tycho Förster, Stefan Schmid, and Christian Decker. 2021. Node Classification and Geographical Analysis of the Lightning Cryptocurrency Network. InProceedings of the 22nd International Conference on Distributed Computing and Networking(Nara, Japan)(ICDCN ’21). Association for Computing Machinery, New York, NY, USA, 126–135. doi:10.114...
-
[35]
Förster, Christian Decker, and Stefan Schmid
Philipp Zabka, Klaus T. Förster, Christian Decker, and Stefan Schmid. 2024. A centrality analysis of the Lightning Network.Telecommunications Policy48 (3 2024), 102696. Issue 2. doi:10.1016/j.telpol.2023.102696 Preprint version – Not for redistribution
discussion (0)
Sign in with ORCID, Apple, or X to comment. Anyone can read and Pith papers without signing in.