Black Hole Occupation Fraction: Dependence on Black Hole Mass Threshold, Environment, Resolution and Redshift
Pith reviewed 2026-06-26 08:26 UTC · model grok-4.3
The pith
The black hole occupation fraction rises with galaxy stellar mass, yet its normalization, shape, and redshift trend depend on the black hole mass threshold, central versus satellite status, simulation volume, and resolution.
A machine-rendered reading of the paper's core claim, the machinery that carries it, and where it could break.
Core claim
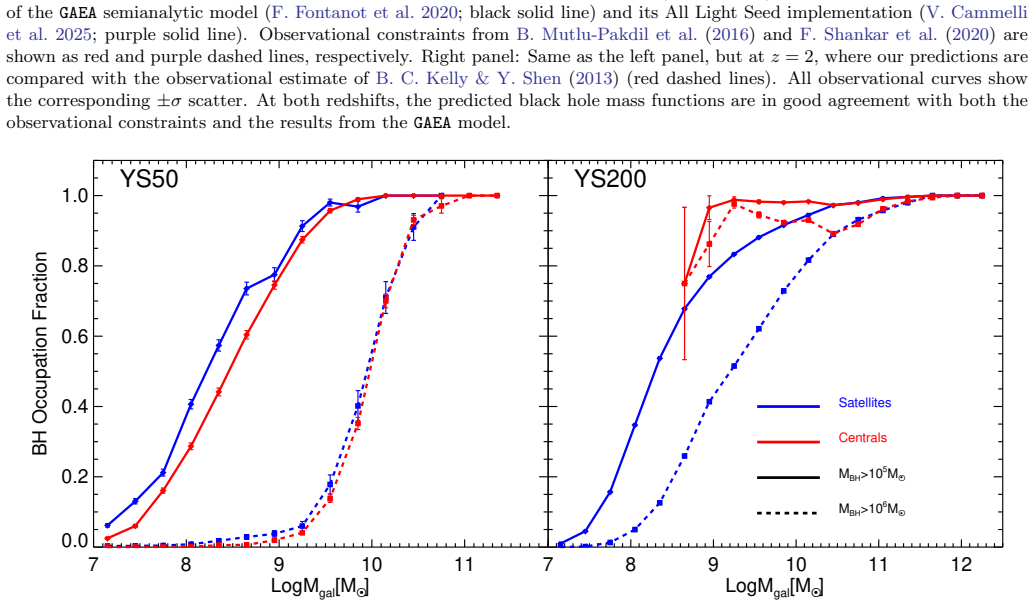
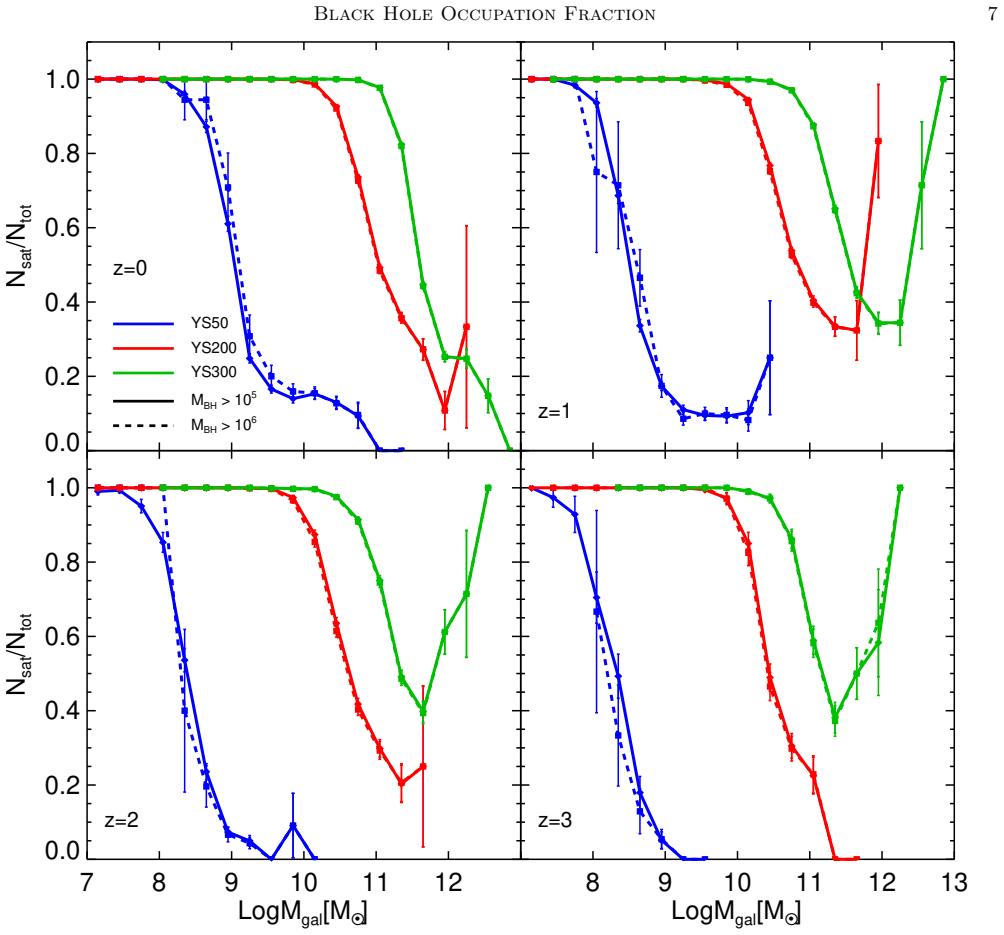
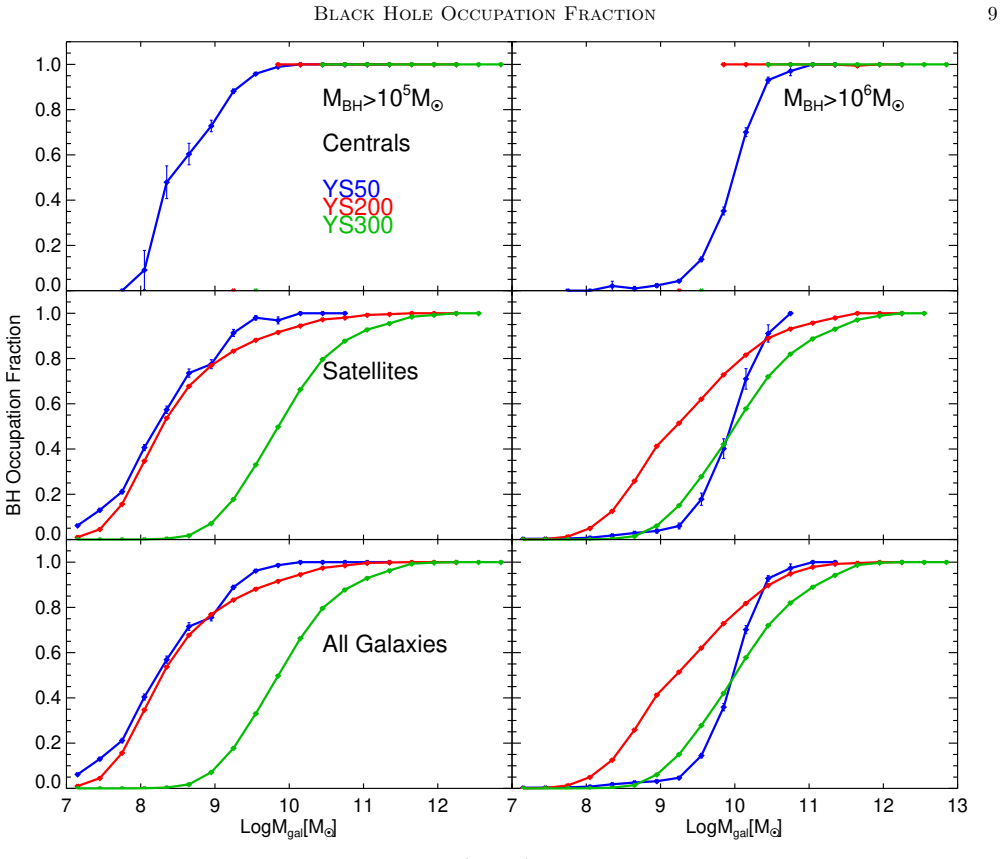
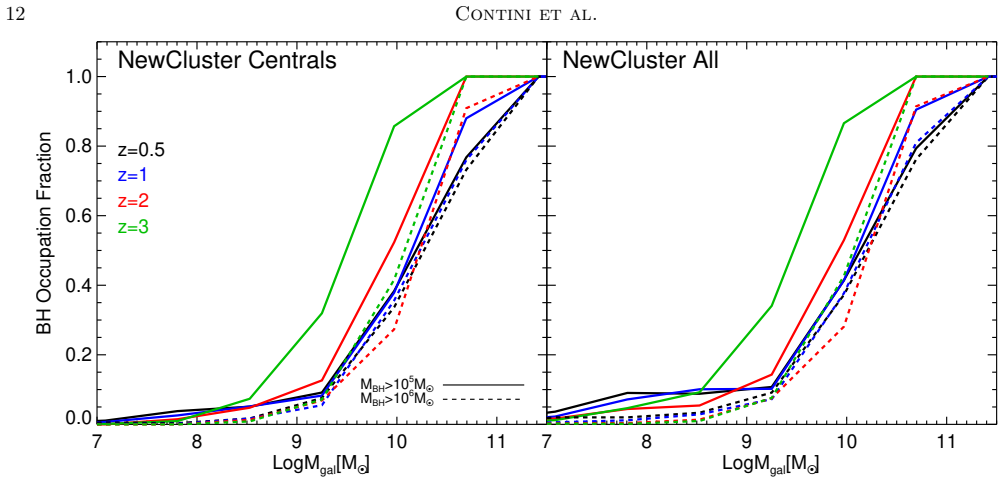
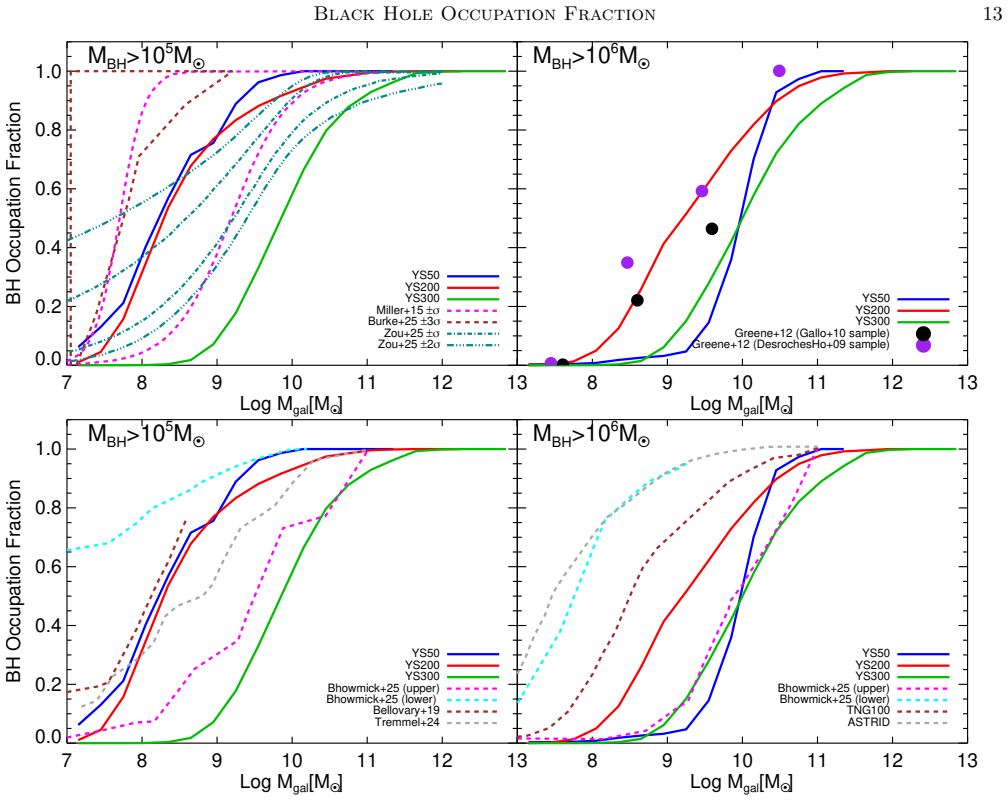
The black hole occupation fraction increases with stellar mass, but its normalization and shape depend strongly on the adopted black hole mass threshold and on the relative contribution of central and satellite galaxies. The relative behavior of central and satellite galaxies depends on the simulation box and black hole mass threshold, while the global relation should be interpreted as a population-weighted quantity. Significant box-to-box variations appear, reflecting the combined impact of numerical resolution, simulated volume, and sampled galaxy population. The redshift evolution is not universal.
What carries the argument
The black hole occupation fraction, computed as the share of galaxies above a given stellar mass that contain a black hole exceeding a chosen mass threshold, tracked separately for central and satellite galaxies across simulation boxes.
If this is right
- The global occupation fraction must be read as a population-weighted average rather than a single universal curve.
- Central and satellite galaxies can display opposite trends depending on the simulation volume and chosen mass threshold.
- Redshift evolution differs between smaller and larger simulation volumes.
- The inferred occupation fraction changes with numerical resolution and the galaxies included in each box.
Where Pith is reading between the lines
- Observers comparing occupation fractions across studies need to match the exact mass threshold and central-satellite mix used in each simulation.
- Box-to-box differences suggest that current volume and resolution limits still affect predicted occupation statistics.
- Extending the same analysis to higher-resolution runs could test whether the reported variations shrink or persist.
- Non-universal redshift trends imply that the balance between black hole growth channels may shift differently in dense versus average environments over time.
Load-bearing premise
The semi-analytic model reproduces the observed black hole mass function from redshift two to the present day.
What would settle it
A measurement of the black hole occupation fraction at fixed stellar mass that shows no increase with stellar mass, or that remains unchanged when the black hole mass threshold is varied, would falsify the reported dependence.
Figures


read the original abstract
We take advantage of the state-of-the-art semi-analytic model \texttt{FEGA25} \citep{contini2025}, run on merger trees extracted from three dark matter-only cosmological simulations, to study the relation between the black hole (BH) occupation fraction, $f_{\rm BH,occ}$, and galaxy stellar mass as a function of BH mass threshold, galaxy type, simulated volume, numerical resolution, sampled galaxy population, and redshift. \texttt{FEGA25} includes an improved treatment of active galactic nucleus feedback and does not impose a pre-existing BH seed population: BHs grow naturally through quasar and radio modes. Starting from the prerequisite that \texttt{FEGA25} reproduces the observed BH mass function from at least $z=2$ to the present day, our analysis leads to several results. We find that $f_{\rm BH,occ}$ increases with stellar mass, but that its normalization and shape depend strongly on the adopted BH mass threshold and on the relative contribution of central and satellite galaxies. The relative behavior of central and satellite galaxies depends on the simulation box and BH mass threshold, while the global relation should be interpreted as a population-weighted quantity. We also find significant box-to-box variations, reflecting the combined impact of numerical resolution, simulated volume, and sampled galaxy population. The redshift evolution is not universal: YS50 and the \texttt{NewCluster} zoom-in simulation show a trend qualitatively similar to that reported by \citet{tremmel2024}, whereas larger-volume boxes show the opposite behavior. Finally, comparison with other studies shows that the inferred occupation fraction is highly sensitive to BH mass threshold, simulated volume, numerical resolution, and sampled galaxy population.
Editorial analysis
A structured set of objections, weighed in public.
Referee Report
Summary. The paper uses the FEGA25 semi-analytic model, run on merger trees from three dark-matter-only simulations (including YS50, NewCluster zoom-in, and larger-volume boxes), to examine how the black hole occupation fraction f_BH,occ varies with galaxy stellar mass as a function of BH mass threshold, central versus satellite galaxies, simulation volume/resolution, sampled population, and redshift. Starting from the stated prerequisite that FEGA25 reproduces the observed BH mass function from z=2 to z=0, the main findings are that f_BH,occ increases with stellar mass but its normalization and shape depend strongly on the adopted BH mass threshold and the relative weight of centrals versus satellites; box-to-box variations are significant; and redshift evolution is not universal, with some boxes following trends similar to Tremmel et al. (2024) while others show the opposite.
Significance. If the prerequisite BH mass function match holds, the results usefully demonstrate that inferred occupation fractions are highly sensitive to the choice of BH mass threshold, the central/satellite split, and simulation characteristics. The explicit comparison across multiple boxes and the finding of non-universal redshift evolution provide a cautionary note for the field when generalizing occupation-fraction trends from single simulations or fixed thresholds. The multi-simulation approach is a strength, as it quantifies box-to-box variations arising from resolution, volume, and population sampling.
major comments (1)
- [Abstract] Abstract: The entire set of reported dependencies (on BH mass threshold, central/satellite contribution, box size, and non-universal redshift evolution) rests on the prerequisite that FEGA25 reproduces the observed BH mass function from z=2 to z=0. The manuscript does not re-demonstrate this match or cite specific quantitative evidence (e.g., low-mass end agreement or z>1 behavior) from Contini et al. (2025), so any mismatch at the low-mass end would directly rescale the occupation fractions and alter the claimed trends.
Simulated Author's Rebuttal
We thank the referee for their constructive feedback. We address the single major comment below.
read point-by-point responses
-
Referee: [Abstract] Abstract: The entire set of reported dependencies (on BH mass threshold, central/satellite contribution, box size, and non-universal redshift evolution) rests on the prerequisite that FEGA25 reproduces the observed BH mass function from z=2 to z=0. The manuscript does not re-demonstrate this match or cite specific quantitative evidence (e.g., low-mass end agreement or z>1 behavior) from Contini et al. (2025), so any mismatch at the low-mass end would directly rescale the occupation fractions and alter the claimed trends.
Authors: We agree this is a valid point. The current manuscript states the prerequisite and cites Contini et al. (2025) but does not include explicit quantitative references to the BHMF agreement. In revision we will add targeted citations to the relevant figures and text in Contini et al. (2025) demonstrating the match at the low-mass end and at z>1. This will not change the reported trends but will make the foundation of the analysis more transparent. revision: yes
Circularity Check
Minor self-citation to FEGA25 prerequisite; occupation fractions are independent model outputs
full rationale
The paper's derivation consists of running the FEGA25 semi-analytic model on independent dark-matter merger trees extracted from cosmological simulations and computing occupation fractions as direct outputs. The sole self-citation is to the prior FEGA25 paper for the prerequisite BH mass function match, which is stated explicitly as a starting condition rather than derived here. No equations or steps reduce the reported f_BH,occ trends by construction to fitted inputs, self-definitions, or load-bearing self-citations; the dependencies on threshold, environment, resolution, and redshift follow from the simulation results themselves.
Axiom & Free-Parameter Ledger
free parameters (1)
- BH mass threshold
axioms (1)
- domain assumption FEGA25 reproduces the observed black hole mass function from at least z=2 to the present day
Reference graph
Works this paper leans on
-
[1]
2014, Science, 345, 1330, doi: 10.1126/science.1251053 Alonso-´Alvarez, G., Cline, J
Alexander, T., & Natarajan, P. 2014, Science, 345, 1330, doi: 10.1126/science.1251053 Ba˜ nados, E., Venemans, B. P., Mazzucchelli, C., et al. 2018, Nature, 553, 473, doi: 10.1038/nature25180
-
[2]
2008, MNRAS, 388, 1011, doi: 10.1111/j.1365-2966.2008.13472.x
Baldry, I. K., Glazebrook, K., & Driver, S. P. 2008, MNRAS, 388, 945, doi: 10.1111/j.1365-2966.2008.13348.x
-
[3]
Baldry, I. K., Driver, S. P., Loveday, J., et al. 2012, MNRAS, 421, 621, doi: 10.1111/j.1365-2966.2012.20340.x
-
[4]
Begelman, M. C. 2010, MNRAS, 402, 673, doi: 10.1111/j.1365-2966.2009.15916.x
-
[5]
Begelman, M. C., & Silk, J. 2023, MNRAS, 526, L94, doi: 10.1093/mnrasl/slad124
-
[6]
Bellovary, J. M., Cleary, C. E., Munshi, F., et al. 2019, MNRAS, 482, 2913, doi: 10.1093/mnras/sty2842
-
[7]
K., Dominguez-Sanchez, H., et al
Bernardi, M., Sheth, R. K., Dominguez-Sanchez, H., et al. 2018, MNRAS, 477, 2560, doi: 10.1093/mnras/sty781
-
[8]
K., Blecha, L., Torrey, P., et al
Bhowmick, A. K., Blecha, L., Torrey, P., et al. 2025, MNRAS, 538, 518, doi: 10.1093/mnras/staf269
-
[9]
K., Blecha, L., Torrey, P., et al
Bhowmick, A. K., Blecha, L., Torrey, P., et al. 2026, arXiv e-prints, arXiv:2606.12851. https://arxiv.org/abs/2606.12851
Pith/arXiv arXiv 2026
-
[10]
J., Natarajan, P., Baldassare, V
Burke, C. J., Natarajan, P., Baldassare, V. F., & Geha, M. 2025, ApJ, 978, 77, doi: 10.3847/1538-4357/ad94d9
-
[11]
Cammelli, V., Monaco, P., Tan, J. C., et al. 2025, MNRAS, 536, 851, doi: 10.1093/mnras/stae2663
-
[12]
Chabrier, G. 2003, PASP, 115, 763, doi: 10.1086/376392
work page internal anchor Pith review doi:10.1086/376392 2003
-
[13]
Contini, E., De Lucia, G., Villalobos, ´A., & Borgani, S. 2014, MNRAS, 437, 3787, doi: 10.1093/mnras/stt2174
-
[14]
Contini, E., Rhee, J., Han, S., Jeon, S., & Yi, S. K. 2024a, AJ, 167, 7, doi: 10.3847/1538-3881/ad0894
-
[15]
Contini, E., Seo, C., Rhee, J., Jeon, S., & Yi, S. K. 2025a, ApJS, 281, 2, doi: 10.3847/1538-4365/ae060f
-
[16]
Contini, E., Yi, S. K., Jeon, S., & Rhee, J. 2024b, ApJS, 274, 41, doi: 10.3847/1538-4365/ad70ac
-
[17]
Contini, E., Yi, S. K., Rhee, J., & Jeon, S. 2025b, ApJS, 279, 18, doi: 10.3847/1538-4365/addb4b
-
[18]
Croton, D. J., Springel, V., White, S. D. M., et al. 2006, MNRAS, 365, 11, doi: 10.1111/j.1365-2966.2005.09675.x
-
[19]
Dubois, Y., Devriendt, J., Slyz, A., & Teyssier, R. 2012, MNRAS, 420, 2662, doi: 10.1111/j.1365-2966.2011.20236.x
-
[20]
Dubois, Y., Pichon, C., Welker, C., et al. 2014, MNRAS, 444, 1453, doi: 10.1093/mnras/stu1227
work page internal anchor Pith review doi:10.1093/mnras/stu1227 2014
-
[21]
2014, MNRAS, 443, 2410, doi: 10.1093/mnras/stu1280
Ferrara, A., Salvadori, S., Yue, B., & Schleicher, D. 2014, MNRAS, 443, 2410, doi: 10.1093/mnras/stu1280
-
[22]
2020, MNRAS, 496, 3943, doi: 10.1093/mnras/staa1716
Fontanot, F., De Lucia, G., Hirschmann, M., et al. 2020, MNRAS, 496, 3943, doi: 10.1093/mnras/staa1716
-
[23]
Greene, J. E. 2012, Nature Communications, 3, 1304, doi: 10.1038/ncomms2314
-
[24]
Gunn, J. E., & Gott, III, J. R. 1972, ApJ, 176, 1, doi: 10.1086/151605
-
[25]
2022, MNRAS, 514, 4912, doi: 10.1093/mnras/stac1659
Haidar, H., Habouzit, M., Volonteri, M., et al. 2022, MNRAS, 514, 4912, doi: 10.1093/mnras/stac1659
-
[26]
2025, ApJ, 978, 96, doi: 10.3847/1538-4357/ad98f4
Han, S., Dubois, Y., Lee, J., et al. 2025, ApJ, 978, 96, doi: 10.3847/1538-4357/ad98f4
-
[27]
Han, S., Yi, S. K., Dubois, Y., et al. 2026, A&A, 705, A169, doi: 10.1051/0004-6361/202556291 16Contini et al
-
[28]
Henriques, B. M. B., Yates, R. M., Fu, J., et al. 2020, MNRAS, 491, 5795, doi: 10.1093/mnras/stz3233
-
[29]
2010, ApJ, 709, 644, doi: 10.1088/0004-637X/709/2/644
Ilbert, O., Salvato, M., Le Floc’h, E., et al. 2010, ApJ, 709, 644, doi: 10.1088/0004-637X/709/2/644
-
[30]
Ilbert, O., McCracken, H. J., Le F` evre, O., et al. 2013, A&A, 556, A55, doi: 10.1051/0004-6361/201321100
-
[31]
Kelly, B. C., & Shen, Y. 2013, ApJ, 764, 45, doi: 10.1088/0004-637X/764/1/45
-
[32]
Larson, R. B., Tinsley, B. M., & Caldwell, C. N. 1980, ApJ, 237, 692, doi: 10.1086/157917
-
[33]
Larson, R. L., Finkelstein, S. L., Kocevski, D. D., et al. 2023, ApJL, 953, L29, doi: 10.3847/2041-8213/ace619
-
[34]
Li, C., & White, S. D. M. 2009, MNRAS, 398, 2177, doi: 10.1111/j.1365-2966.2009.15268.x
-
[35]
Madau, P., & Rees, M. J. 2001, ApJL, 551, L27, doi: 10.1086/319848
-
[36]
2024a, Nature, 627, 59, doi: 10.1038/s41586-024-07052-5
Maiolino, R., Scholtz, J., Witstok, J., et al. 2024, Nature, 627, 59, doi: 10.1038/s41586-024-07052-5
-
[37]
Marchesini, D., van Dokkum, P. G., F¨ orster Schreiber, N. M., et al. 2009, ApJ, 701, 1765, doi: 10.1088/0004-637X/701/2/1765
-
[38]
Marchesini, D., Whitaker, K. E., Brammer, G., et al. 2010, ApJ, 725, 1277, doi: 10.1088/0004-637X/725/1/1277
-
[39]
2018, MNRAS, 478, 2576, doi: 10.1093/mnras/sty1163
Mezcua, M., Civano, F., Marchesi, S., et al. 2018, MNRAS, 478, 2576, doi: 10.1093/mnras/sty1163
-
[40]
Miller, B. P., Gallo, E., Greene, J. E., et al. 2015, ApJ, 799, 98, doi: 10.1088/0004-637X/799/1/98
-
[41]
Mutlu-Pakdil, B., Seigar, M. S., & Davis, B. L. 2016, ApJ, 830, 117, doi: 10.3847/0004-637X/830/2/117
-
[42]
, archivePrefix = "arXiv", eprint =
Muzzin, A., Marchesini, D., Stefanon, M., et al. 2013, ApJ, 777, 18, doi: 10.1088/0004-637X/777/1/18
work page internal anchor Pith review doi:10.1088/0004-637x/777/1/18 2013
-
[43]
2024, ApJL, 960, L1, doi: 10.3847/2041-8213/ad0e76
Natarajan, P., Pacucci, F., Ricarte, A., et al. 2024, ApJL, 960, L1, doi: 10.3847/2041-8213/ad0e76
-
[44]
2019b, Computational Astrophysics and Cosmology, 6, 2, doi: 10.1186/s40668-019-0028-x
Nelson, D., Springel, V., Pillepich, A., et al. 2019, Computational Astrophysics and Cosmology, 6, 2, doi: 10.1186/s40668-019-0028-x
-
[45]
2025, ApJ, 990, 120, doi: 10.3847/1538-4357/adf3a7
Ni, Y., Chen, N., Zhou, Y., et al. 2025, ApJ, 990, 120, doi: 10.3847/1538-4357/adf3a7
-
[46]
2018b, MNRAS, 475, 648, doi: 10.1093/mnras/stx3112 Planck Collaboration, Ade, P
Pillepich, A., Nelson, D., Hernquist, L., et al. 2018, MNRAS, 475, 648, doi: 10.1093/mnras/stx3112 Planck Collaboration, Aghanim, N., Akrami, Y., et al. 2020, A&A, 641, A6, doi: 10.1051/0004-6361/201833910
work page internal anchor Pith review doi:10.1093/mnras/stx3112 2018
-
[47]
Schaye, J., Crain, R. A., Bower, R. G., et al. 2015, MNRAS, 446, 521, doi: 10.1093/mnras/stu2058
-
[48]
2020, Nature Astronomy, 4, 282, doi: 10.1038/s41550-019-0949-y
Shankar, F., Allevato, V., Bernardi, M., et al. 2020, Nature Astronomy, 4, 282, doi: 10.1038/s41550-019-0949-y
-
[49]
2011, ApJ, 733, 87, doi: 10.1088/0004-637X/733/2/87
Shi, Y., Helou, G., Yan, L., et al. 2011, ApJ, 733, 87, doi: 10.1088/0004-637X/733/2/87
-
[50]
Smith, B. D., Regan, J. A., Downes, T. P., et al. 2018, MNRAS, 480, 3762, doi: 10.1093/mnras/sty2103
-
[51]
Springel, V., Pakmor, R., Zier, O., & Reinecke, M. 2021, MNRAS, 506, 2871, doi: 10.1093/mnras/stab1855
-
[52]
2014, MNRAS, 442, 2751, doi: 10.1093/mnras/stu983
Taylor, P., & Kobayashi, C. 2014, MNRAS, 442, 2751, doi: 10.1093/mnras/stu983
-
[53]
13 CPRT: Bridging Theory and Observation in the SKA Era Chan et al
Teyssier, R. 2002, A&A, 385, 337, doi: 10.1051/0004-6361:20011817
-
[54]
Tomczak, A. R., Quadri, R. F., Tran, K.-V. H., et al. 2014, ApJ, 783, 85, doi: 10.1088/0004-637X/783/2/85
-
[55]
2024, The Open Journal of Astrophysics, 7, 26, doi: 10.33232/001c.116617
Tremmel, M., Ricarte, A., Natarajan, P., et al. 2024, The Open Journal of Astrophysics, 7, 26, doi: 10.33232/001c.116617
-
[56]
Volonteri, M., Lodato, G., & Natarajan, P. 2008, MNRAS, 383, 1079, doi: 10.1111/j.1365-2966.2007.12589.x
-
[57]
Volonteri, M., & Natarajan, P. 2009, MNRAS, 400, 1911, doi: 10.1111/j.1365-2966.2009.15577.x
-
[58]
2021, ApJL, 907, L1, doi: 10.3847/2041-8213/abd8c6
Wang, F., Yang, J., Fan, X., et al. 2021, ApJL, 907, L1, doi: 10.3847/2041-8213/abd8c6
-
[59]
Wise, J. H., Regan, J. A., O’Shea, B. W., et al. 2019, Nature, 566, 85, doi: 10.1038/s41586-019-0873-4
-
[60]
Zou, F., Gallo, E., Seth, A. C., et al. 2025, ApJ, 992, 176, doi: 10.3847/1538-4357/ae06a1
discussion (0)
Sign in with ORCID, Apple, or X to comment. Anyone can read and Pith papers without signing in.