Automated Residual Plot Assessment With the R Package autovi and the Shiny Application autovi.web
Pith reviewed 2026-06-25 22:29 UTC · model grok-4.3
The pith
A computer vision model predicts visual signal strength to automate residual plot assessment for linear models.
A machine-rendered reading of the paper's core claim, the machinery that carries it, and where it could break.
Core claim
The authors present a computer vision model that, given residuals from a fitted linear model, predicts a visual signal strength value and supplies additional information to help decide whether the model fits the data adequately.
What carries the argument
The computer vision model that outputs the visual signal strength (VSS) score from residual plots.
If this is right
- Assessments of model fit become consistent across different analysts.
- Evaluation of residual plots can be performed on large numbers of models without proportional increase in human effort.
- Analysts receive quantitative scores and supporting details that supplement visual inspection.
- The method complements protocols that embed observed plots among null plots by reducing the required human judgments.
Where Pith is reading between the lines
- The same model architecture could be retrained on other diagnostic plots such as Q-Q plots or leverage plots.
- Embedding the VSS calculation inside routine modeling functions would allow automatic flagging during data analysis.
- Repeated application to residuals from many models could reveal systematic patterns in how certain model types produce visual signals.
Load-bearing premise
The visual signal strength score from the computer vision model matches the diagnostic patterns a human analyst would see in residual plots.
What would settle it
Compare the model's VSS scores against ratings collected from multiple human analysts on the same set of residual plots; low agreement between the scores and the human ratings would falsify the claim.
Figures


read the original abstract
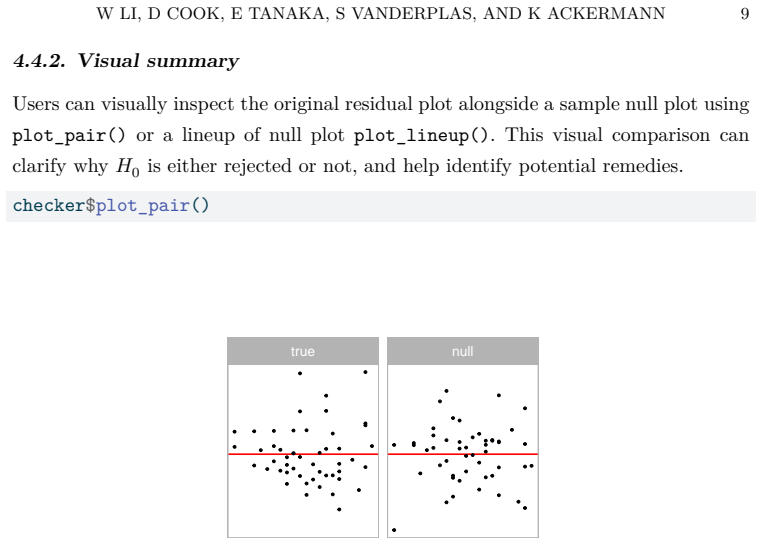
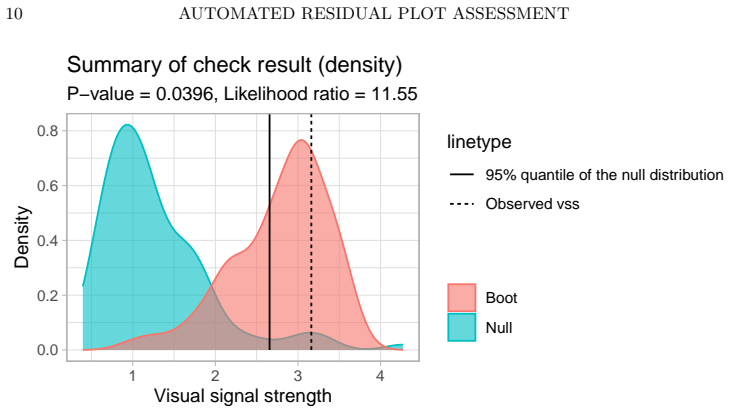
Visual assessment of residual plots is a common approach for diagnosing linear models, but it relies on manual evaluation, which does not scale well and can lead to inconsistent decisions across analysts. The lineup protocol, which embeds the observed plot among null plots, can reduce subjectivity but requires even more human effort. In today's data-driven world, such tasks are well suited for automation. We present a new R package that uses a computer vision model to automate the evaluation of residual plots. An accompanying Shiny application is provided for ease of use. Given a sample of residuals, the model predicts a visual signal strength (VSS) and offers supporting information to help analysts assess model fit.
Editorial analysis
A structured set of objections, weighed in public.
Referee Report
Summary. The paper presents the R package autovi and accompanying Shiny application autovi.web, which use a computer vision model to predict a visual signal strength (VSS) score from a sample of residuals in order to automate the visual assessment of residual plots for diagnosing linear models, thereby addressing the scalability and consistency limitations of manual evaluation and the lineup protocol.
Significance. If the VSS output were shown to reliably track diagnostic patterns such as non-normality, heteroscedasticity, or nonlinearity in a manner consistent with human judgment, the package would offer a practical automation tool that could scale residual-plot diagnostics to large modeling workflows and reduce inter-analyst variability.
major comments (1)
- [Abstract] Abstract: The central claim that the computer vision model automates residual-plot assessment by outputting a VSS that helps analysts judge model fit cannot be evaluated, because the manuscript supplies no training details, validation metrics, performance data, or comparison to human judgments or the lineup protocol.
Simulated Author's Rebuttal
We thank the referee for their review and constructive feedback. We address the single major comment below.
read point-by-point responses
-
Referee: [Abstract] Abstract: The central claim that the computer vision model automates residual-plot assessment by outputting a VSS that helps analysts judge model fit cannot be evaluated, because the manuscript supplies no training details, validation metrics, performance data, or comparison to human judgments or the lineup protocol.
Authors: We agree that the current manuscript does not supply the requested details on model training, validation metrics, performance data, or direct comparisons to human judgment or the lineup protocol. The paper is written as a software description focused on the autovi package and autovi.web application. To allow proper evaluation of the central claim regarding the VSS score, we will add a new section (or subsection) describing the computer vision model, including training data and procedure, model architecture, validation metrics, and any available quantitative or qualitative comparisons to human assessments. We will also update the abstract to reflect these additions. This constitutes a major revision. revision: yes
Circularity Check
No derivation chain or self-referential steps present
full rationale
The manuscript presents an R package and Shiny app that applies a computer-vision model to residual plots and outputs a visual signal strength (VSS) score. The abstract and available text contain no equations, no parameter-fitting procedure, no uniqueness theorems, and no self-citations that bear the central claim. Because no derivation or prediction step is described that could reduce to its own inputs by construction, none of the enumerated circularity patterns can be exhibited. The work is therefore self-contained against the circularity criteria.
Axiom & Free-Parameter Ledger
Reference graph
Works this paper leans on
-
[1]
Tenth International Conference on Machine Vision (ICMV 2017) , editor =
Nima Hatami and Yann Gavet and Johan Debayle , title =. Tenth International Conference on Machine Vision (ICMV 2017) , editor =. 2018 , doi =
2017
-
[2]
The American Statistician , volume=
Diagnostic value of residual and partial residual plots , author=. The American Statistician , volume=. 1987 , publisher=
1987
-
[3]
1982 , publisher=
Residuals and influence in regression , author=. 1982 , publisher=
1982
-
[4]
1980 , publisher=
Regression analysis and its application: a data-oriented approach , author=. 1980 , publisher=
1980
-
[5]
Technometrics , volume=
A graphical technique for enhancing scatterplots with moving statistics , author=. Technometrics , volume=. 1975 , publisher=
1975
-
[6]
Technometrics , volume=
Exploring partial residual plots , author=. Technometrics , volume=. 1993 , publisher=
1993
-
[7]
Statistica Sinica , pages=
The examination of residual plots , author=. Statistica Sinica , pages=. 1998 , publisher=
1998
-
[8]
1998 , publisher=
Applied regression analysis , author=. 1998 , publisher=
1998
-
[9]
Technometrics , volume=
The examination and analysis of residuals , author=. Technometrics , volume=. 1963 , publisher=
1963
-
[10]
1999 , publisher=
Applied regression including computing and graphics , author=. 1999 , publisher=
1999
-
[11]
1980 , publisher=
Regression diagnostics: Identifying influential data and sources of collinearity , author=. 1980 , publisher=
1980
-
[12]
1982 , publisher=
Introduction to linear regression analysis , author=. 1982 , publisher=
1982
-
[13]
Econometrica: Journal of the Econometric Society , pages=
A heteroskedasticity-consistent covariance matrix estimator and a direct test for heteroskedasticity , author=. Econometrica: Journal of the Econometric Society , pages=. 1980 , publisher=
1980
-
[14]
Econometrica: Journal of the Econometric Society , pages=
A simple test for heteroscedasticity and random coefficient variation , author=. Econometrica: Journal of the Econometric Society , pages=. 1979 , publisher=
1979
-
[15]
Journal of the Royal Statistical Society: Series B (Methodological) , volume=
Tests for specification errors in classical linear least-squares regression analysis , author=. Journal of the Royal Statistical Society: Series B (Methodological) , volume=. 1969 , publisher=
1969
-
[16]
Journal of the American Statistical Association , volume=
Graphical perception: Theory, experimentation, and application to the development of graphical methods , author=. Journal of the American Statistical Association , volume=. 1984 , publisher=
1984
-
[17]
Computational Statistics , volume=
Using visual statistical inference to better understand random class separations in high dimension, low sample size data , author=. Computational Statistics , volume=. 2015 , publisher=
2015
-
[18]
Joint Statistics Meetings, August , year=
Inference for data visualization , author=. Joint Statistics Meetings, August , year=
-
[19]
Journal of Computational and Graphical Statistics , volume=
Exploratory data analysis for complex models , author=. Journal of Computational and Graphical Statistics , volume=. 2004 , publisher=
2004
-
[20]
International Statistical Review , volume=
A Bayesian formulation of exploratory data analysis and goodness-of-fit testing , author=. International Statistical Review , volume=. 2003 , publisher=
2003
-
[21]
and Carlin, J
Gelman, A. and Carlin, J. B. and Stern, H. S. and Dunson, D. B. and Vehtari, A. and Rubin, D. B. , year=2013, title=
2013
-
[22]
Philosophical Transactions of the Royal Society A: Mathematical, Physical and Engineering Sciences , volume=
Statistical inference for exploratory data analysis and model diagnostics , author=. Philosophical Transactions of the Royal Society A: Mathematical, Physical and Engineering Sciences , volume=. 2009 , publisher=
2009
-
[23]
Journal of the American Statistical Association , volume=
Validation of visual statistical inference, applied to linear models , author=. Journal of the American Statistical Association , volume=. 2013 , publisher=
2013
-
[24]
IEEE Transactions on Visualization and Computer Graphics , volume=
Graphical tests for power comparison of competing designs , author=. IEEE Transactions on Visualization and Computer Graphics , volume=. 2012 , publisher=
2012
-
[25]
The American Statistician , volume=
Variations of Q--Q plots: the power of our eyes! , author=. The American Statistician , volume=. 2016 , publisher=
2016
-
[26]
The Annals of Mathematical Statistics , volume=
The Lagrangian multiplier test , author=. The Annals of Mathematical Statistics , volume=. 1959 , publisher=
1959
-
[27]
Stat , volume=
Statistical significance calculations for scenarios in visual inference , author=. Stat , volume=. 2021 , publisher=
2021
-
[28]
arXiv preprint arXiv:1408.1974 , year=
Human factors influencing visual statistical inference , author=. arXiv preprint arXiv:1408.1974 , year=
Pith/arXiv arXiv 1974
-
[29]
Wiley Interdisciplinary Reviews: Computational Statistics , volume=
Diagnostic tools for hierarchical linear models , author=. Wiley Interdisciplinary Reviews: Computational Statistics , volume=. 2013 , publisher=
2013
-
[30]
Journal of the American Statistical Association , volume=
Science and statistics , author=. Journal of the American Statistical Association , volume=. 1976 , publisher=
1976
-
[31]
Biometrika , volume=
An analysis of variance test for normality (complete samples) , author=. Biometrika , volume=. 1965 , publisher=
1965
-
[32]
Economics Letters , volume=
Efficient tests for normality, homoscedasticity and serial independence of regression residuals , author=. Economics Letters , volume=. 1980 , publisher=
1980
-
[33]
Journal of Computational and Graphical Statistics , volume=
Are you normal? The problem of confounded residual structures in hierarchical linear models , author=. Journal of Computational and Graphical Statistics , volume=. 2015 , publisher=
2015
-
[34]
Journal of Statistical Software , volume=
HLMdiag: A suite of diagnostics for hierarchical linear models in R , author=. Journal of Statistical Software , volume=
-
[35]
ac—A subject pool for online experiments , author=
Prolific. ac—A subject pool for online experiments , author=. Journal of Behavioral and Experimental Finance , volume=. 2018 , publisher=
2018
-
[36]
1964 , publisher=
Handbook of mathematical functions with formulas, graphs, and mathematical tables , author=. 1964 , publisher=
1964
-
[37]
Laplace, Pierre-Simon , volume=. Th. 1820 , publisher=
-
[38]
Sur un nouveau d
Hermite, M , year=. Sur un nouveau d
-
[39]
The R Journal , year =
David Kahle , title =. The R Journal , year =
-
[40]
R News , year =
Diagnostic checking in regression relationships , author =. R News , year =
-
[41]
2020 , note =
skedastic: Heteroskedasticity diagnostics for linear regression models , author =. 2020 , note =
2020
-
[42]
Economics Letters , volume=
A note on algebraic equivalence of White's test and a variation of the Godfrey/Breusch-Pagan test for heteroscedasticity , author=. Economics Letters , volume=. 1983 , publisher=
1983
-
[43]
The Annals of Mathematical Statistics , volume=
On information and sufficiency , author=. The Annals of Mathematical Statistics , volume=. 1951 , publisher=
1951
-
[44]
2022 , note =
cli: Helpers for developing command line interfaces , author =. 2022 , note =
2022
-
[45]
2022 , note =
curl: A modern and flexible web client for R , author =. 2022 , note =
2022
-
[46]
2023 , note =
dplyr: A grammar of data manipulation , author =. 2023 , note =
2023
-
[47]
arXiv:1403.2805 [stat.CO] , year =
The jsonlite Package: A practical and consistent mapping between JSON data and R objects , author =. arXiv:1403.2805 [stat.CO] , year =
-
[48]
2019 , note =
progress: Terminal progress bars , author =. 2019 , note =
2019
-
[49]
2022 , note =
tibble: Simple data frames , author =. 2022 , note =
2022
-
[50]
2021 , note =
ggmosaic: Mosaic plots in the 'ggplot2' framework , author =. 2021 , note =
2021
-
[51]
2022 , note =
purrr: Functional programming tools , author =. 2022 , note =
2022
-
[52]
2022 , note =
tidyr: Tidy messy data , author =. 2022 , note =
2022
-
[53]
2022 , note =
readr: Read rectangular text data , author =. 2022 , note =
2022
-
[54]
2022 , note =
stringr: Simple, consistent wrappers for common string operations , author =. 2022 , note =
2022
-
[55]
2020 , note =
here: A simpler way to find your files , author =. 2020 , note =
2020
-
[56]
2021 , note =
kableExtra: Construct complex table with kable and pipe syntax , author =. 2021 , note =
2021
-
[57]
2022 , note =
patchwork: The composer of plots , author =. 2022 , note =
2022
-
[58]
2018 , note =
Jakub Nowosad , title =. 2018 , note =
2018
-
[59]
PythonAnywhere , author=
-
[60]
2018 , publisher=
Flask web development: Developing web applications with Python , author=. 2018 , publisher=
2018
-
[61]
Behavior Research Methods , volume=
jsPsych: A JavaScript library for creating behavioral experiments in a web browser , author=. Behavior Research Methods , volume=. 2015 , publisher=
2015
-
[62]
2022 , note =
rticles: Article formats for R Markdown , author =. 2022 , note =
2022
-
[63]
knitr: A comprehensive tool for reproducible research in
Yihui Xie , publisher =. knitr: A comprehensive tool for reproducible research in. Implementing reproducible computational research , editor =. 2014 , note =
2014
-
[64]
2020 , note =
R Markdown cookbook , author =. 2020 , note =
2020
-
[65]
Computational Statistics & Data Analysis , volume=
A study of partial F tests for multiple linear regression models , author=. Computational Statistics & Data Analysis , volume=. 2007 , publisher=
2007
-
[66]
Journal of Statistics and Data Science Education , volume=
Bringing visual inference to the classroom , author=. Journal of Statistics and Data Science Education , volume=. 2021 , publisher=
2021
-
[67]
Journal of Computational and Graphical Statistics , volume=
value plots: Boxplots for large data , author=. Journal of Computational and Graphical Statistics , volume=. 2017 , publisher=
2017
-
[68]
BMC Medical Research Methodology , volume=
The relationship between statistical power and predictor distribution in multilevel logistic regression: a simulation-based approach , author=. BMC Medical Research Methodology , volume=. 2019 , publisher=
2019
-
[69]
2018 , publisher=
Practical statistical power analysis using Webpower and R , author=. 2018 , publisher=
2018
-
[70]
Econometrica: Journal of the Econometric Society , pages=
Partial time regressions as compared with individual trends , author=. Econometrica: Journal of the Econometric Society , pages=. 1933 , publisher=
1933
-
[71]
Educational and psychological measurement , volume=
Practical significance: A concept whose time has come , author=. Educational and psychological measurement , volume=. 1996 , publisher=
1996
-
[72]
2011 , publisher=
Thinking, fast and slow , author=. 2011 , publisher=
2011
-
[73]
Journal of the American Statistical Association , volume=
Errors of the third kind in statistical consulting , author=. Journal of the American Statistical Association , volume=. 1957 , publisher=
1957
-
[74]
Statistical inference for exploratory data analysis and model diagnostics , volume =. Philosophical Transactions of the Royal Society A: Mathematical, Physical and Engineering Sciences , author =. 2009 , pages =. doi:10.1098/rsta.2009.0120 , number =
-
[75]
Journal of the American Statistical Association , author =
Validation of visual statistical inference, applied to linear models , volume =. Journal of the American Statistical Association , author =. 2013 , pages =. doi:10.1080/01621459.2013.808157 , number =
-
[76]
Visual Mining Methods for RNA-Seq Data: Data Structure, Dispersion Estimation and Significance Testing , journal=
Tengfei Yin and Mahbubul Majumder and Niladri. Visual Mining Methods for RNA-Seq Data: Data Structure, Dispersion Estimation and Significance Testing , journal=
-
[77]
Spatial Reasoning and Data Displays , year=
VanderPlas, Susan and Hofmann, Heike , journal=. Spatial Reasoning and Data Displays , year=
-
[78]
Graphical inference for infovis , year=
Wickham, Hadley and Cook, Dianne and Hofmann, Heike and Buja, Andreas , journal=. Graphical inference for infovis , year=
-
[79]
Using Visual Statistical Inference to Better Understand Random Class Separations in High Dimension, Low Sample Size Data , author =. 2015 , month = jun, journal =. doi:10.1007/s00180-014-0534-x , urldate =
-
[80]
Mahbubul Majumder, Tengfei Yin , year =. Visual. Journal of Data Mining in Genomics & Proteomics , volume =. doi:10.4172/2153-0602.1000139 , urldate =
discussion (0)
Sign in with ORCID, Apple, or X to comment. Anyone can read and Pith papers without signing in.