A Leakage-Aware Comparative Benchmark of Machine Learning, Deep Learning, and Transformer Models for Reliable Leukemia Detection
Pith reviewed 2026-06-25 22:25 UTC · model grok-4.3
The pith
Subject-disjoint protocol on C-NMC 2019 yields EfficientNet-B1 AUROC of 0.913 for leukemia detection.
A machine-rendered reading of the paper's core claim, the machinery that carries it, and where it could break.
Core claim
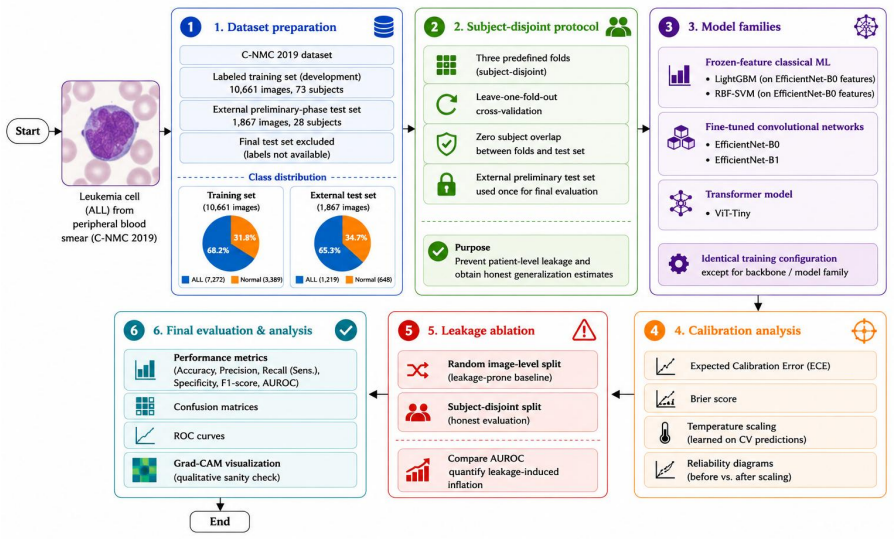
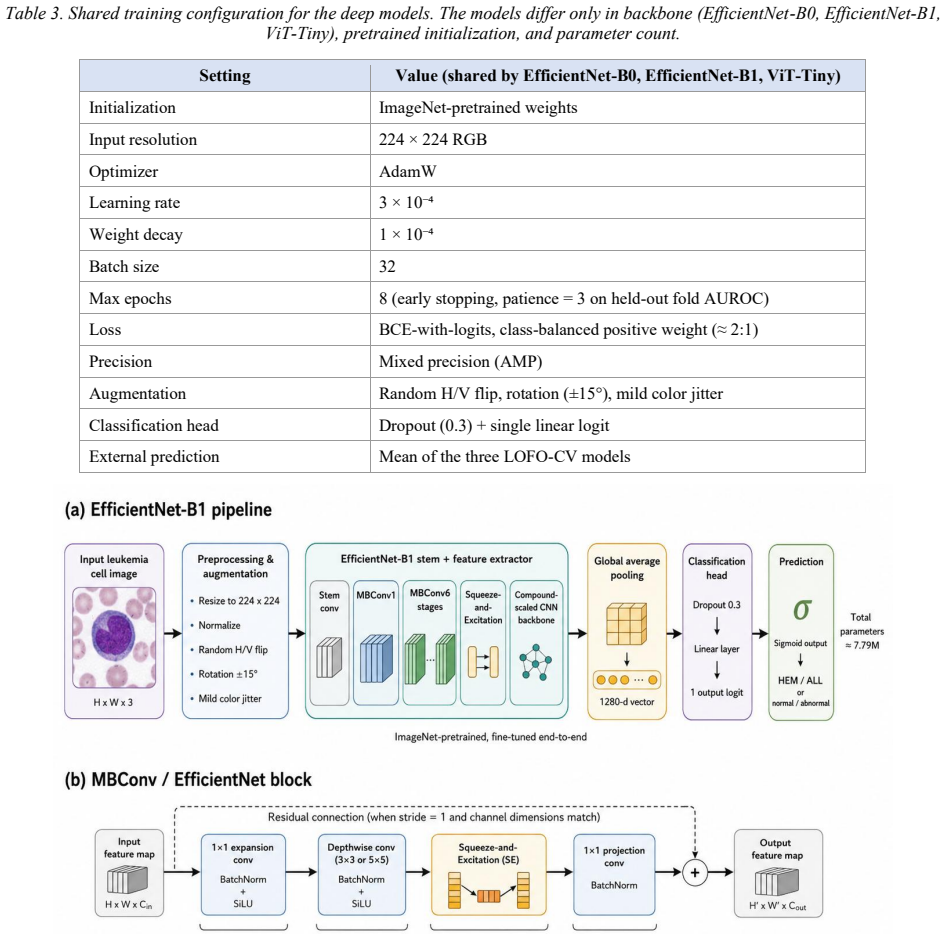
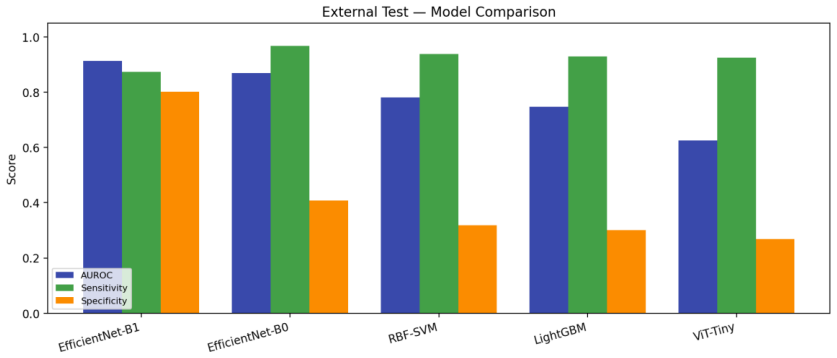
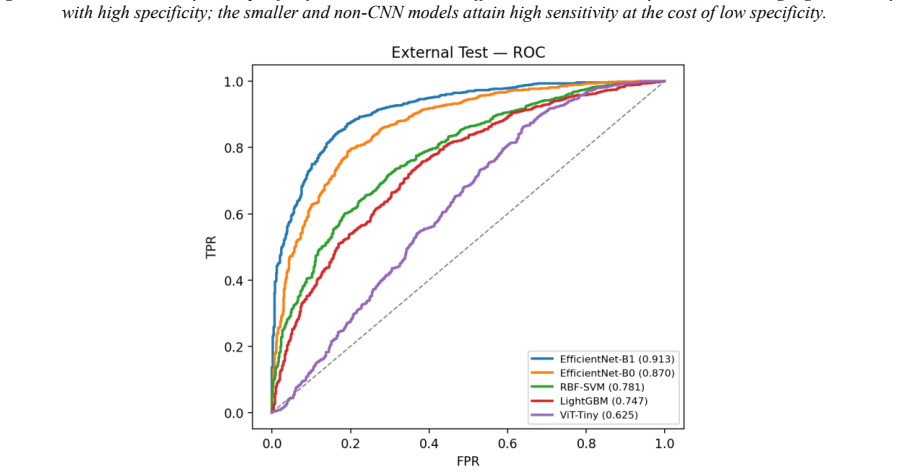
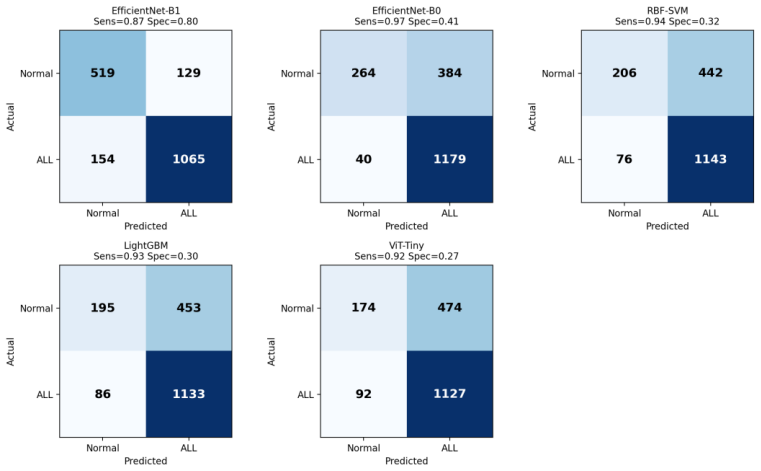
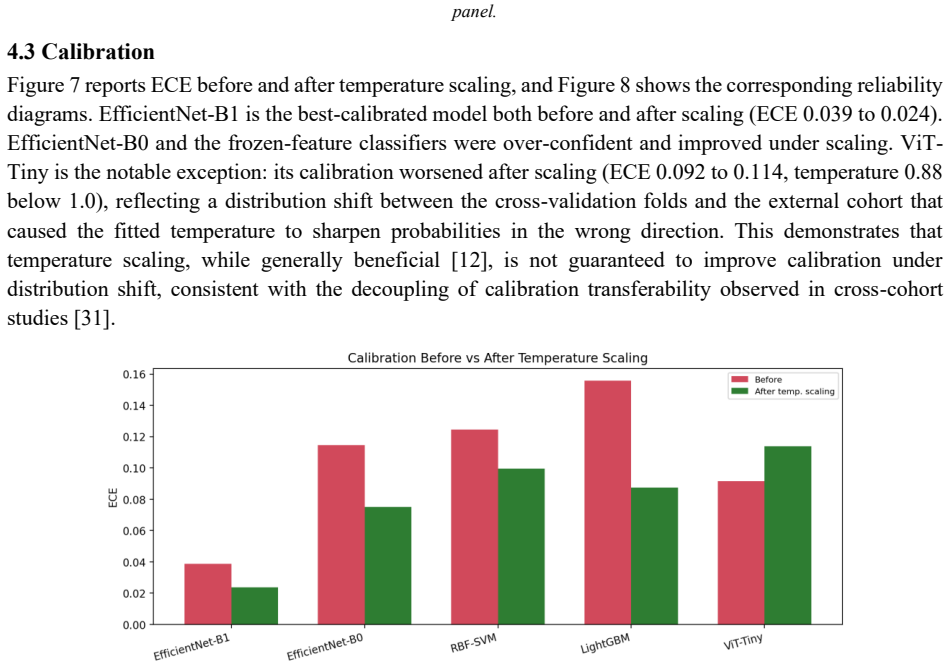
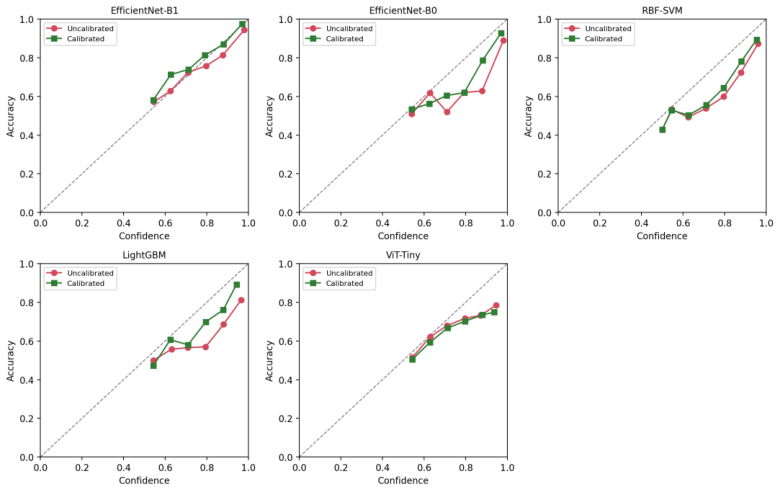
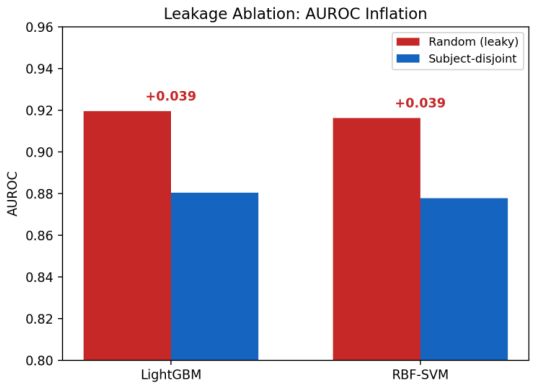
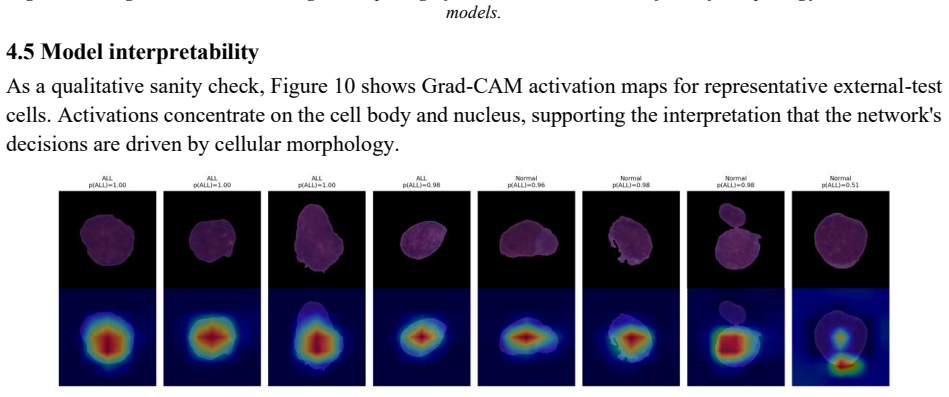
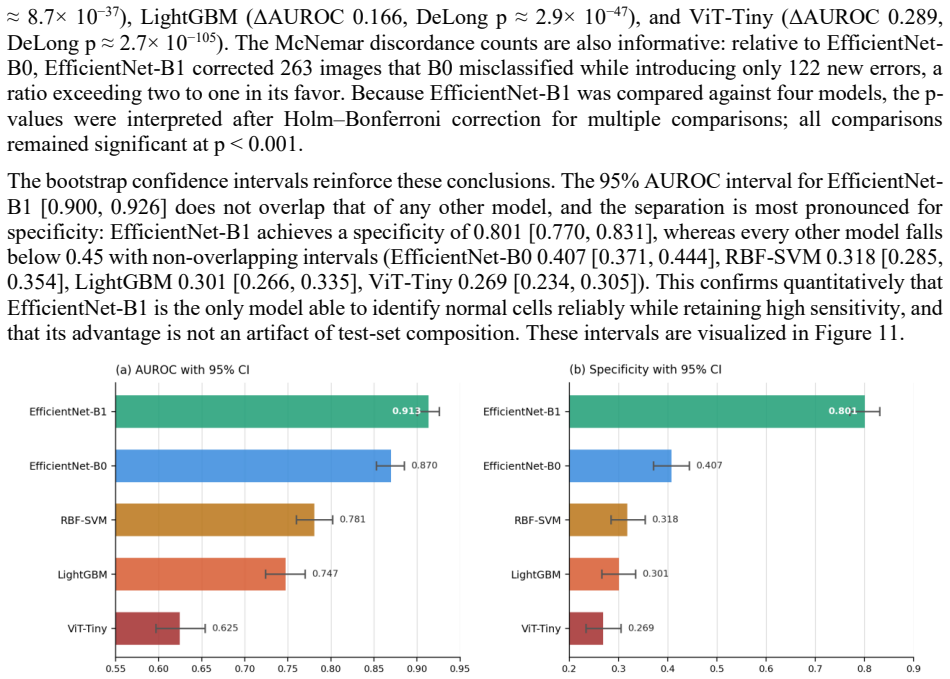
Under a strict subject-disjoint protocol on the C-NMC 2019 dataset, EfficientNet-B1 achieves an AUROC of 0.913, sensitivity 0.87, specificity 0.80, and calibrated expected calibration error of 0.024 on an external test set from 28 unseen subjects. Random image-level splitting inflates AUROC by approximately 0.04 even for conservative frozen-feature classifiers, and models such as ViT-Tiny tend to over-predict the malignant class.
What carries the argument
The subject-disjoint partitioning protocol that enforces zero patient overlap between training and test sets on the C-NMC 2019 dataset, combined with calibration metrics like expected calibration error.
If this is right
- EfficientNet-B1 emerges as the strongest model under leakage-free conditions.
- Random splitting produces inflated performance metrics across model types.
- Frozen-feature and transformer models exhibit poor specificity in this setting.
- Calibration evaluation with temperature scaling improves reliability assessment.
- Future benchmarks for leukemia detection should adopt subject-disjoint splits.
Where Pith is reading between the lines
- Similar leakage issues likely affect other medical imaging datasets using cell images from multiple patients.
- Applying subject-disjoint protocols could lead to more conservative but trustworthy performance estimates in clinical AI applications.
- Re-evaluating prior work on C-NMC 2019 with this protocol might lower reported accuracies across the board.
Load-bearing premise
The subject identifiers in the C-NMC 2019 dataset are accurate and sufficient to guarantee that the external test set has zero patient overlap with the development set.
What would settle it
Demonstrating that at least one image in the 1,867-image test set belongs to a subject from the 73-subject development set, or showing that enforcing stricter overlap removal changes the reported AUROC substantially.
Figures
read the original abstract
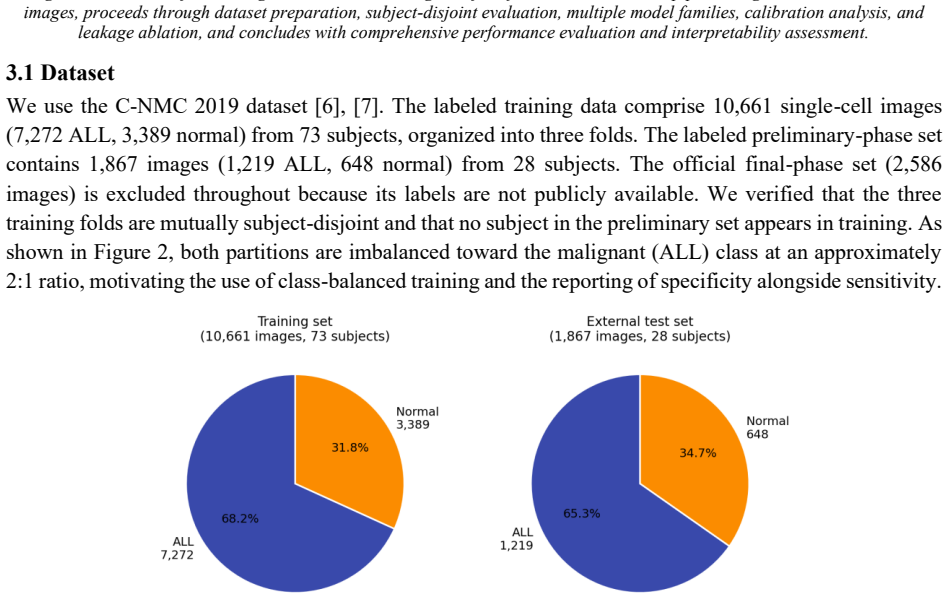
Automated classification of acute lymphoblastic leukemia (ALL) from peripheral blood smear images has often reported near-perfect performance on the C-NMC 2019 dataset. We show that such results can be inflated by patient-level data leakage caused by random image-level partitioning, where cells from the same subject may appear in both training and test folds. We establish a leakage-aware benchmark under a strict subject-disjoint protocol, comparing LightGBM, RBF-SVM, EfficientNet-B0, EfficientNet-B1, and ViT-Tiny. Models are developed using three subject-disjoint folds from 73 subjects and evaluated on an external preliminary-phase test set of 1,867 images from 28 unseen subjects with zero patient overlap. Beyond discrimination, we assess calibration using expected calibration error, Brier score, and temperature scaling. Under honest evaluation, EfficientNet-B1 achieves the best performance, with AUROC 0.913, sensitivity 0.87, specificity 0.80, and calibrated ECE 0.024. Frozen-feature classifiers and ViT-Tiny show high sensitivity but poor specificity, indicating a tendency to over-predict the malignant class. A random-versus-subject-disjoint ablation shows that random splitting inflates AUROC by about 0.04 even in the conservative frozen-feature setting. These findings caution against image-level evaluation on C-NMC 2019 and provide a reproducible, calibration-aware benchmark for future work.
Editorial analysis
A structured set of objections, weighed in public.
Referee Report
Summary. The manuscript claims that near-perfect performance reported on the C-NMC 2019 dataset for acute lymphoblastic leukemia classification arises from patient-level leakage due to random image-level splits. It establishes a leakage-aware benchmark under strict subject-disjoint partitioning (three folds from 73 subjects for development, evaluated on an external set of 1,867 images from 28 unseen subjects with zero overlap), comparing LightGBM, RBF-SVM, EfficientNet-B0/B1, and ViT-Tiny. EfficientNet-B1 is reported as best with AUROC 0.913, sensitivity 0.87, specificity 0.80, and calibrated ECE 0.024; an ablation shows random splitting inflates AUROC by ~0.04 even in frozen-feature settings. Calibration is assessed via ECE, Brier score, and temperature scaling.
Significance. If the subject-disjoint protocol holds, the work supplies a valuable cautionary benchmark that quantifies leakage effects and supplies reproducible, calibration-aware results for leukemia detection. The ablation study, external held-out test set, and explicit comparison of discrimination vs. calibration metrics are concrete strengths that advance evaluation standards in medical imaging.
major comments (1)
- [Abstract / data partitioning] Abstract and data partitioning description: the central claim of a 'strict subject-disjoint protocol' with 'zero patient overlap' between the 73-subject development set and 28-subject external test set rests on the unverified accuracy of C-NMC 2019 subject identifiers and the correctness of the authors' partitioning script. No explicit verification steps (e.g., overlap checks, code, or subject-ID validation) are described; if identifiers contain errors or duplicates, the reported AUROC 0.913, the 0.04 inflation figure, and the model ranking become unreliable.
minor comments (2)
- [Methods] The manuscript should specify the exact subject counts per fold and the hyperparameter search protocol for the deep models to allow full reproduction of the three subject-disjoint folds.
- [Results] Figure captions and table headers could more clearly distinguish the random-split versus subject-disjoint conditions when reporting the ablation results.
Simulated Author's Rebuttal
We thank the referee for the constructive feedback on verification of the subject-disjoint protocol. We agree that explicit documentation of verification steps strengthens the manuscript and will revise accordingly.
read point-by-point responses
-
Referee: [Abstract / data partitioning] Abstract and data partitioning description: the central claim of a 'strict subject-disjoint protocol' with 'zero patient overlap' between the 73-subject development set and 28-subject external test set rests on the unverified accuracy of C-NMC 2019 subject identifiers and the correctness of the authors' partitioning script. No explicit verification steps (e.g., overlap checks, code, or subject-ID validation) are described; if identifiers contain errors or duplicates, the reported AUROC 0.913, the 0.04 inflation figure, and the model ranking become unreliable.
Authors: We acknowledge that the manuscript does not currently describe explicit verification steps for subject identifiers or overlap checks, which is a valid point. The C-NMC 2019 dataset supplies subject IDs in its metadata; our partitioning grouped images by these IDs to create the 73-subject development set and 28-subject external test set, with a post-partitioning check confirming zero overlap in subject IDs. We will revise the methods section to add: (1) explicit description of the subject-ID-based grouping and overlap verification procedure, (2) pseudocode for the partitioning script, and (3) confirmation that no duplicate or erroneous IDs were detected in the provided metadata. We will also release the full partitioning code and subject-ID lists used (as supplementary material or public repository) to enable independent reproduction of the overlap check. This directly supports reproducibility of the AUROC 0.913, the ~0.04 inflation ablation, and model rankings. We cannot independently audit the original dataset creators' subject-ID assignment accuracy beyond the released metadata, but the protocol adheres strictly to the dataset structure as provided. revision: yes
Circularity Check
No circularity: purely empirical benchmark with direct measurements
full rationale
The paper reports measured AUROC, sensitivity, specificity, and calibration metrics from training and evaluating models on explicitly partitioned subject-disjoint data splits from the C-NMC 2019 dataset. No equations, fitted parameters renamed as predictions, self-citations, or ansatzes appear in the derivation chain; all headline numbers are obtained by direct evaluation on the external 28-subject test set. The subject-disjoint protocol is an experimental design choice, not a self-referential definition or reduction of results to inputs.
Axiom & Free-Parameter Ledger
axioms (2)
- domain assumption C-NMC 2019 subject identifiers are accurate and complete enough to create true patient-disjoint splits.
- domain assumption The 28-subject external test set is representative for generalization assessment.
Reference graph
Works this paper leans on
-
[1]
Albzour, N., & Lam, S. S. (2025). Segmentation and classification of Pap smear images for cervical cancer detection using deep learning. arXiv preprint arXiv:2508.17728
Pith/arXiv arXiv 2025
-
[2]
Gehlot, S., Gupta, A., & Gupta, R. (2020). SDCT-AuxNetθ: DCT augmented stain deconvolutional CNN with auxiliary classifier for cancer diagnosis. Medical Image Analysis, 61, 101661
2020
-
[3]
Al-Zoubi, H., & Al-Bzoor, N. (2022). Toward driverless AI: Automating leukemia detection and classification using hyperautomation, a case study. Research Square (preprint). https://doi.org/10.21203/rs.3.rs -2381448/v1
-
[4]
Mondal, C., Hasan, M. K., Jawad, M. T., Dutta, A., Islam, M. R., Awal, M. A., & Ahmad, M. (2021). Acute lymphoblastic leukemia detection from microscopic images using weighted ensemble of convolutional neural networks. arXiv preprint arXiv:2105.03995
arXiv 2021
-
[5]
Prellberg, J., & Kramer, O. (2019). Acute lymphoblastic leukemia classification from microscopic images using convolutional neural networks. In ISBI 2019 C-NMC Challenge: Classification in Cancer Cell Imaging (pp. 53– 61). Springer, Singapore
2019
-
[6]
Mourya, S., Kant, S., Kumar, P., Gupta, A., & Gupta, R. (2019). ALL Challenge dataset of ISBI 2019 (C -NMC
2019
-
[7]
[dataset]. The Cancer Imaging Archive. https://doi.org/10.7937/tcia.2019.dc64i46r
-
[8]
Gupta, A., & Gupta, R. (Eds.). (2019). ISBI 2019 C-NMC Challenge: Classification in Cancer Cell Imaging. Lecture Notes in Bioengineering. Springer, Singapore
2019
-
[9]
Gupta, A., Duggal, R., Gehlot, S., Gupta, R., Mangal, A., Kumar, L., Thakkar, N., & Satpathy, D. (2020). GCTI - SN: Geometry-inspired chemical and tissue invariant stain normalization of microscopic medical images. Medical Image Analysis, 65, 101788
2020
-
[10]
Kapoor, S., & Narayanan, A. (2023). Leakage and the reproducibility crisis in machine -learning-based science. Patterns, 4(9), 100804. https://doi.org/10.1016/j.patter.2023.100804
-
[11]
Albzour, N. (2026). Do hybrid deep learning–gradient boosting ensembles generalize? A cross-cohort evaluation of breast cancer survival prediction using SEER and METABRIC. SSRN. https://ssrn.com/abstract=6810699
2026
-
[12]
Albzour, N. (2026). External validation and calibration of hybrid deep–boosted ensembles for breast cancer survival prediction: A cross-cohort study on SEER and METABRIC. Research Square. https://doi.org/10.21203/rs.3.rs-9889524/v1
-
[13]
Guo, C., Pleiss, G., Sun, Y., & Weinberger, K. Q. (2017). On calibration of modern neural networks. Proceedings of the 34th International Conference on Machine Learning (ICML), 1321 –1330
2017
-
[14]
Cortes, C., & Vapnik, V. (1995). Support-vector networks. Machine Learning, 20(3), 273–297
1995
-
[15]
Ke, G., Meng, Q., Finley, T., Wang, T., Chen, W., Ma, W., Ye, Q., & Liu, T.-Y. (2017). LightGBM: A highly efficient gradient boosting decision tree. Advances in Neural Information Processing Systems, 30
2017
-
[16]
Tan, M., & Le, Q. (2019). EfficientNet: Rethinking model scaling for convolutional neural networks. Proceedings of the 36th International Conference on Machine Learning (ICML), 6105 –6114
2019
-
[17]
Dosovitskiy, A., Beyer, L., Kolesnikov, A., et al. (2021). An image is worth 16x16 words: Transformers for image recognition at scale. International Conference on Learning Representations (ICLR)
2021
-
[18]
Huang, G., Liu, Z., van der Maaten, L., & Weinberger, K. Q. (2017). Densely connected convolutional networks. IEEE Conference on Computer Vision and Pattern Recognition (CVPR), 4700 –4708
2017
-
[19]
Braga, D. C., & Dantas, D. O. (2026). Enhanced leukemic cell classification using attention -based CNN and data augmentation. arXiv preprint arXiv:2601.01026. https://doi.org/10.48550/arXiv.2601.01026
- [20]
-
[21]
Awais, M., Ahmad, R., Kausar, N., Alzahrani, A. I., Alalwan, N., & Masood, A. (2024). ALL classification using neural ensemble and memetic deep feature optimization. Frontiers in Artificial Intelligence, 7, 1351942. https://doi.org/10.3389/frai.2024.1351942
-
[22]
J., Narayanan, S., Gowri, S., & Kumar, S
Jawahar, M., Anbarasi, L. J., Narayanan, S., Gowri, S., & Kumar, S. (2024). An attention -based deep learning for acute lymphoblastic leukemia classification. Scientific Reports, 14, 17447. Page 19
2024
-
[23]
M., & Gamel, S
Talaat, F. M., & Gamel, S. A. (2023). A2M-LEUK: Attention-augmented algorithm for blood cancer detection in children. Neural Computing and Applications, 35(24), 18059–18071
2023
-
[24]
Perveen, S., Alourani, A., Shahbaz, M., Ashraf, U., & Hamid, I. (2024). A framework for early detection of acute lymphoblastic leukemia and its subtypes from peripheral blood smear images using deep ensemble learning technique. IEEE Access, 12, 29252–29268
2024
-
[25]
Almahdawi, H., Akbas, A., & Rahebi, J. (2025). Deep learning model for early acute lymphoblastic leukemia detection using microscopic images. Scientific Reports, 15, 28156
2025
-
[26]
Rehman, A., Abbas, N., Saba, T., Rahman, S. I. U., Mehmood, Z., & Kolivand, H. (2018). Classification of acute lymphoblastic leukemia using deep learning. Microscopy Research and Technique, 81(11), 1310 –1317
2018
-
[27]
K., Diya, V
Das, P. K., Diya, V. A., Meher, S., Panda, R., & Abraham, A. (2022). A systematic review on recent advancements in deep and machine learning based detection and classification of acute lymphoblastic leukemia. IEEE Access, 10, 81741–81763
2022
-
[28]
Albzour, N., & Lam, S. S. (2026). Systematic evaluation of vision transformers for automated cervical cancer classification: Optimization, statistical validation, and clinical interpretability. arXiv preprint arXiv:2605.17236
Pith/arXiv arXiv 2026
-
[29]
Albzour, N., & Lam, S. S. (2026). A reproducible benchmark of ViT-Tiny against CNN baselines for cervical cell classification: Accuracy, statistical validation, and deployment efficiency. SSRN. https://ssrn.com/abstract=6839541
2026
-
[30]
Aburass, S., Dorgham, O., Al Shaqsi, J., Abu Rumman, M., & Al-Kadi, O. (2025). Vision transformers in medical imaging: A comprehensive review of advancements and applications across multiple diseases. Journal of Imaging Informatics in Medicine, 38(6), 3928–3971. https://doi.org/10.1007/s10278-025-01481-y
-
[31]
Rumala, D. J. (2023). How you split matters: Data leakage and subject characteristics studies in longitudinal brain MRI analysis. MICCAI FAIMI 2023. arXiv:2309.00350
arXiv 2023
-
[32]
Albzour, N. (2026). Decoupled transferability of calibration and explainability in cross-cohort breast cancer survival prediction. Preprints. https://doi.org/10.20944/preprints202606.0847v1
-
[33]
Zou, K., Chen, Z., Yuan, X., et al. (2024). A review of uncertainty quantification in medical image analysis: Probabilistic and non-probabilistic methods. Medical Image Analysis, 97, 103285
2024
-
[34]
Christodoulou, E., Reinke, A., Andrè, P., et al. (2025). False promises in medical imaging AI? Assessing validity of outperformance claims. arXiv preprint arXiv:2505.04720
arXiv 2025
-
[35]
Maier-Hein, L., Eisenmann, M., Reinke, A., et al. (2018). Why rankings of biomedical image analysis competitions should be interpreted with care. Nature Communications, 9, 5217
2018
-
[36]
Varoquaux, G., & Cheplygina, V. (2022). Machine learning for medical imaging: Methodological failures and recommendations for the future. npj Digital Medicine, 5, 48
2022
-
[37]
Demšar, J. (2006). Statistical comparisons of classifiers over multiple data sets. Journal of Machine Learning Research, 7, 1–30
2006
-
[38]
Dietterich, T. G. (1998). Approximate statistical tests for comparing supervised classification learning algorithms. Neural Computation, 10(7), 1895–1923
1998
-
[39]
R., DeLong, D
DeLong, E. R., DeLong, D. M., & Clarke-Pearson, D. L. (1988). Comparing the areas under two or more correlated receiver operating characteristic curves: A nonparametric approach. Biometrics, 44(3), 837 –845
1988
-
[40]
McNemar, Q. (1947). Note on the sampling error of the difference between correlated proportions or percentages. Psychometrika, 12(2), 153–157
1947
-
[41]
Holm, S. (1979). A simple sequentially rejective multiple test procedure. Scandinavian Journal of Statistics, 6(2), 65–70
1979
-
[42]
Efron, B., & Tibshirani, R. J. (1993). An Introduction to the Bootstrap. Chapman & Hall/CRC
1993
-
[43]
P., & Ba, J
Kingma, D. P., & Ba, J. (2015). Adam: A method for stochastic optimization. International Conference on Learning Representations (ICLR)
2015
discussion (0)
Sign in with ORCID, Apple, or X to comment. Anyone can read and Pith papers without signing in.