Initial Mass Functions of Young Stellar Clusters from the Gemini Spectroscopic Survey of Nearby Galaxies. II. Young Clusters in NGC 1313
Pith reviewed 2026-06-25 21:37 UTC · model grok-4.3
The pith
Young clusters in NGC 1313 exhibit top-light initial mass functions that become more pronounced in more massive systems.
A machine-rendered reading of the paper's core claim, the machinery that carries it, and where it could break.
Core claim
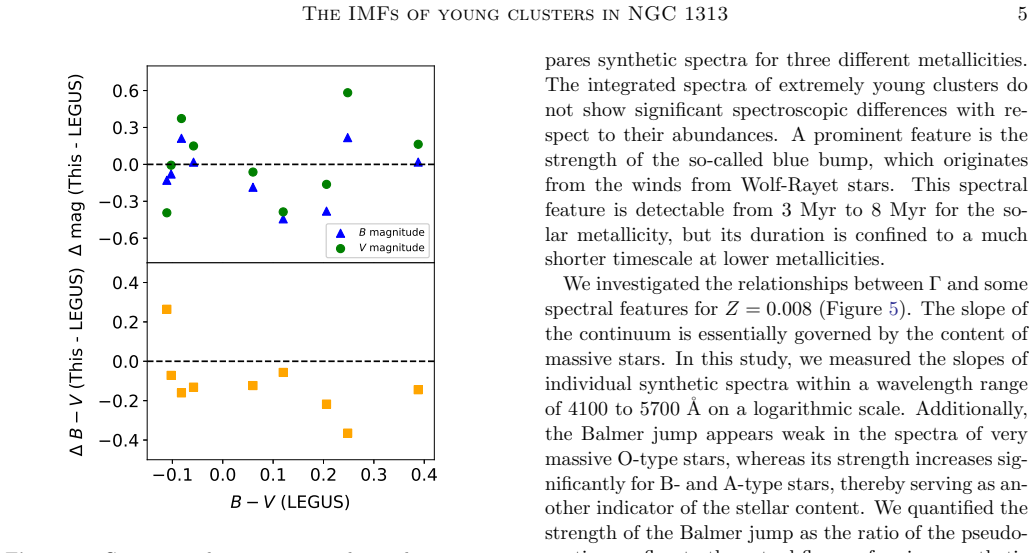
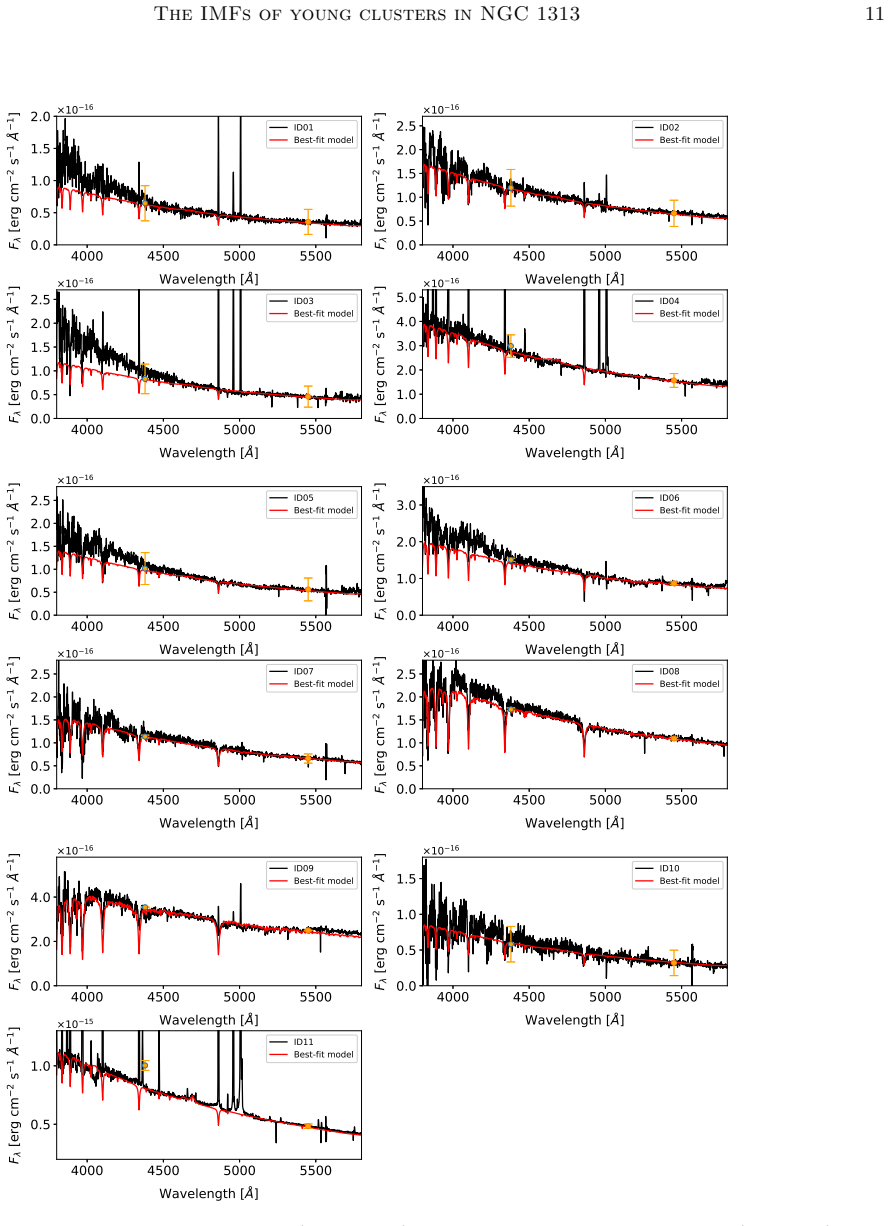
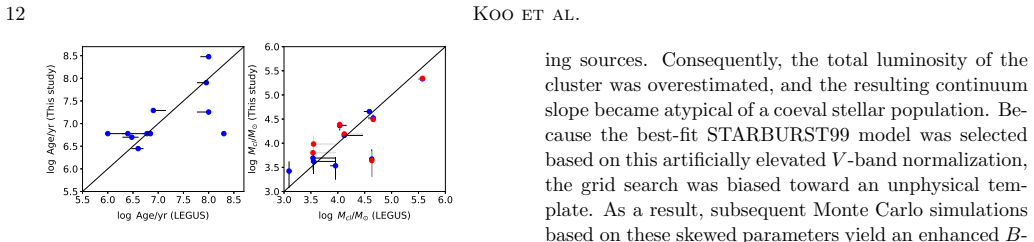
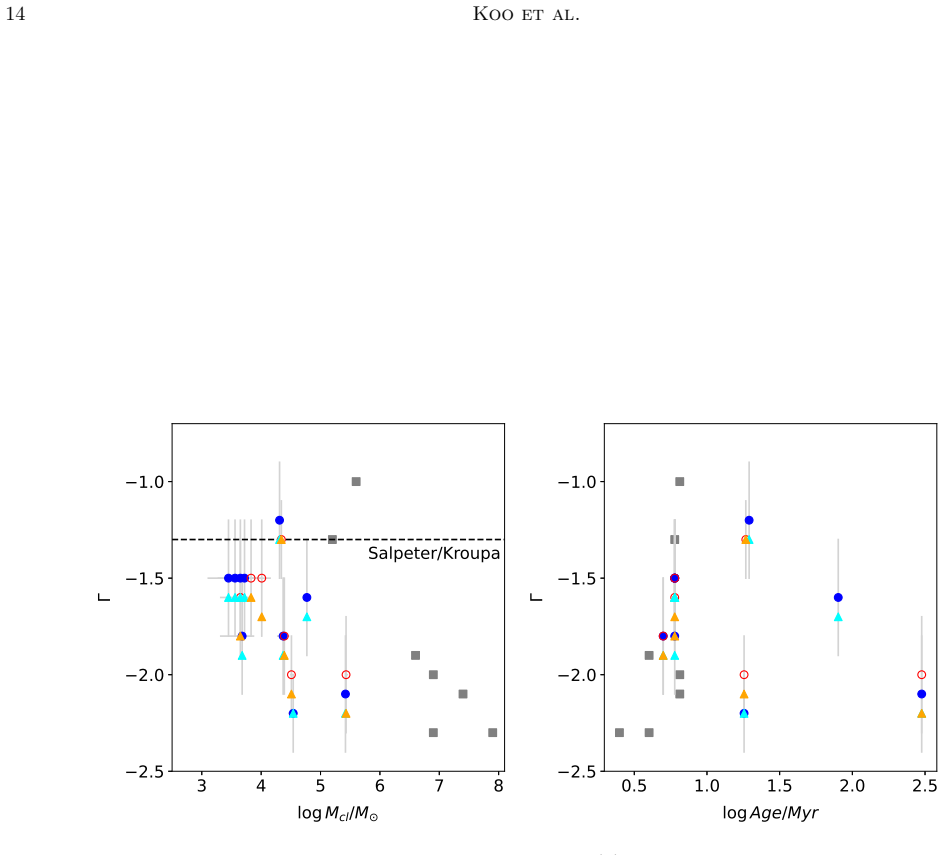
Utilizing constraints from absorption lines and Wolf-Rayet emission bands, the observed spectra of clusters aged 2.5 to 300 Myr with masses from 2.8×10^3 to 2.6×10^5 solar masses are matched to synthetic spectra. For stellar masses exceeding 0.8 solar masses, the power-law index Gamma of the underlying IMFs is smaller than the standard Salpeter/Kroupa IMF. A correlation exists where more massive clusters tend to possess top-light IMFs, consistent with trends in the Antennae Galaxies despite different mass scales.
What carries the argument
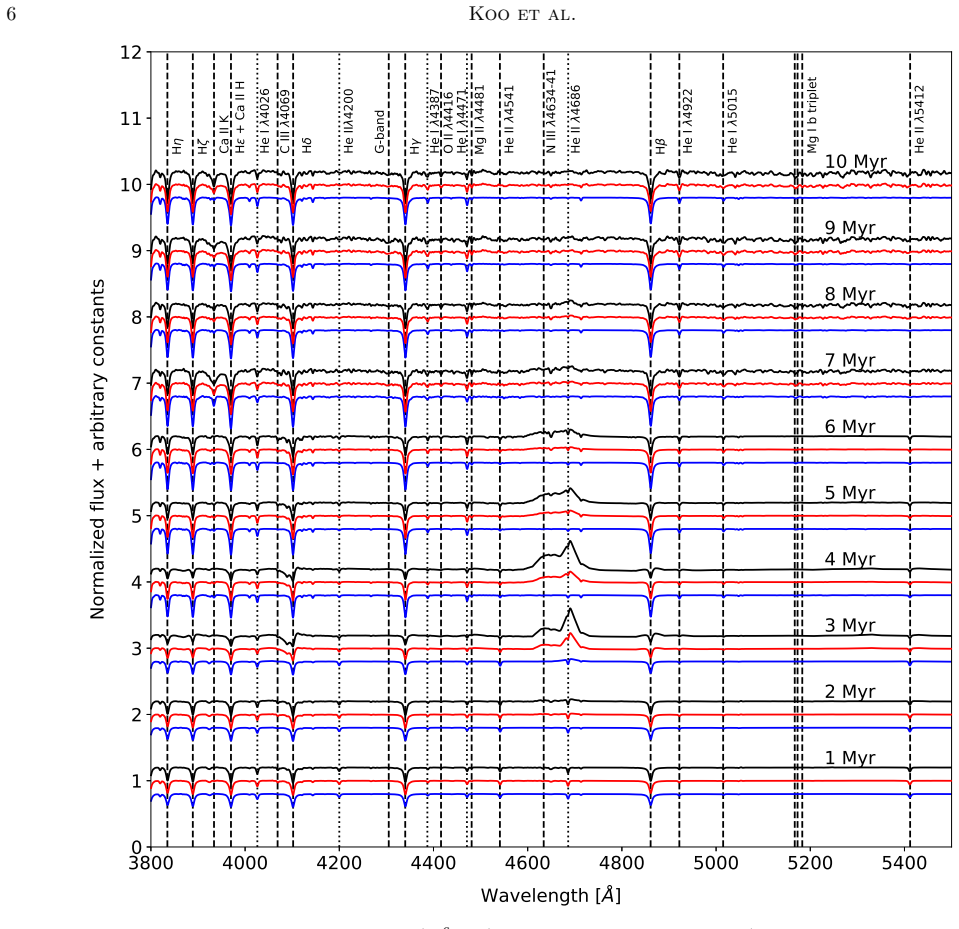
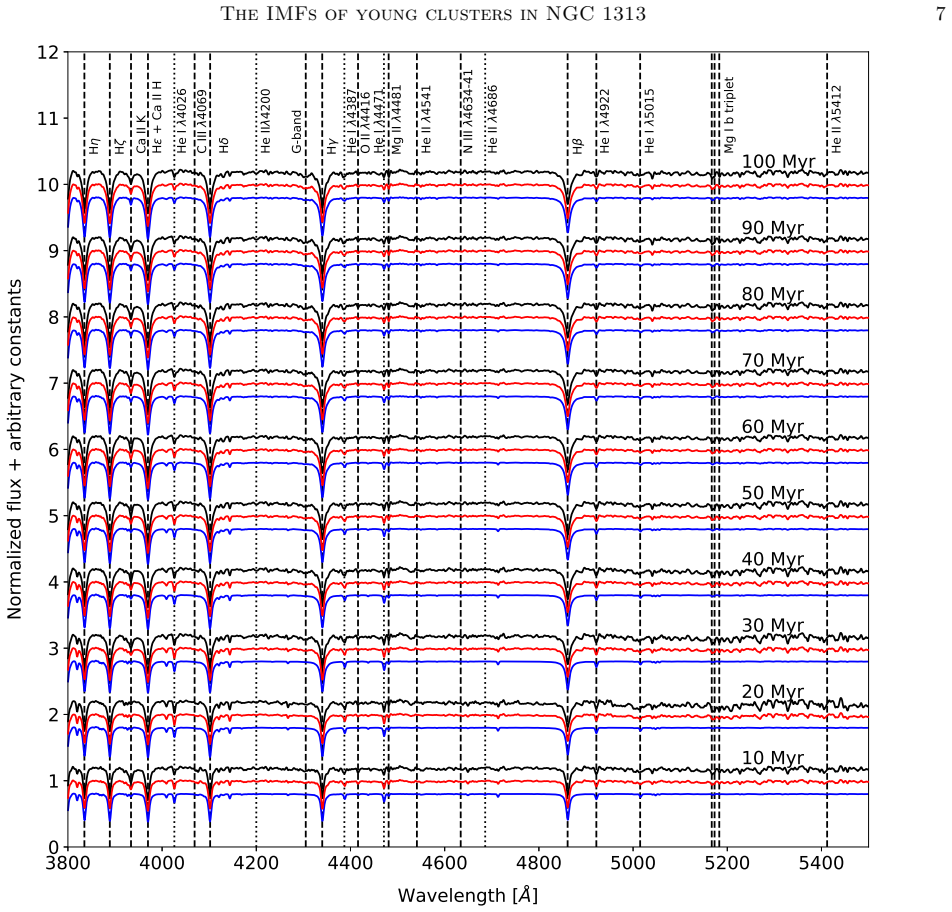
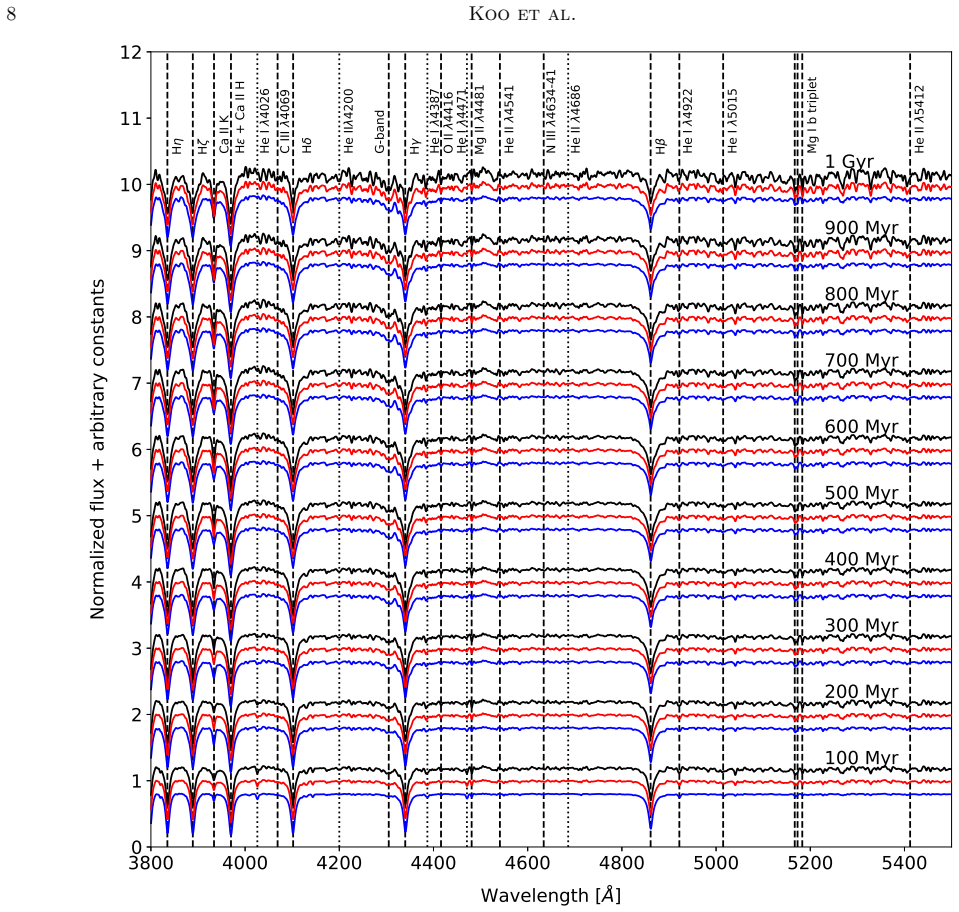
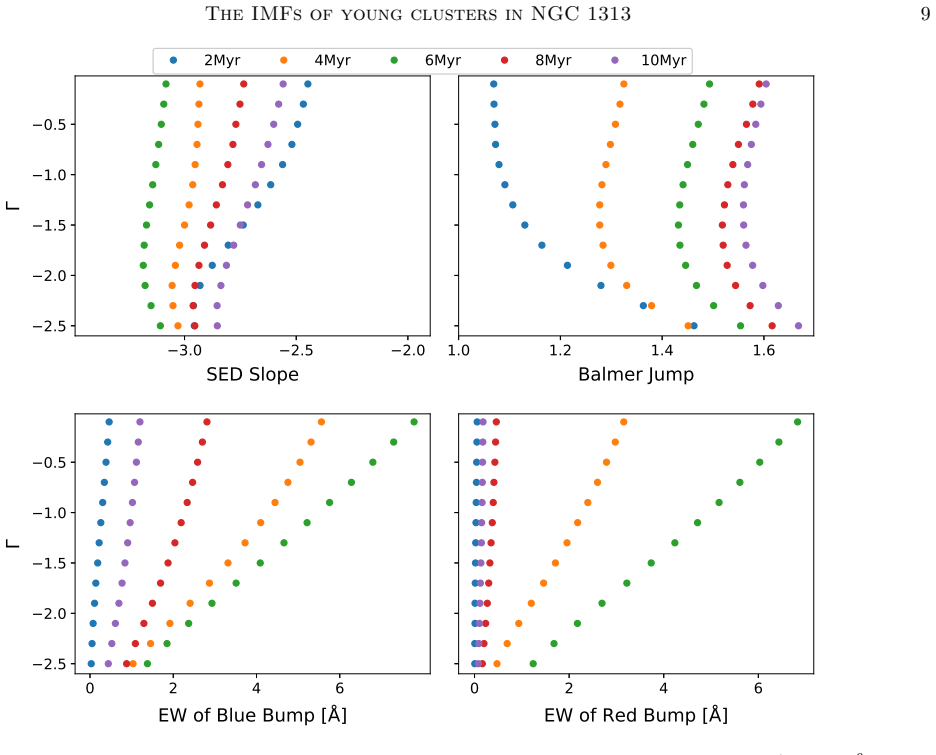
Simple stellar population model at fixed metallicity Z=0.008, fitted to spectral features including Wolf-Rayet bands to determine IMF slope Gamma.
If this is right
- The IMF is not universal but varies with cluster mass.
- More massive clusters have top-light IMFs.
- Applying a standard IMF to unresolved systems may lead to inaccurate mass and star formation estimates.
- Stochastic effects in low-mass clusters were accounted for via Monte Carlo simulations.
- The trend aligns with observations in other galaxies like the Antennae.
Where Pith is reading between the lines
- If the IMF varies systematically with cluster mass, models of galaxy formation must incorporate mass-dependent IMFs to accurately predict stellar populations.
- This could imply that the upper end of the IMF is suppressed in denser or more massive environments.
- Observations of integrated light in distant galaxies might need revision if top-light IMFs are common.
- Further spectroscopy of clusters in additional galaxies could test whether the mass-IMF correlation is universal.
Load-bearing premise
The adopted simple stellar population model with fixed metallicity Z=0.008 and chosen spectral features accurately captures the integrated light without major contributions from nebular emission or multiple stellar populations.
What would settle it
A spectrum from a cluster in NGC 1313 that is better fit by a standard Salpeter IMF model than by a shallower Gamma model, or the absence of any mass-dependent trend in a larger sample.
Figures


read the original abstract
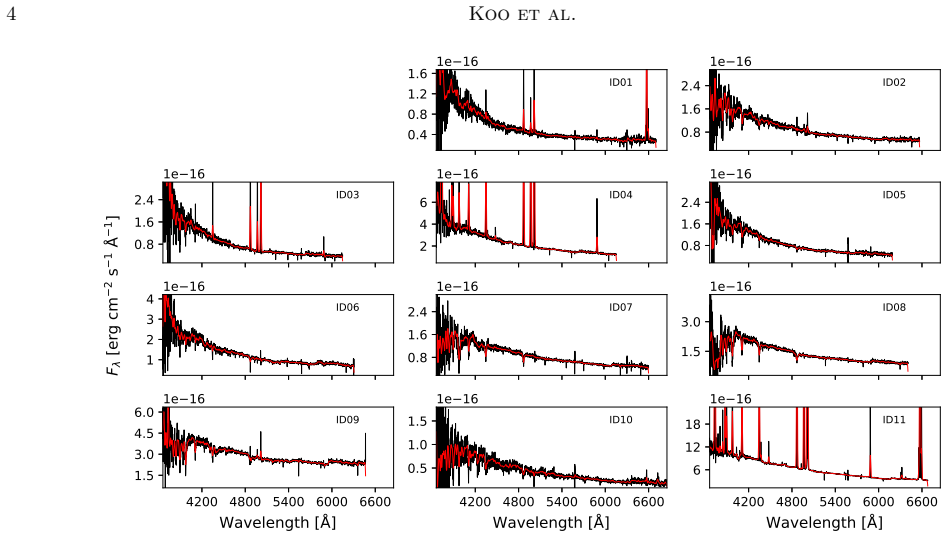
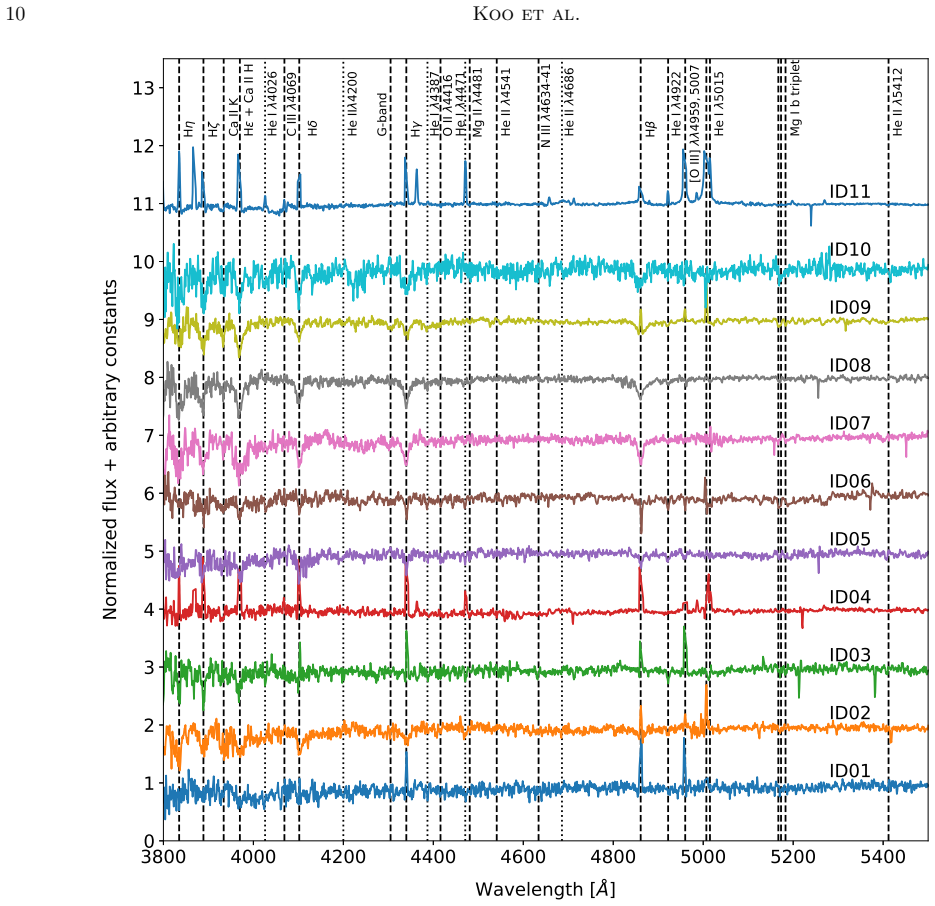
We present a spectroscopic study of young stellar clusters in the barred spiral galaxy NGC 1313. Integrated light spectra of 11 clusters, obtained using the GMOS-S instrument on the 8.1 m Gemini South telescope, are analyzed using a simple stellar population model. A subsolar metallicity (Z = 0.008) is adopted, consistent with previous studies. Cluster ages are constrained primarily through absorption lines and prominent emission bands of Wolf-Rayet stars. Utilizing these constraints, we match the observed spectra with synthetic counterparts generated from the simple stellar population model, determining key physical parameters including age, cluster mass, and the underlying initial mass function (IMF). Furthermore, the impact of stochastic sampling on the derived parameters of several low-mass clusters is rigorously evaluated using Monte Carlo simulations. The sampled clusters exhibit ages ranging from 2.5 to 300 Myr and stellar masses between 2.8 x 10^3 Msun and 2.6 x 10^5 Msun. Notably, for stellar masses exceeding 0.8 Msun, the power-law index (Gamma) of the underlying IMFs is found to be smaller than the standard Salpeter/Kroupa IMF. Furthermore, a correlation is observed where more massive clusters tend to possess top-light IMFs. This finding aligns with trends observed in the young clusters of the Antennae Galaxies, despite the differing mass scales between the two systems. Our results suggest that applying a universal standard IMF to spatially unresolved systems warrants caution, given the inherent complexities revealed in this study.
Editorial analysis
A structured set of objections, weighed in public.
Referee Report
Summary. The manuscript reports Gemini GMOS-S integrated-light spectroscopy of 11 young stellar clusters in NGC 1313. Ages (2.5–300 Myr) are constrained via absorption lines and Wolf-Rayet bands; spectra are then matched to SSP models at fixed Z=0.008 to derive cluster masses (2.8×10^3–2.6×10^5 M⊙) and the IMF power-law index Gamma above 0.8 M⊙. The central results are that Gamma is smaller than the Salpeter/Kroupa value and that more massive clusters exhibit more top-light IMFs; Monte Carlo simulations quantify stochastic sampling effects in the lower-mass systems.
Significance. If the model fits are robust, the work supplies direct evidence for IMF variation among young clusters and cautions against assuming a universal IMF for unresolved populations. The reported trend with cluster mass is consistent with findings in the Antennae, and the explicit Monte Carlo treatment of stochasticity is a methodological strength that improves reproducibility of the error budget.
major comments (2)
- [Abstract, paragraph on model adoption and age constraints] Abstract, paragraph on model adoption and age constraints: the claim that Gamma < Salpeter/Kroupa (and the mass correlation) is load-bearing on the assumption that the fixed-Z=0.008 SSP model reproduces the integrated spectra without significant nebular emission filling absorption features or unaccounted metallicity variations; no sensitivity tests to Z or added nebular components are described, leaving open the possibility that the inferred top-light slopes are systematic artifacts.
- [Monte Carlo simulations] Monte Carlo section: while stochastic sampling is evaluated for several low-mass clusters, the manuscript does not quantify how the derived Gamma–mass correlation changes when the Monte Carlo realizations are propagated through the full fitting pipeline, so it remains unclear whether the trend survives realistic age–mass–Gamma degeneracies.
minor comments (2)
- The exact mathematical definition of the power-law index Gamma (e.g., whether dN/dM ∝ M^Gamma with Gamma = −2.35 for Salpeter) should be stated explicitly when comparing to standard IMFs.
- A table listing individual cluster IDs, ages, masses, and Gamma values (with uncertainties) would improve traceability of the reported trends.
Simulated Author's Rebuttal
We thank the referee for the constructive report and the positive assessment of the work's significance. We respond to each major comment below.
read point-by-point responses
-
Referee: [Abstract, paragraph on model adoption and age constraints] Abstract, paragraph on model adoption and age constraints: the claim that Gamma < Salpeter/Kroupa (and the mass correlation) is load-bearing on the assumption that the fixed-Z=0.008 SSP model reproduces the integrated spectra without significant nebular emission filling absorption features or unaccounted metallicity variations; no sensitivity tests to Z or added nebular components are described, leaving open the possibility that the inferred top-light slopes are systematic artifacts.
Authors: The fixed metallicity Z=0.008 follows the value adopted in prior studies of NGC 1313. Age constraints rely primarily on Wolf-Rayet bands and absorption features, which are relatively insensitive to modest Z variations. We agree that explicit sensitivity tests would strengthen the analysis and will add tests varying Z around 0.008 together with an assessment of possible nebular emission contributions in the revised manuscript. revision: yes
-
Referee: [Monte Carlo simulations] Monte Carlo section: while stochastic sampling is evaluated for several low-mass clusters, the manuscript does not quantify how the derived Gamma–mass correlation changes when the Monte Carlo realizations are propagated through the full fitting pipeline, so it remains unclear whether the trend survives realistic age–mass–Gamma degeneracies.
Authors: The Monte Carlo realizations were used to evaluate stochastic effects on the parameters of the lowest-mass clusters. The reported Gamma–mass trend is driven by the higher-mass systems where stochastic sampling is negligible. We will nevertheless propagate the Monte Carlo realizations through the full fitting procedure and re-evaluate the correlation to quantify any impact from age–mass–Gamma degeneracies. revision: yes
Circularity Check
No circularity: IMF parameters are fitted outputs from independent spectra
full rationale
The paper constrains cluster ages from absorption lines and WR features, then fits SSP model spectra (at fixed Z=0.008) to the observed integrated light to obtain mass and Gamma. These fitted Gamma values and the reported mass correlation are direct results of applying the model to external Gemini GMOS-S data for 11 clusters; they are not presupposed by definition, obtained via self-citation chains, or renamed known results. The procedure is standard parameter inference with stated model assumptions and Monte Carlo checks for stochasticity; no load-bearing step reduces the claimed IMF variation to an input by construction.
Axiom & Free-Parameter Ledger
free parameters (2)
- IMF power-law index Gamma
- Cluster age and total mass
axioms (2)
- domain assumption Simple stellar population models with Z=0.008 accurately reproduce the integrated spectra of the clusters
- domain assumption Stochastic sampling effects in low-mass clusters are fully captured by the Monte Carlo simulations performed
Reference graph
Works this paper leans on
-
[1]
, archivePrefix = "arXiv", eprint =
Adamo, A., Ryon, J. E., Messa, M., et al. 2017, ApJ, 841, 131, doi: 10.3847/1538-4357/aa7132 Astropy Collaboration, Robitaille, T. P., Tollerud, E. J., et al. 2013, A&A, 558, A33, doi: 10.1051/0004-6361/201322068 Astropy Collaboration, Price-Whelan, A. M., Sip˝ ocz, B. M. , et al. 2018, AJ, 156, 123, doi: 10.3847/1538-3881/aabc4f Astropy Collaboration, Pr...
-
[2]
Bastian, N., Covey, K. R., & Meyer, M. R. 2010, ARA&A, 48, 339, doi: 10.1146/annurev-astro-082708-101642
-
[3]
Calzetti, D., Lee, J. C., Sabbi, E., et al. 2015, AJ, 149, 51, doi: 10.1088/0004-6256/149/2/51
-
[4]
Cantat-Gaudin, T., Jordi, C., Vallenari, A., et al. 2018, A&A, 618, A93, doi: 10.1051/0004-6361/201833476 Cervi˜ no, M. 2013, NewAR, 57, 123, doi: 10.1016/j.newar.2013.09.001
-
[5]
Davies, B., Clark, J. S., Trombley, C., et al. 2012, MNRAS, 419, 1871, doi: 10.1111/j.1365-2966.2011.19736.x
-
[6]
Deger, S., Lee, J. C., Whitmore, B. C., et al. 2022, MNRAS, 510, 32, doi: 10.1093/mnras/stab3213 Ekstr¨ om, S., Georgy, C., Eggenberger, P., et al. 2012, A&A, 537, A146, doi: 10.1051/0004-6361/201117751
-
[7]
Elmegreen, B. G. 2000, ApJ, 539, 342, doi: 10.1086/309204
-
[8]
Filippenko, A. V. 1982, PASP, 94, 715, doi: 10.1086/131052
-
[9]
Finn, M. K., Johnson, K. E., Indebetouw, R., et al. 2024a, ApJ, 964, 13, doi: 10.3847/1538-4357/ad198a —. 2024b, ApJ, 964, 12, doi: 10.3847/1538-4357/ad1eec
-
[10]
doi:10.5281/zenodo.14712174 , version =
Fouesneau, M. 2025, pyphot, pyphot v2.0.0, Zenodo, doi: 10.5281/zenodo.14712174
-
[11]
2013, A&A, 558, A103, doi: 10.1051/0004-6361/201322178
Georgy, C., Ekstr¨ om, S., Eggenberger, P., et al. 2013, A&A, 558, A103, doi: 10.1051/0004-6361/201322178
-
[12]
Greissl, J., Meyer, M. R., Christopher, M. H., & Scoville, N. Z. 2010, ApJ, 710, 1746, doi: 10.1088/0004-637X/710/2/1746
-
[13]
Gunawardhana, M. L. P., Hopkins, A. M., Sharp, R. G., et al. 2011, MNRAS, 415, 1647, doi: 10.1111/j.1365-2966.2011.18800.x
-
[14]
2008, ApJ, 675, 1319, doi: 10.1086/524650
Harayama, Y., Eisenhauer, F., & Martins, F. 2008, ApJ, 675, 1319, doi: 10.1086/524650
-
[15]
2017, A&A, 603, A119, doi: 10.1051/0004-6361/201730550
Hernandez, S., Larsen, S., Trager, S., Groot, P., & Kaper, L. 2017, A&A, 603, A119, doi: 10.1051/0004-6361/201730550
-
[16]
2022, AJ, 164, 89, doi: 10.3847/1538-3881/ac7ebe
Jones, L. 2022, AJ, 164, 89, doi: 10.3847/1538-3881/ac7ebe
-
[17]
Hosek, Jr., M. W., Lu, J. R., Anderson, J., et al. 2019, ApJ, 870, 44, doi: 10.3847/1538-4357/aaef90
-
[18]
2015, MNRAS, 446, 3797, doi: 10.1093/mnras/stu2329
Hur, H., Park, B.-G., Sung, H., et al. 2015, MNRAS, 446, 3797, doi: 10.1093/mnras/stu2329
-
[19]
Jacobs, B. A., Rizzi, L., Tully, R. B., et al. 2009, AJ, 138, 332, doi: 10.1088/0004-6256/138/2/332
-
[20]
2025, AJ, 169, 7, doi: 10.3847/1538-3881/ad8e3b The IMFs of young clusters in NGC 1313 19
Koo, J.-R., Kim, H.-J., & Lim, B. 2025, AJ, 169, 7, doi: 10.3847/1538-3881/ad8e3b The IMFs of young clusters in NGC 1313 19
-
[21]
2001, MNRAS, 322, 231, doi: 10.1046/j.1365-8711.2001.04022.x
Kroupa, P. 2001, MNRAS, 322, 231, doi: 10.1046/j.1365-8711.2001.04022.x
-
[22]
R., Fumagalli, M., da Silva, R
Krumholz, M. R., Fumagalli, M., da Silva, R. L., Rendahl, T., & Parra, J. 2015, MNRAS, 452, 1447, doi: 10.1093/mnras/stv1374
-
[23]
2023, Research Notes of the American Astronomical Society, 7, 214, doi: 10.3847/2515-5172/ad0044
Labrie, K., Simpson, C., Cardenes, R., et al. 2023, Research Notes of the American Astronomical Society, 7, 214, doi: 10.3847/2515-5172/ad0044
-
[24]
Disentangling the independently controllable factors of variation by interacting with the world
Lada, C. J., & Lada, E. A. 2003, ARA&A, 41, 57, doi: 10.1146/annurev.astro.41.011802.094844
work page internal anchor Pith review Pith/arXiv arXiv doi:10.1146/annurev.astro.41.011802.094844 2003
-
[25]
Larsen, S. S., Mora, M. D., Brodie, J. P., & Richtler, T. 2007, in IAU Symposium, Vol. 241, Stellar Populations as Building Blocks of Galaxies, ed. A. Vazdekis & R. Peletier, 435–439, doi: 10.1017/S1743921307008708
-
[26]
Leisawitz, D., Bash, F. N., & Thaddeus, P. 1989, ApJS, 70, 731, doi: 10.1086/191357
-
[27]
2014, ApJS, 212, 14, doi: 10.1088/0067-0049/212/1/14
Leitherer, C., Ekstr¨ om, S., Meynet, G., et al. 2014, ApJS, 212, 14, doi: 10.1088/0067-0049/212/1/14
-
[28]
Starburst99: Synthesis Models for Galaxies with Active Star Formation
Leitherer, C., Schaerer, D., Goldader, J. D., et al. 1999, ApJS, 123, 3, doi: 10.1086/313233
work page internal anchor Pith review doi:10.1086/313233 1999
-
[29]
Liermann, A., Hamann, W. R., Oskinova, L. M., Todt, H., & Butler, K. 2010, A&A, 524, A82, doi: 10.1051/0004-6361/200912612
-
[30]
2013, AJ, 145, 46, doi: 10.1088/0004-6256/145/2/46
Lim, B., Chun, M.-Y., Sung, H., et al. 2013, AJ, 145, 46, doi: 10.1088/0004-6256/145/2/46
-
[31]
2024, ApJ, 961, 72, doi: 10.3847/1538-4357/ad12c4
Lim, B., Naz´ e, Y., Chang, S.-J., & Hutsem´ ekers, D. 2024, ApJ, 961, 72, doi: 10.3847/1538-4357/ad12c4
-
[32]
Lim, B., Sung, H., Bessell, M. S., et al. 2015, AJ, 149, 127, doi: 10.1088/0004-6256/149/4/127
-
[33]
2017, in IAU
Lim, B., Sung, H., Hur, H., & Park, B.-G. 2017, in IAU
2017
-
[34]
316, Formation, Evolution, and Survival of Massive Star Clusters, ed
Symposium, Vol. 316, Formation, Evolution, and Survival of Massive Star Clusters, ed. C. Charbonnel & A. Nota, 357–358, doi: 10.1017/S1743921315010595 —. 2018, MNRAS, 477, 1993, doi: 10.1093/mnras/sty713
-
[35]
Marks, M., Kroupa, P., Dabringhausen, J., & Pawlowski, M. S. 2012, MNRAS, 422, 2246, doi: 10.1111/j.1365-2966.2012.20767.x
-
[36]
and Sabbi, Elena and Smith, Linda J
Messa, M., Calzetti, D., Adamo, A., et al. 2021, ApJ, 909, 121, doi: 10.3847/1538-4357/abe0b5
-
[37]
Miller, G. E., & Scalo, J. M. 1979, ApJS, 41, 513, doi: 10.1086/190629
-
[38]
Peters, W. L., Freeman, K. C., Forster, J. R., Manchester, R. N., & Ables, J. G. 1994, MNRAS, 269, 1025, doi: 10.1093/mnras/269.4.1025
-
[39]
2003, AJ, 126, 1916, doi: 10.1086/377623
Porras, A., Christopher, M., Allen, L., et al. 2003, AJ, 126, 1916, doi: 10.1086/377623
-
[40]
2015, ApJ, 799, 19, doi: 10.1088/0004-637X/799/1/19
Qing, G., Wang, W., Liu, J.-F., & Yoachim, P. 2015, ApJ, 799, 19, doi: 10.1088/0004-637X/799/1/19
-
[41]
2018, ApJS, 235, 23, doi: 10.3847/1538-4365/aaa8e5
Sabbi, E., Calzetti, D., Ubeda, L., et al. 2018, ApJS, 235, 23, doi: 10.3847/1538-4365/aaa8e5
-
[42]
Salpeter, E. E. 1955, ApJ, 121, 161, doi: 10.1086/145971
-
[43]
Sanders, D. B., Solomon, P. M., & Scoville, N. Z. 1984, ApJ, 276, 182, doi: 10.1086/161602 Schlafly, E. F., & Finkbeiner, D. P. 2011, ApJ, 737, 103, doi: 10.1088/0004-637X/737/2/103
-
[44]
Debajyoti Sengupta, Stephen Mulligan, David Shih, John Andrew Raine, and Tobias Golling
Schlegel, D. J., Finkbeiner, D. P., & Davis, M. 1998, ApJ, 500, 525, doi: 10.1086/305772
work page internal anchor Pith review doi:10.1086/305772 1998
-
[45]
Silva-Villa, E., & Larsen, S. S. 2012, MNRAS, 423, 213, doi: 10.1111/j.1365-2966.2012.20797.x
-
[46]
Simpson, C., Labrie, K., Teal, D. J., et al. 2024, DRAGONS, 3.2.0, Zenodo, doi: 10.5281/zenodo.10841622
-
[47]
2015, ApJ, 812, 39, doi: 10.1088/0004-637X/812/1/39
Stanghellini, L., Magrini, L., & Casasola, V. 2015, ApJ, 812, 39, doi: 10.1088/0004-637X/812/1/39
-
[48]
Stone, R. P. S., & Baldwin, J. A. 1983, MNRAS, 204, 347, doi: 10.1093/mnras/204.2.347
-
[49]
Sung, H., & Bessell, M. S. 2004, AJ, 127, 1014, doi: 10.1086/381297
-
[50]
2013, A&A, 554, A8, doi: 10.1051/0004-6361/201220294
Suzuki, T., Kaneda, H., & Onaka, T. 2013, A&A, 554, A8, doi: 10.1051/0004-6361/201220294
-
[51]
Walsh, J. R., & Roy, J.-R. 1997, MNRAS, 288, 726, doi: 10.1093/mnras/288.3.726
-
[52]
2004, MNRAS, 354, 1020, doi: 10.1111/j.1365-2966.2004.08261.x
Weidner, C., & Kroupa, P. 2004, MNRAS, 348, 187, doi: 10.1111/j.1365-2966.2004.07340.x
-
[53]
Wouterloot, J. G. A., Brand, J., Burton, W. B., & Kwee, K. K. 1990, A&A, 230, 21
1990
-
[54]
2025, AJ, 169, 214, doi: 10.3847/1538-3881/adba45
Yang, G., Zhao, J., Yang, Y., et al. 2025, AJ, 169, 214, doi: 10.3847/1538-3881/adba45
-
[55]
Yong, D., Carney, B. W., & Friel, E. D. 2012, AJ, 144, 95, doi: 10.1088/0004-6256/144/4/95
discussion (0)
Sign in with ORCID, Apple, or X to comment. Anyone can read and Pith papers without signing in.