Statistical and Structural Approaches to Algorithmic Fairness
Pith reviewed 2026-06-26 01:38 UTC · model grok-4.3
The pith
Algorithmic fairness requires moving beyond deterministic point estimates and isolated individual views to include structural context.
A machine-rendered reading of the paper's core claim, the machinery that carries it, and where it could break.
Core claim
Early fairness mitigation strategies rested on fragile simplifications that limited effectiveness in complex socio-technical environments. This thesis identifies and addresses two fundamental limitations of contemporary fairness paradigms: the reliance on deterministic point estimates for auditing and the treatment of individuals as isolated entities devoid of structural context.
What carries the argument
Statistical and structural approaches that replace point estimates with uncertainty-aware auditing and embed individuals within relational and environmental contexts.
If this is right
- Fairness auditing will shift from single deterministic values to methods that incorporate statistical variability and uncertainty.
- Assessments will treat individuals as embedded in structural positions rather than as isolated data points.
- Mitigation strategies will become more robust when applied inside complex socio-technical systems.
- Models will more directly confront how environmental inequalities propagate through algorithmic decisions.
Where Pith is reading between the lines
- Deployed systems affecting opportunities could face requirements to document structural context in addition to standard fairness metrics.
- Data collection practices might need to capture relational information such as network position or community membership to enable the new approaches.
- Toolkits for practitioners could incorporate graph or embedding layers that represent structural context when computing fairness scores.
- Longitudinal studies could test whether the proposed methods produce sustained reductions in disparate outcomes across multiple deployment cycles.
Load-bearing premise
The two listed limitations of point estimates and isolated individuals are the central problems whose removal will materially improve fairness outcomes in socio-technical systems.
What would settle it
A controlled deployment comparison in which fairness metrics and outcomes using distributional estimates plus structural context show no material reduction in disadvantage relative to standard point-estimate group fairness methods.
Figures


read the original abstract
Modern machine learning systems have outgrown their origins as isolated predictive constructs, evolving into complex socio-technical architectures that actively mediate human opportunity. As algorithms increasingly determine access to economic and social opportunities, it has become widely recognized that these systems are deeply embedded with the structural inequalities and prejudices of their environments. The field of algorithmic fairness emerged in response to the growing recognition that models optimized for predictive accuracy can systematically disadvantage marginalized groups. Early mitigation strategies, however, rested on fragile simplifications that limited their effectiveness in complex socio-technical environments. This thesis identifies and addresses two fundamental limitations of contemporary fairness paradigms: the reliance on deterministic point estimates for auditing and the treatment of individuals as isolated entities devoid of structural context.
Editorial analysis
A structured set of objections, weighed in public.
Referee Report
Summary. This thesis abstract claims that contemporary algorithmic fairness paradigms are limited by two fundamental issues: reliance on deterministic point estimates for auditing fairness and modeling individuals as isolated entities without structural context. It states that the thesis identifies and addresses these limitations in socio-technical ML systems.
Significance. If the thesis were to supply rigorous derivations, empirical demonstrations, or comparative analyses showing that interventions on these two axes produce larger fairness gains than alternatives, the work could meaningfully advance the field beyond current point-estimate and individual-level approaches. The abstract supplies none of this evidence, so the potential significance cannot be assessed from the provided material.
major comments (1)
- [Abstract] Abstract, paragraph 3: The assertion that reliance on deterministic point estimates and isolated-individual modeling are the two central, load-bearing limitations is presented without any comparative analysis, outcome deltas, or literature synthesis demonstrating that these dominate other documented problems such as training-data provenance, causal identifiability, or deployment feedback loops.
Simulated Author's Rebuttal
We thank the referee for their review. We respond to the single major comment below, focusing on the justification for the two limitations highlighted in the abstract.
read point-by-point responses
-
Referee: [Abstract] Abstract, paragraph 3: The assertion that reliance on deterministic point estimates and isolated-individual modeling are the two central, load-bearing limitations is presented without any comparative analysis, outcome deltas, or literature synthesis demonstrating that these dominate other documented problems such as training-data provenance, causal identifiability, or deployment feedback loops.
Authors: The abstract is a concise summary; the full thesis contains the requested literature synthesis, comparative discussion of alternative limitations (including data provenance and causal issues), and empirical demonstrations of the relative impact of addressing point-estimate and structural-modeling shortcomings. We agree the abstract itself does not convey this supporting material and will revise it to include a brief clause referencing the comparative framework and outcome analyses developed in Chapters 3–5. revision: yes
Circularity Check
No circularity: identification claim with no derivation chain
full rationale
The abstract presents an identification of two limitations as fundamental but supplies no equations, derivations, fitted parameters, or self-citations. No load-bearing step reduces to its own inputs by construction, self-definition, or renaming. The central claim is a problem statement rather than a predictive or uniqueness derivation, so no circularity patterns apply. Full text reference yields the same absence of visible mathematical structure.
Axiom & Free-Parameter Ledger
Reference graph
Works this paper leans on
-
[1]
Technology and history: Kranzberg’s laws,
M. Kranzberg, “Technology and history: Kranzberg’s laws,”Technology and culture, vol. 27, no. 3, pp. 544–560, 1986
1986
-
[2]
Fairness through awareness,
C. Dwork, M. Hardt, T. Pitassi, O. Reingold, and R. Zemel, “Fairness through awareness,” inProceedings of the 3rd innovations in theoretical computer science conference, 2012, pp. 214–226
2012
-
[3]
Equality of opportunity in super- vised learning,
M. Hardt, E. Price, and N. Srebro, “Equality of opportunity in super- vised learning,”Advances in neural information processing systems, vol. 29, 2016
2016
-
[4]
An analysis of the eeocc “four-fifths
I. Greenberg, “An analysis of the eeocc “four-fifths” rule,”Management Science, vol. 25, no. 8, pp. 762–769, 1979
1979
-
[5]
Sch¨ olkopf and A
B. Sch¨ olkopf and A. J. Smola,Learning with Kernels: Support Vector Ma- chines, Regularization, Optimization, and Beyond. MIT Press, 2002
2002
-
[6]
Birds of a feather: Ho- mophily in social networks,
M. McPherson, L. Smith-Lovin, and J. M. Cook, “Birds of a feather: Ho- mophily in social networks,”Annual review of sociology, vol. 27, no. 1, pp. 415–444, 2001
2001
-
[7]
Emergence of scaling in random networks,
A.-L. Barab´ asi and R. Albert, “Emergence of scaling in random networks,” science, vol. 286, no. 5439, pp. 509–512, 1999
1999
-
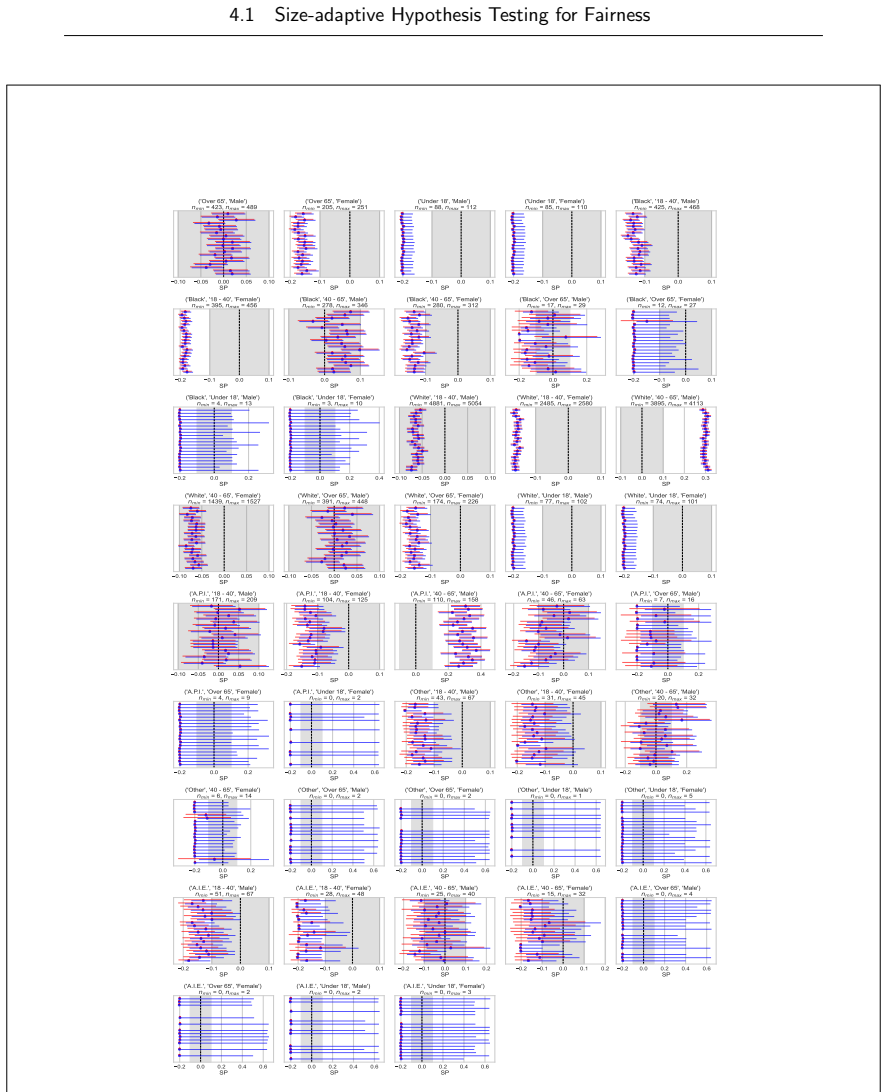
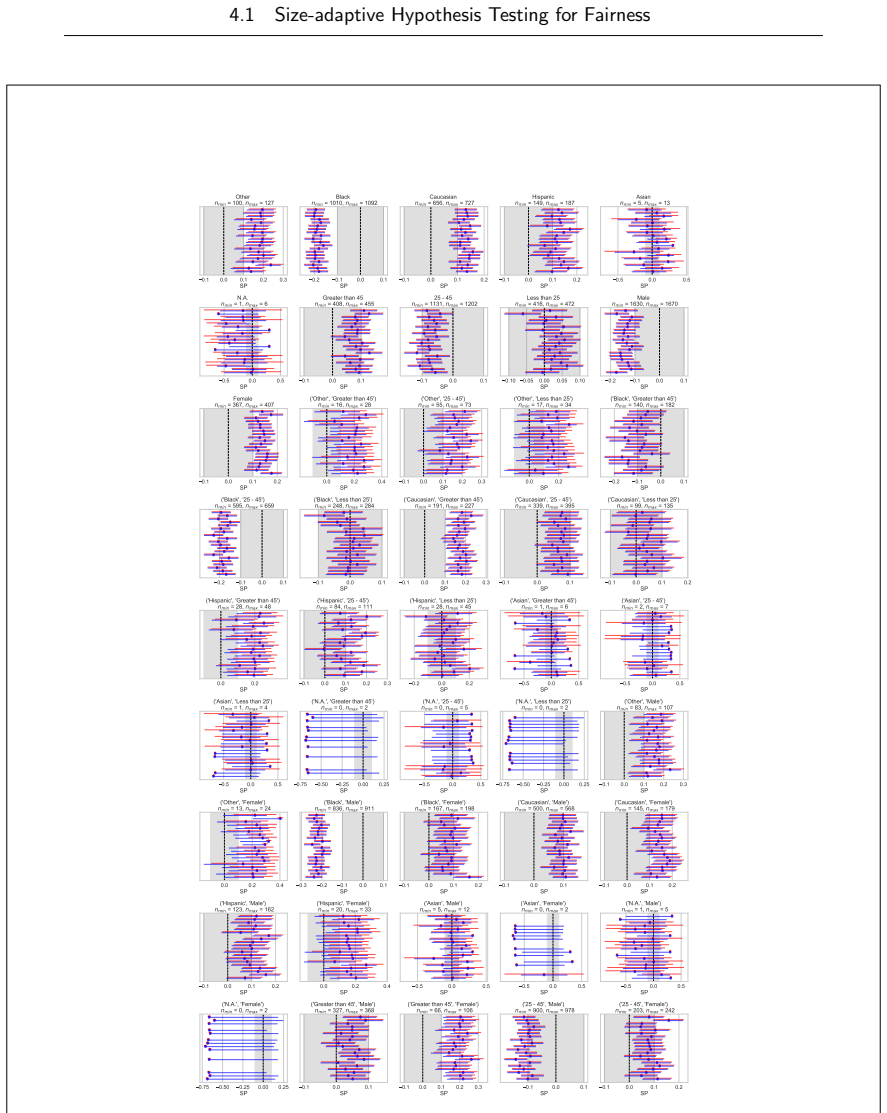
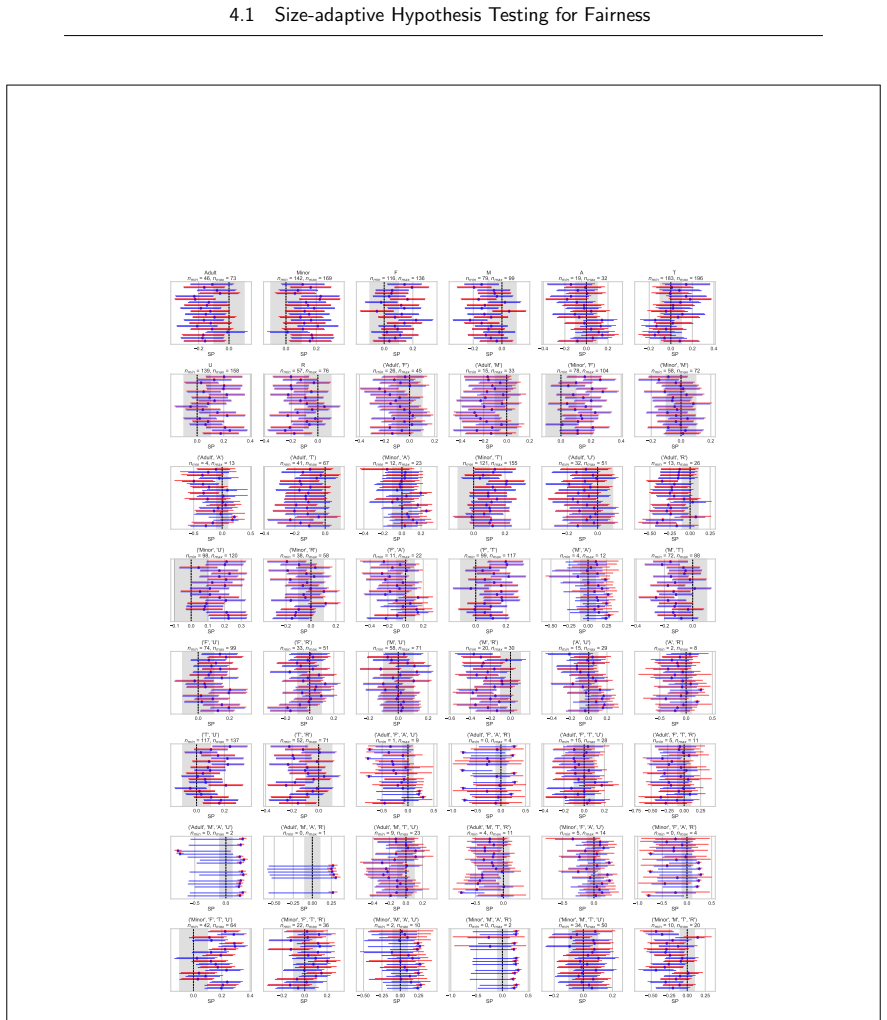
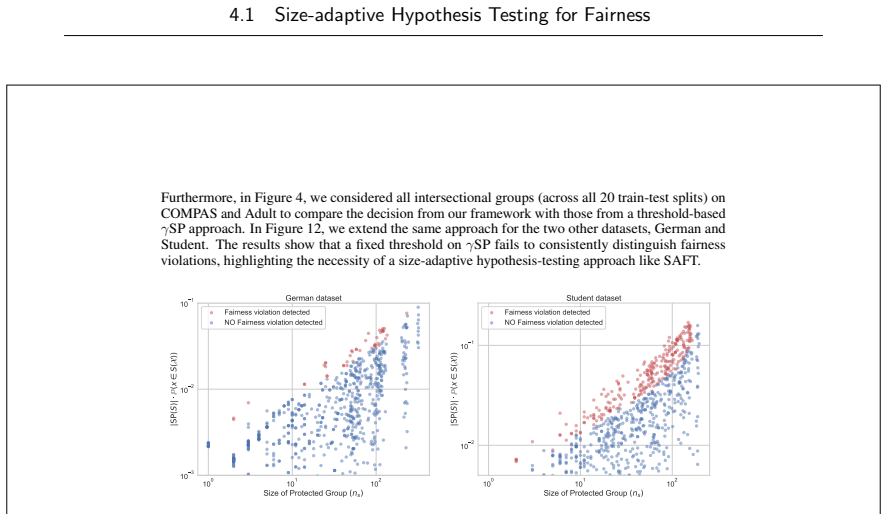
[8]
Size-adaptive hypothesis testing for fairness,
A. Ferrara, F. Cozzi, A. Perotti, A. Panisson, and F. Bonchi, “Size-adaptive hypothesis testing for fairness,”Advances in neural information processing systems, vol. 38, 2025
2025
-
[9]
Auditing for demographic bias in opaque rankings,
A. Ferrara, C. Abrate, F. Vitale, and F. Bonchi, “Auditing for demographic bias in opaque rankings,”Proceedings of the VLDB Endowment, vol. 19, 2026
2026
-
[10]
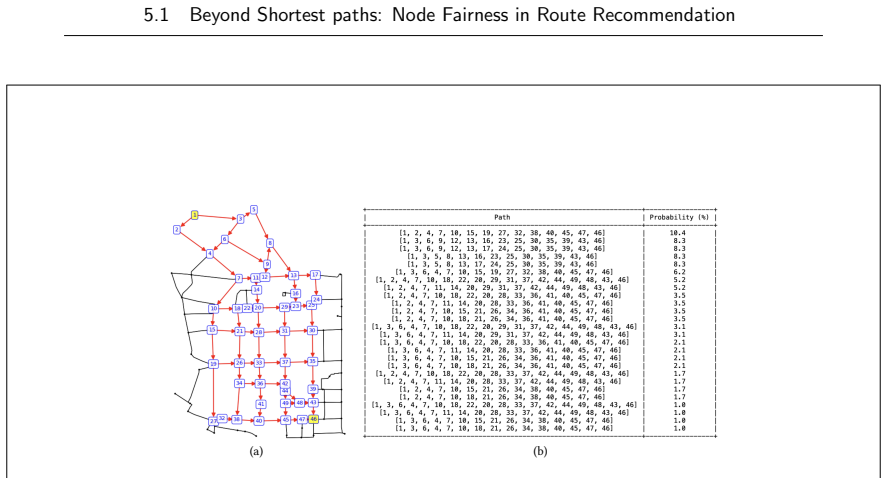
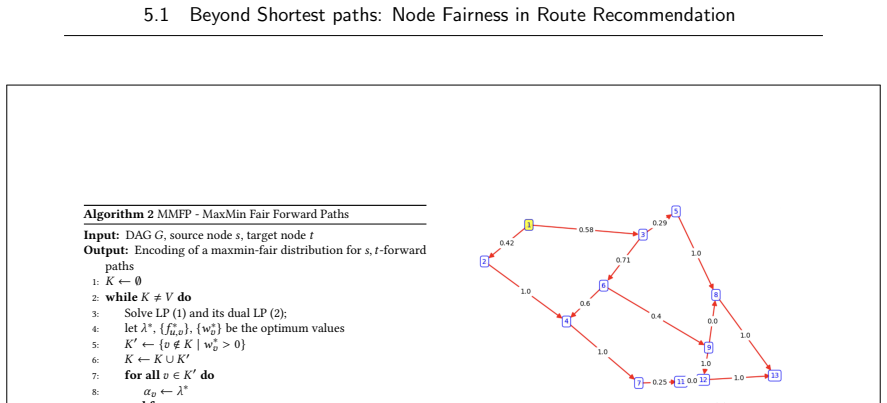
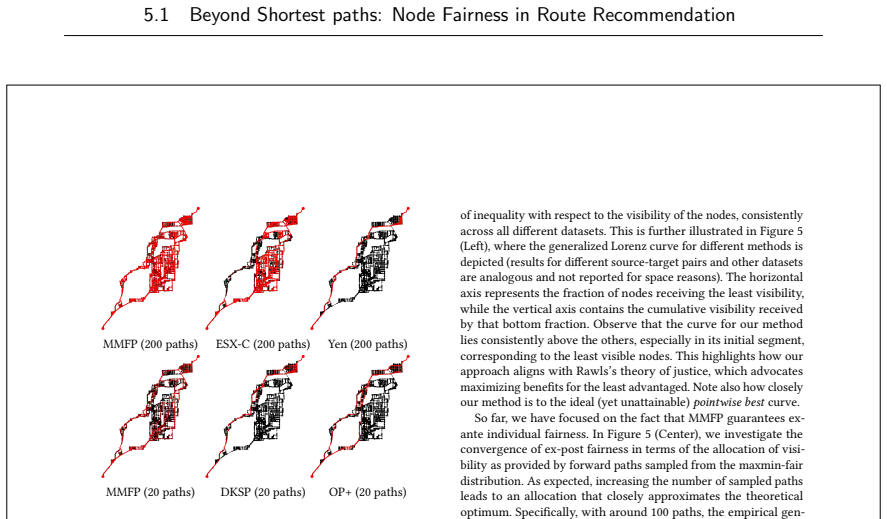
Beyond shortest paths: Node fairness in route recommendation,
A. Ferrara, D. Garc´ ıa-Soriano, and F. Bonchi, “Beyond shortest paths: Node fairness in route recommendation,”Proceedings of the VLDB En- dowment, vol. 18, no. 9, pp. 3230–3242, 2025
2025
-
[11]
Bias-aware ranking from pairwise comparisons,
A. Ferrara, F. Bonchi, F. Fabbri, F. Karimi, and C. Wagner, “Bias-aware ranking from pairwise comparisons,”Data Mining and Knowledge Discov- ery, vol. 38, no. 4, pp. 2062–2086, 2024
2062
-
[12]
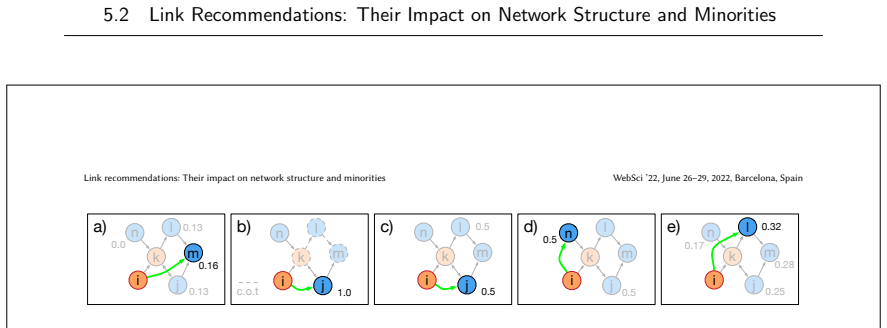
Link recommen- dations: Their impact on network structure and minorities,
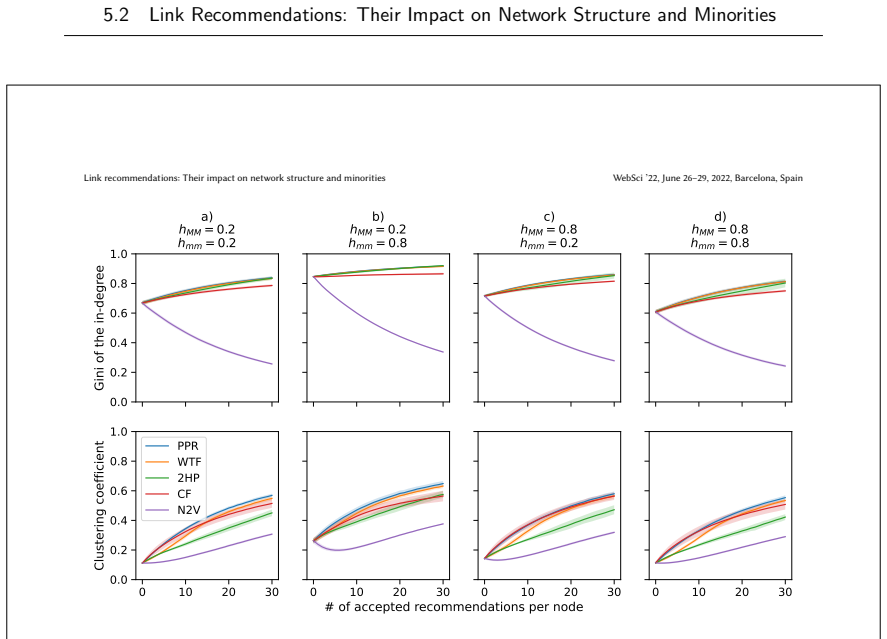
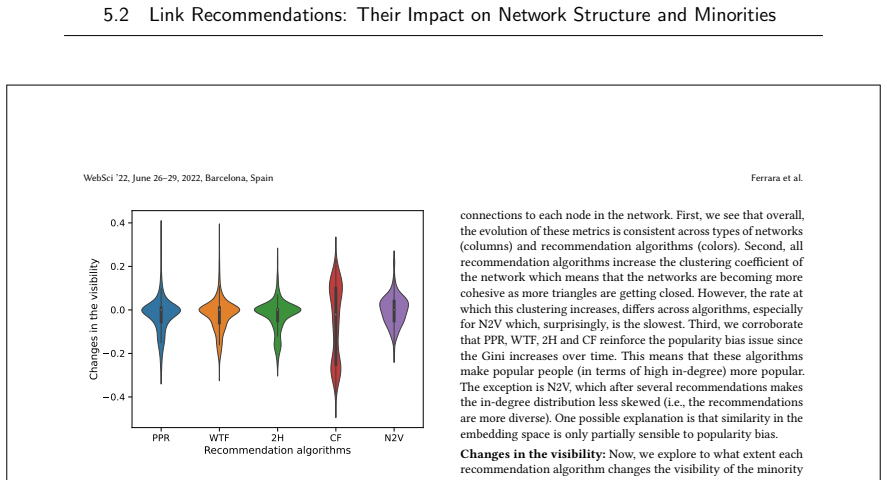
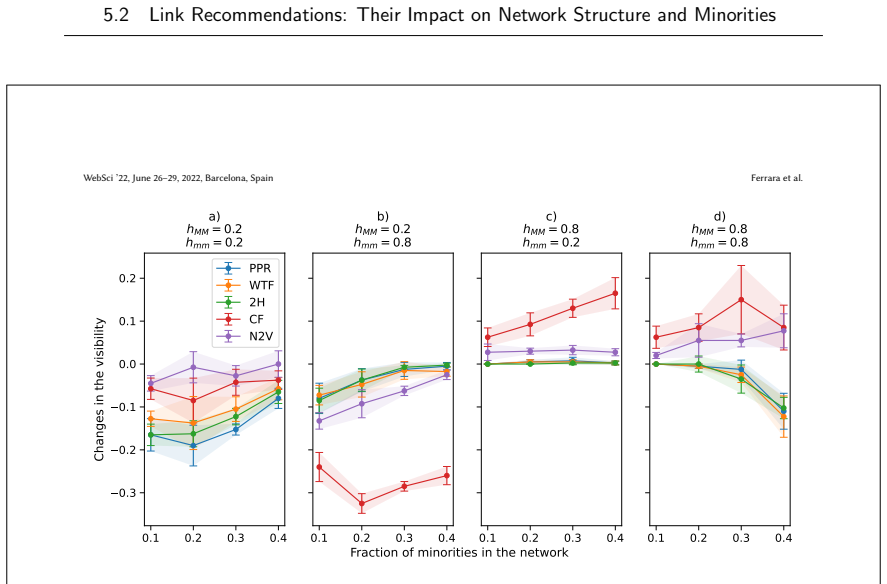
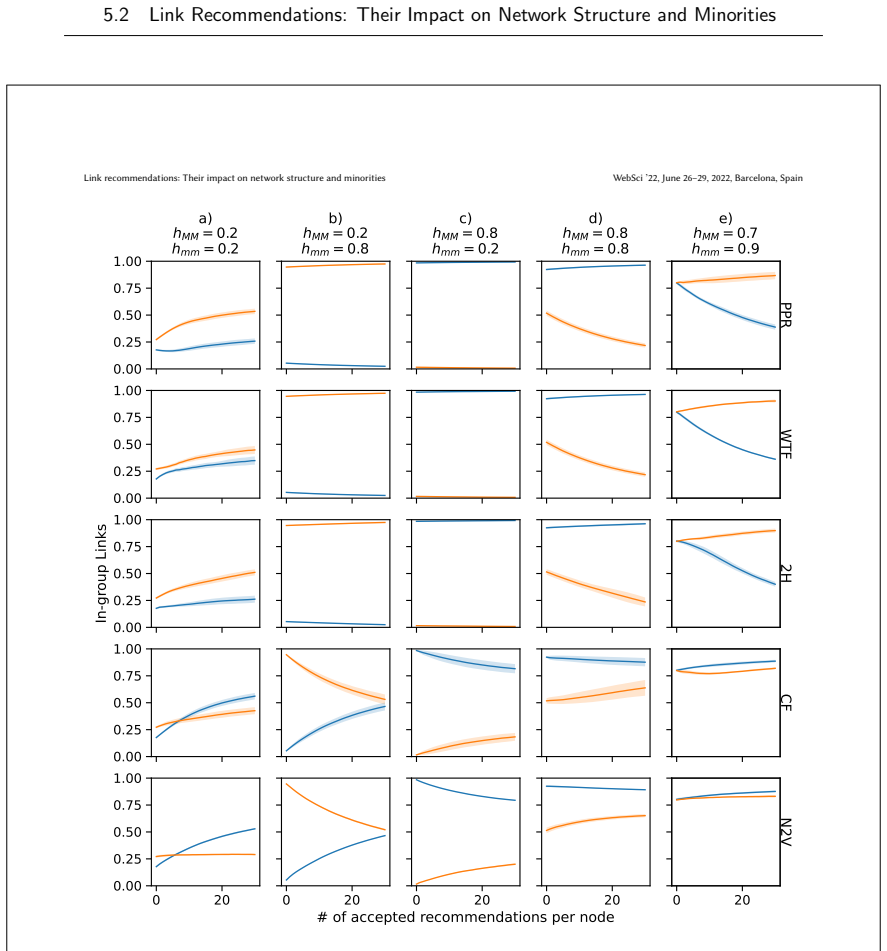
A. Ferrara, L. Esp´ ın-Noboa, F. Karimi, and C. Wagner, “Link recommen- dations: Their impact on network structure and minorities,” inProceedings of the 14th ACM Web Science Conference 2022, 2022, pp. 228–238. 245
2022
-
[13]
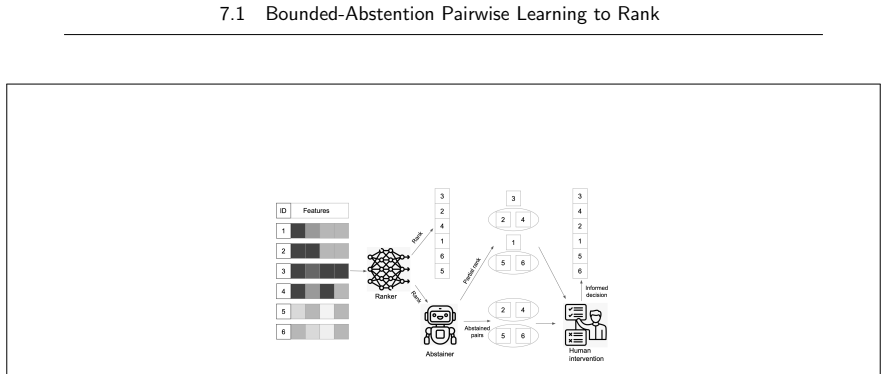
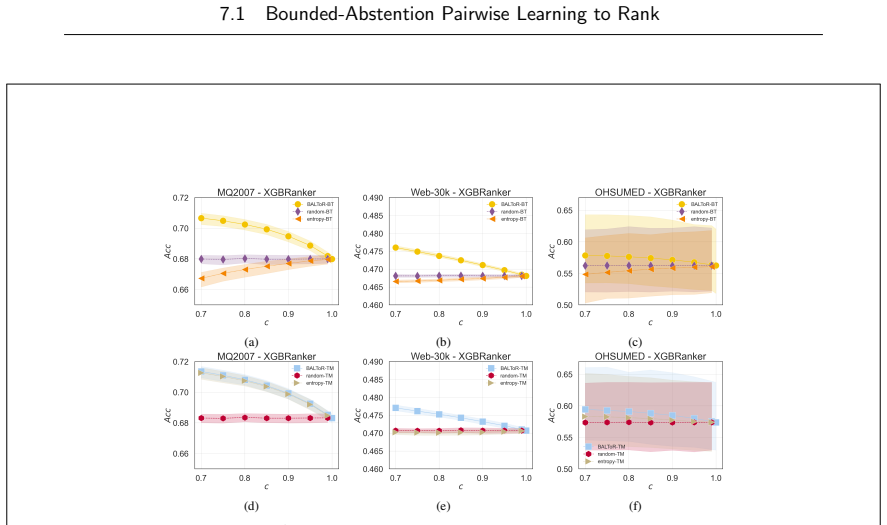
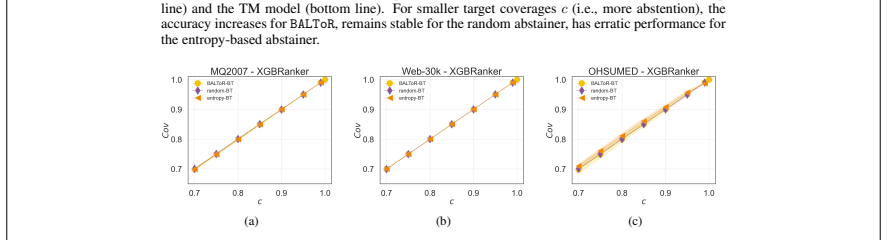
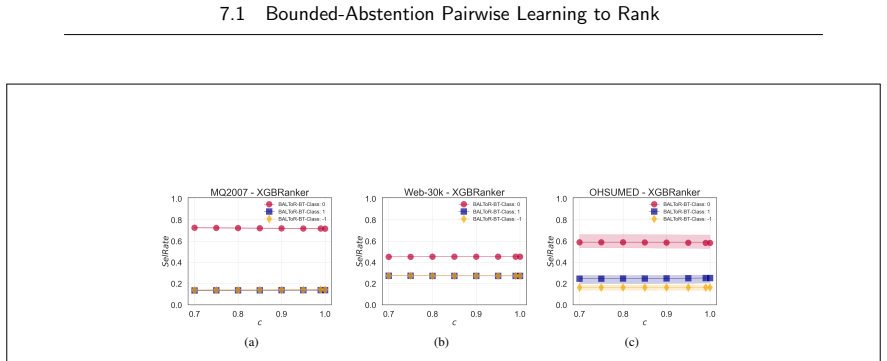
Bounded-abstention pairwise learning to rank,
A. Ferrara*, A. Pugnana*, F. Bonchi, and S. Ruggieri, “Bounded-abstention pairwise learning to rank,” inProceedings of the 32nd ACM SIGKDD Con- ference on Knowledge Discovery and Data Mining, 2026
2026
-
[14]
Policy advice and best practices on bias and fairness in ai,
J. M. Alvarez, A. B. Colmenarejo, A. Elobaid, S. Fabbrizzi, M. Fahimi, A. Ferrara, S. Ghodsi, C. Mougan, I. Papageorgiou, P. Reyero, et al., “Policy advice and best practices on bias and fairness in ai,”Ethics and Informa- tion Technology, vol. 26, no. 2, p. 31, 2024
2024
-
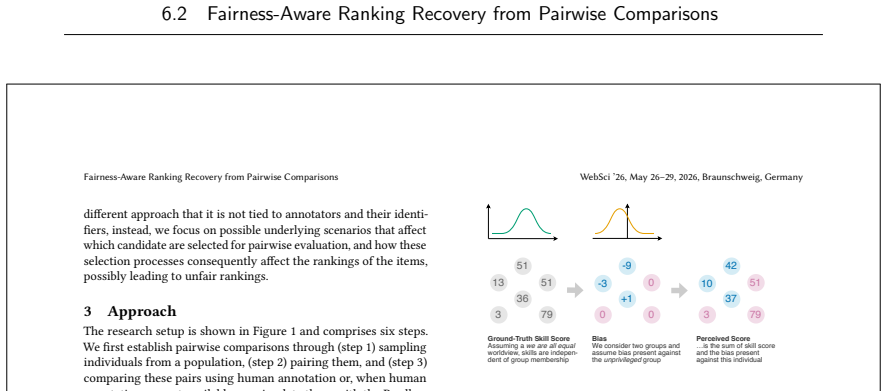
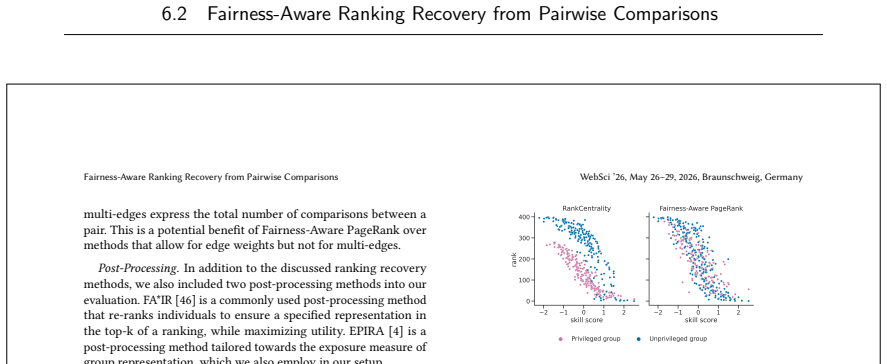
[15]
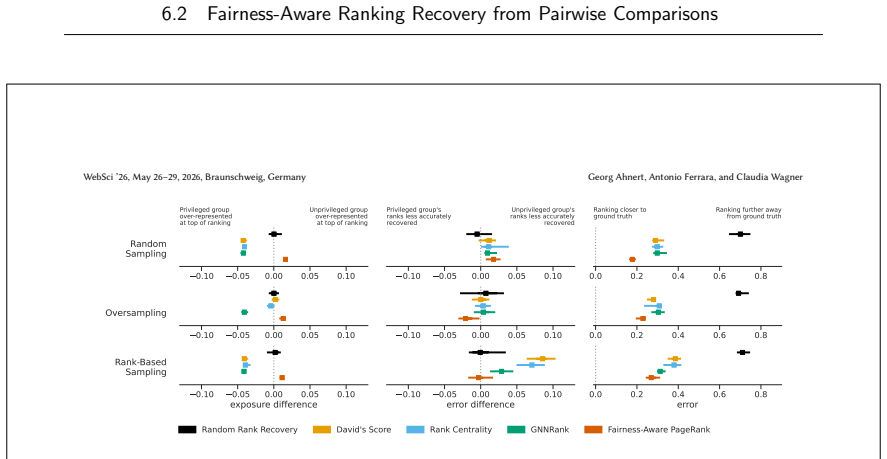
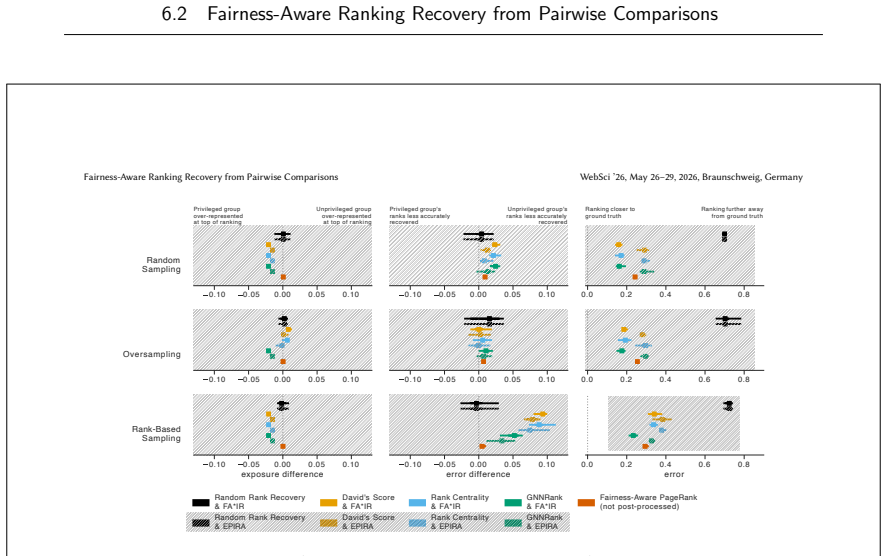
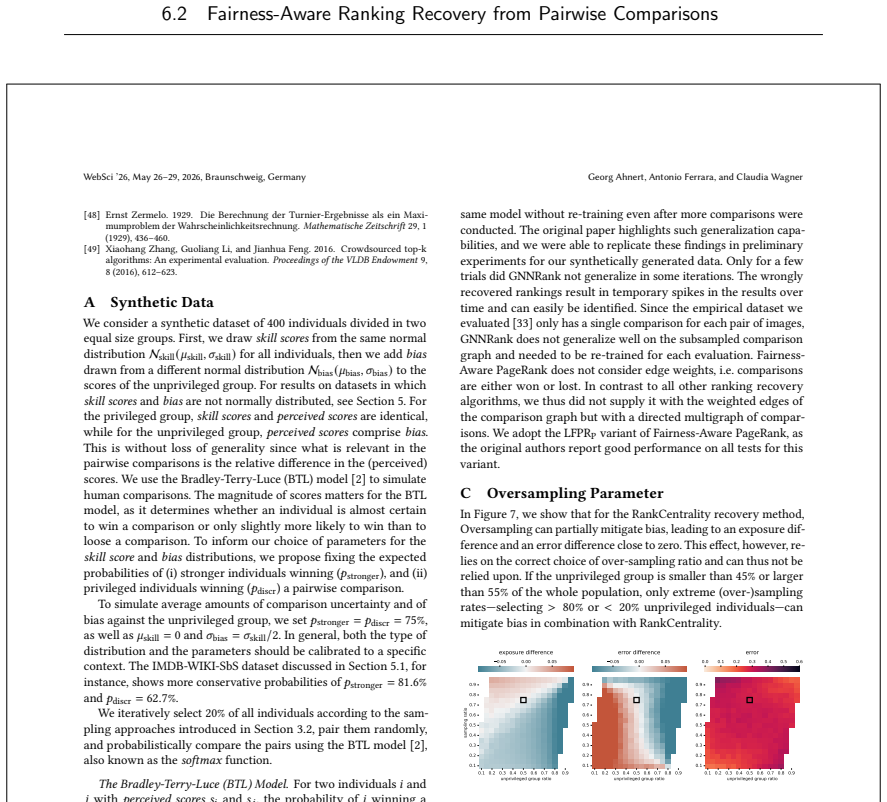
Fairness-aware ranking recovery from pairwise comparisons,
G. Ahnert, A. Ferrara, and C. Wagner, “Fairness-aware ranking recovery from pairwise comparisons,” inProceedings of the 18th ACM Web Science Conference 2026, 2026, pp. 289–298.doi:10.1145/3795766.3799744
-
[16]
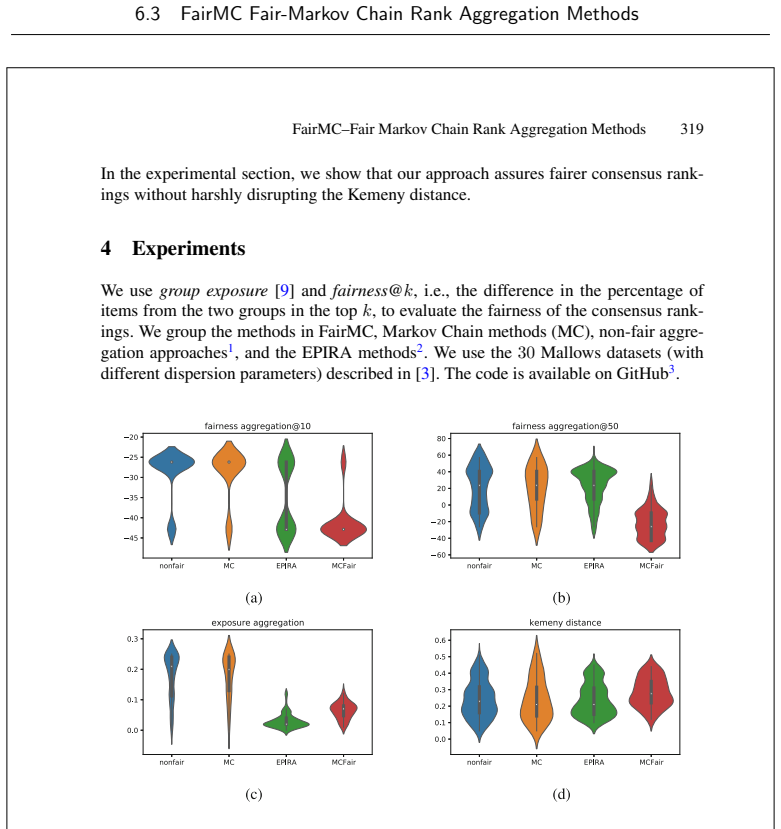
Fairmc fair–markov chain rank aggregation methods,
C. Balestra, A. Ferrara, and E. M¨ uller, “Fairmc fair–markov chain rank aggregation methods,” inInternational Conference on Big Data Analytics and Knowledge Discovery, Springer, 2024, pp. 315–321
2024
-
[17]
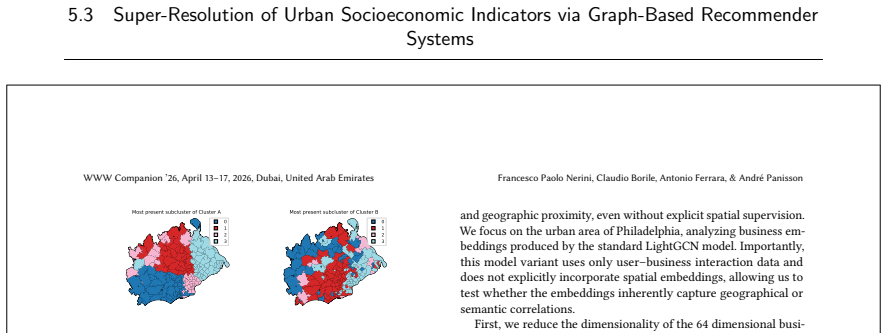
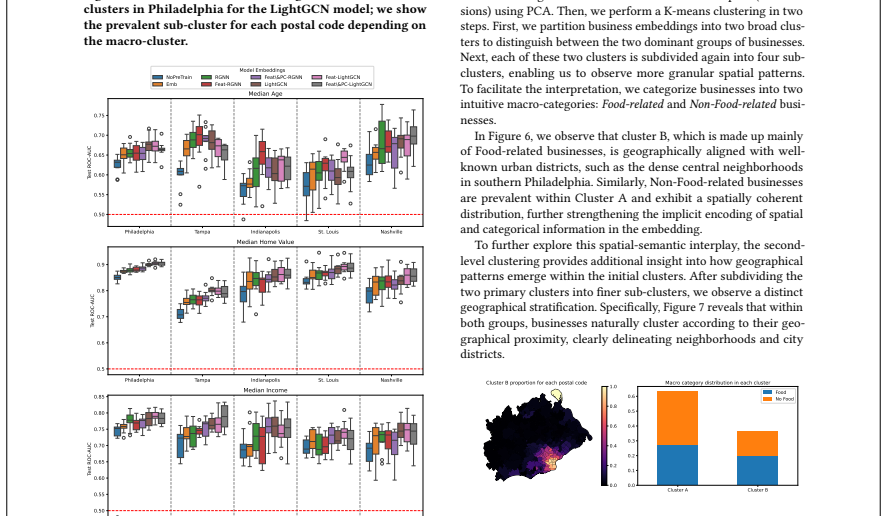
Super-resolution of urban socioeconomic indicators via graph-based recommender systems,
F. P. Nerini, C. Borile, A. Ferrara, and A. Panisson, “Super-resolution of urban socioeconomic indicators via graph-based recommender systems,” Web and the City, workshop at the WebConference, 2026
2026
-
[18]
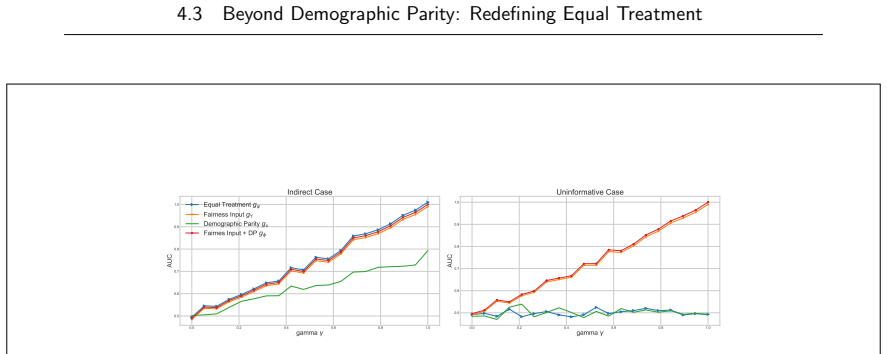
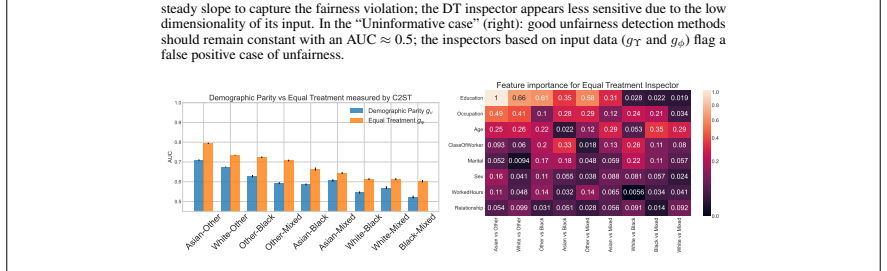
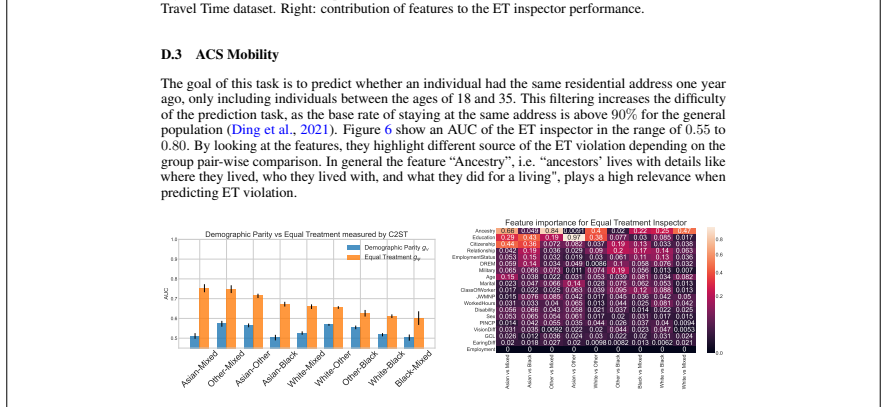
Beyond demo- graphic parity: Redefining equal treatment,
C. Mougan, L. State, A. Ferrara, S. Ruggieri, and S. Staab, “Beyond demo- graphic parity: Redefining equal treatment,”arXiv preprint arXiv:2303.08040, 2023
arXiv 2023
-
[19]
A multidisciplinary lens of bias in hate speech,
P. Reyero Lobo, J. Kwarteng, M. Russo, M. Fahimi, K. Scott, A. Fer- rara, I. Sen, and M. Fernandez, “A multidisciplinary lens of bias in hate speech,” inProceedings of the International Conference on Advances in Social Networks Analysis and Mining, 2023, pp. 121–125
2023
-
[20]
Kierkegaard,Soren Kierkegaard’s Journals and Papers, 1845-1855
S. Kierkegaard,Soren Kierkegaard’s Journals and Papers, 1845-1855. In- diana University Press, 1967, vol. 6
1967
-
[21]
C. J. Rowe, S. Broadie, et al.,Nicomachean ethics. Oxford University Press, 2002
2002
-
[22]
Maxmin-fair ranking: Individual fair- ness under group-fairness constraints,
D. Garc´ ıa-Soriano and F. Bonchi, “Maxmin-fair ranking: Individual fair- ness under group-fairness constraints,” inProceedings of the 27th ACM SIGKDD Conference on Knowledge Discovery & Data Mining, 2021, pp. 436– 446
2021
-
[23]
Fair-by-design matching,
D. Garc´ ıa-Soriano and F. Bonchi, “Fair-by-design matching,”Data Mining and Knowledge Discovery, vol. 34, no. 5, pp. 1291–1335, 2020
2020
-
[24]
A theory of justice,
J. Rawls, “A theory of justice,” inApplied ethics, Routledge, 2017, pp. 21– 29
2017
-
[25]
Fairness definitions explained,
S. Verma and J. Rubin, “Fairness definitions explained,” inProceedings of the international workshop on software fairness, 2018, pp. 1–7. 246
2018
-
[26]
Inherent trade-offs in the fair determination of risk scores,
J. Kleinberg, S. Mullainathan, and M. Raghavan, “Inherent trade-offs in the fair determination of risk scores,”arXiv preprint arXiv:1609.05807, 2016
Pith/arXiv arXiv 2016
-
[27]
Fair prediction with disparate impact: A study of bias in recidivism prediction instruments,
A. Chouldechova, “Fair prediction with disparate impact: A study of bias in recidivism prediction instruments,”Big data, vol. 5, no. 2, pp. 153–163, 2017
2017
-
[28]
Counterfactual fairness,
M. J. Kusner, J. Loftus, C. Russell, and R. Silva, “Counterfactual fairness,” Advances in neural information processing systems, vol. 30, 2017
2017
-
[29]
Causal inference in statistics: An overview,
J. Pearl, “Causal inference in statistics: An overview,”Statistics Surveys, vol. 3, pp. 96–146, 2009.doi:10 . 1214 / 09 - SS057[Online]. Available: https://projecteuclid.org/journals/statistics-surveys/volume- 3/issue-none/Causal-inference-in-statistics-An-overview/10.1 214/09-SS057.full
2009
-
[30]
Can i trust my fairness metric? assessing fairness with unlabeled data and bayesian inference,
D. Ji, P. Smyth, and M. Steyvers, “Can i trust my fairness metric? assessing fairness with unlabeled data and bayesian inference,”Advances in Neural Information Processing Systems, vol. 33, pp. 18 600–18 612, 2020
2020
-
[31]
Statistical inference for fairness auditing,
J. J. Cherian and E. J. Cand` es, “Statistical inference for fairness auditing,” Journal of machine learning research, vol. 25, no. 149, pp. 1–49, 2024
2024
-
[32]
A survey of bias in machine learning through the prism of statistical parity,
P. Besse, E. del Barrio, P. Gordaliza, J.-M. Loubes, and L. Risser, “A survey of bias in machine learning through the prism of statistical parity,” The American Statistician, vol. 76, no. 2, pp. 188–198, 2022
2022
-
[33]
Fair- learn: Assessing and improving fairness of ai systems,
H. Weerts, M. Dud´ ık, R. Edgar, A. Jalali, R. Lutz, and M. Madaio, “Fair- learn: Assessing and improving fairness of ai systems,”Journal of Machine Learning Research, vol. 24, no. 257, pp. 1–8, 2023
2023
-
[34]
A central limit theorem for lp transportation cost on the real line with application to fairness as- sessment in machine learning,
E. Del Barrio, P. Gordaliza, and J.-M. Loubes, “A central limit theorem for lp transportation cost on the real line with application to fairness as- sessment in machine learning,”Information and Inference: A Journal of the IMA, vol. 8, no. 4, pp. 817–849, 2019
2019
-
[35]
Bringing practical statistical science to ai and predictive model fairness testing,
V. S. Lo, S. Datta, and Y. Salami, “Bringing practical statistical science to ai and predictive model fairness testing,”AI and Ethics, vol. 5, no. 3, pp. 2149–2164, 2025
2025
-
[36]
Disentangling influence: Using disentangled representations to audit model predictions,
C. Marx, R. Phillips, S. Friedler, C. Scheidegger, and S. Venkatasubrama- nian, “Disentangling influence: Using disentangled representations to audit model predictions,”Advances in Neural Information Processing Systems, vol. 32, 2019. 247
2019
-
[37]
Auditing black-box models for indi- rect influence,
P. Adler, C. Falk, S. A. Friedler, T. Nix, G. Rybeck, C. Scheidegger, B. Smith, and S. Venkatasubramanian, “Auditing black-box models for indi- rect influence,”Knowledge and Information Systems, vol. 54, no. 1, pp. 95– 122, 2018
2018
-
[38]
Kernel-based condi- tional independence test and application in causal discovery,
K. Zhang, J. Peters, D. Janzing, and B. Sch¨ olkopf, “Kernel-based condi- tional independence test and application in causal discovery,” inProceed- ings of the 27th Conference on Uncertainty in Artificial Intelligence (UAI), Barcelona, Spain: AUAI Press, 2011, pp. 804–813
2011
-
[39]
Partial distance correlation with methods for dissimilarities,
G. J. Szekely and M. L. Rizzo, “Partial distance correlation with methods for dissimilarities,”Annals of Statistics, vol. 42, no. 6, pp. 2382–2412, 2014. doi:10.1214/14-AOS1255
-
[40]
Interventional fairness: Causal database repair for algorithmic fairness,
B. Salimi, L. Rodriguez, B. Howe, and D. Suciu, “Interventional fairness: Causal database repair for algorithmic fairness,” inProceedings of the 2019 international conference on management of data, 2019, pp. 793–810
2019
-
[41]
Data preprocessing techniques for classifica- tion without discrimination,
F. Kamiran and T. Calders, “Data preprocessing techniques for classifica- tion without discrimination,”Knowledge and information systems, vol. 33, no. 1, pp. 1–33, 2012
2012
-
[42]
Certifying and removing disparate impact,
M. Feldman, S. A. Friedler, J. Moeller, C. Scheidegger, and S. Venkatasub- ramanian, “Certifying and removing disparate impact,” inproceedings of the 21th ACM SIGKDD international conference on knowledge discovery and data mining, 2015, pp. 259–268
2015
-
[43]
Centrality in social networks conceptual clarification,
L. C. Freeman, “Centrality in social networks conceptual clarification,” Social networks, vol. 1, no. 3, pp. 215–239, 1978
1978
-
[44]
The pagerank citation ranking: Bringing order to the web.,
L. Page, S. Brin, R. Motwani, and T. Winograd, “The pagerank citation ranking: Bringing order to the web.,” Stanford infolab, Tech. Rep., 1999
1999
-
[45]
Network inequality through preferential attachment, triadic clo- sure, and homophily,
J. Bachmann, S. Martin-Gutierrez, L. Esp´ ın-Noboa, N. Cinardi, and F. Karimi, “Network inequality through preferential attachment, triadic clo- sure, and homophily,”Scientific Reports, 2026
2026
-
[46]
Fairsna: Algorithmic fairness in social network analysis,
A. Saxena, G. Fletcher, and M. Pechenizkiy, “Fairsna: Algorithmic fairness in social network analysis,”ACM Computing Surveys, vol. 56, no. 8, pp. 1– 45, 2024
2024
-
[47]
Fairness in graph mining: A survey,
Y. Dong, J. Ma, S. Wang, C. Chen, and J. Li, “Fairness in graph mining: A survey,”IEEE Transactions on Knowledge and Data Engineering, vol. 35, no. 10, pp. 10 583–10 602, 2023
2023
-
[48]
Minorities in networks and algorithms,
F. Karimi, M. Oliveira, and M. Strohmaier, “Minorities in networks and algorithms,” inHandbook of Computational Social Science, Edward Elgar Publishing Limited, 2025, pp. 438–451. 248
2025
-
[49]
Compositional fairness constraints for graph embeddings,
A. Bose and W. Hamilton, “Compositional fairness constraints for graph embeddings,” inInternational conference on machine learning, PMLR, 2019, pp. 715–724
2019
-
[50]
Fairwalk: Towards fair graph embedding,
T. Rahman, B. Surma, M. Backes, and Y. Zhang, “Fairwalk: Towards fair graph embedding,” 2019
2019
-
[51]
Crosswalk: Fairness-enhanced node representation learning,
A. Khajehnejad, M. Khajehnejad, M. Babaei, K. P. Gummadi, A. Weller, and B. Mirzasoleiman, “Crosswalk: Fairness-enhanced node representation learning,” inProceedings of the AAAI Conference on Artificial Intelligence, vol. 36, 2022, pp. 11 963–11 970
2022
-
[52]
Learning fair graph neural networks with limited and private sensitive attribute information,
E. Dai and S. Wang, “Learning fair graph neural networks with limited and private sensitive attribute information,”IEEE Transactions on Knowledge and Data Engineering, vol. 35, no. 7, pp. 7103–7117, 2022
2022
-
[53]
Subgroup generalization and fairness of graph neural networks,
J. Ma, J. Deng, and Q. Mei, “Subgroup generalization and fairness of graph neural networks,”Advances in Neural Information Processing Sys- tems, vol. 34, pp. 1048–1061, 2021
2021
-
[54]
Fairness-aware pagerank,
S. Tsioutsiouliklis, E. Pitoura, P. Tsaparas, I. Kleftakis, and N. Mamoulis, “Fairness-aware pagerank,” inProceedings of the Web Conference 2021, 2021, pp. 3815–3826
2021
-
[55]
Applying fairness constraints on graph node ranks under personalization bias,
E. Krasanakis, S. Papadopoulos, and I. Kompatsiaris, “Applying fairness constraints on graph node ranks under personalization bias,” inInterna- tional Conference on Complex Networks and Their Applications, Springer, 2020, pp. 610–622
2020
-
[56]
Algorithmic glass ceiling in social networks: The effects of social recommendations on network di- versity,
A.-A. Stoica, C. Riederer, and A. Chaintreau, “Algorithmic glass ceiling in social networks: The effects of social recommendations on network di- versity,” inProceedings of the 2018 World Wide Web Conference, 2018, pp. 923–932
2018
-
[57]
Implicit social cognition: Attitudes, self-esteem, and stereotypes.,
A. G. Greenwald and M. R. Banaji, “Implicit social cognition: Attitudes, self-esteem, and stereotypes.,”Psychological review, vol. 102, no. 1, p. 4, 1995
1995
-
[58]
Are emily and greg more employable than lakisha and jamal? a field experiment on labor market discrimina- tion,
M. Bertrand and S. Mullainathan, “Are emily and greg more employable than lakisha and jamal? a field experiment on labor market discrimina- tion,”American economic review, vol. 94, no. 4, pp. 991–1013, 2004
2004
-
[59]
Rank analysis of incomplete block designs: I. the method of paired comparisons,
R. A. Bradley and M. E. Terry, “Rank analysis of incomplete block designs: I. the method of paired comparisons,”Biometrika, vol. 39, no. 3/4, pp. 324– 345, 1952
1952
-
[60]
R. D. Luce,Individual choice behavior: A theoretical analysis. New York: John Wiley and Sons, 1959. 249
1959
-
[61]
Achieving budget-optimality with adaptive schemes in crowdsourcing,
A. Khetan and S. Oh, “Achieving budget-optimality with adaptive schemes in crowdsourcing,” inAdvances in Neural Information Processing Systems, vol. 29, 2016
2016
-
[62]
A permutation- based model for crowd labeling: Optimal estimation and robustness,
N. B. Shah, S. Balakrishnan, and M. J. Wainwright, “A permutation- based model for crowd labeling: Optimal estimation and robustness,”arXiv preprint arXiv:1606.09632, 2016
arXiv 2016
-
[63]
Estimation from pairwise comparisons: Sharp min- imax bounds with topology dependence,
N. B. Shah, S. Balakrishnan, J. Bradley, A. Parekh, K. Ramchandran, and M. J. Wainwright, “Estimation from pairwise comparisons: Sharp min- imax bounds with topology dependence,”Journal of Machine Learning Research, vol. 17, no. 58, pp. 1–47, 2016
2016
-
[64]
FA*IR: A fair top-k ranking algorithm,
M. Zehlike, F. Bonchi, C. Castillo, S. Hajian, M. Megahed, and R. Baeza- Yates, “FA*IR: A fair top-k ranking algorithm,” inProceedings of the 26th ACM on International Conference on Information and Knowledge Man- agement, 2017, pp. 1569–1578
2017
-
[65]
Fairness of exposure in rankings,
A. Singh and T. Joachims, “Fairness of exposure in rankings,” inProceed- ings of the 24th ACM SIGKDD International Conference on Knowledge Discovery & Data Mining, 2018, pp. 2219–2228
2018
-
[66]
Equity of attention: Amor- tizing individual fairness in rankings,
A. J. Biega, K. P. Gummadi, and G. Weikum, “Equity of attention: Amor- tizing individual fairness in rankings,” inThe 41st International ACM SIGIR Conference on Research & Development in Information Retrieval, 2018, pp. 405–414
2018
-
[67]
M´ emoire sur les ´ elections au scrutin,
J.-C. de Borda, “M´ emoire sur les ´ elections au scrutin,”Histoire de l’Acad´ emie Royale des Sciences, vol. 1, pp. 657–665, 1781
-
[68]
Rank aggregation methods for the web,
C. Dwork, R. Kumar, M. Naor, and D. Sivakumar, “Rank aggregation methods for the web,” inProceedings of the 10th International Conference on World Wide Web, ACM, 2001, pp. 613–622
2001
-
[69]
Schopenhauer,Parerga and paralipomena: Short philosophical essays
A. Schopenhauer,Parerga and paralipomena: Short philosophical essays. Oxford University Press, 2000, vol. 1
2000
-
[70]
Scaling personalized web search,
G. Jeh and J. Widom, “Scaling personalized web search,” inProceedings of the 12th international conference on World Wide Web, 2003, pp. 271–279
2003
-
[71]
Wtf: The who to follow service at twitter,
P. Gupta, A. Goel, J. Lin, A. Sharma, D. Wang, and R. Zadeh, “Wtf: The who to follow service at twitter,” inProceedings of the 22nd international conference on World Wide Web, ACM, 2013, pp. 505–514
2013
-
[72]
Node2vec: Scalable feature learning for net- works,
A. Grover and J. Leskovec, “Node2vec: Scalable feature learning for net- works,” inProceedings of the 22nd ACM SIGKDD international conference on Knowledge discovery and data mining, 2016, pp. 855–864. 250
2016
-
[73]
GP Putnam’s Sons, 1919
Voltaire,Voltaire in His Letters: Being a Selection from His Correspon- dence. GP Putnam’s Sons, 1919
1919
-
[74]
My first summer in the sierra,
J. Muir, “My first summer in the sierra,” inBritish Politics and the Envi- ronment in the Long Nineteenth Century, Routledge, 2023, pp. 291–296
2023
-
[75]
The archetypes of the collective uncon- scious,
C. G. Jung and R. F. C. Hull, “The archetypes of the collective uncon- scious,” inCollected works of CG Jung, Routledge, 2023, v7 90–v7 113
2023
-
[76]
de Saint-Exup´ ery,The Little Prince
A. de Saint-Exup´ ery,The Little Prince. Reynal & Hitchcock, 1943
1943
-
[77]
O. E. Butler,Parable of the Sower. Four Walls Eight Windows, 1993
1993
-
[78]
Deep reinforcement learning from human preferences,
P. F. Christiano, J. Leike, T. Brown, M. Martic, S. Legg, and D. Amodei, “Deep reinforcement learning from human preferences,”Advances in neural information processing systems, vol. 30, 2017
2017
-
[79]
The rise and potential of large language model based agents: A survey,
Z. Xi, W. Chen, X. Guo, W. He, Y. Ding, B. Hong, M. Zhang, J. Wang, S. Jin, E. Zhou, et al., “The rise and potential of large language model based agents: A survey,”Science China Information Sciences, vol. 68, no. 2, p. 121 101, 2025. 251
2025
discussion (0)
Sign in with ORCID, Apple, or X to comment. Anyone can read and Pith papers without signing in.