Explainable Outlier Detection for Interval-valued Data
Pith reviewed 2026-06-26 01:23 UTC · model grok-4.3
The pith
A closed-form Shapley value decomposes the squared robust Interval-Mahalanobis distance into per-variable center, range, and cross-term contributions.
A machine-rendered reading of the paper's core claim, the machinery that carries it, and where it could break.
Core claim
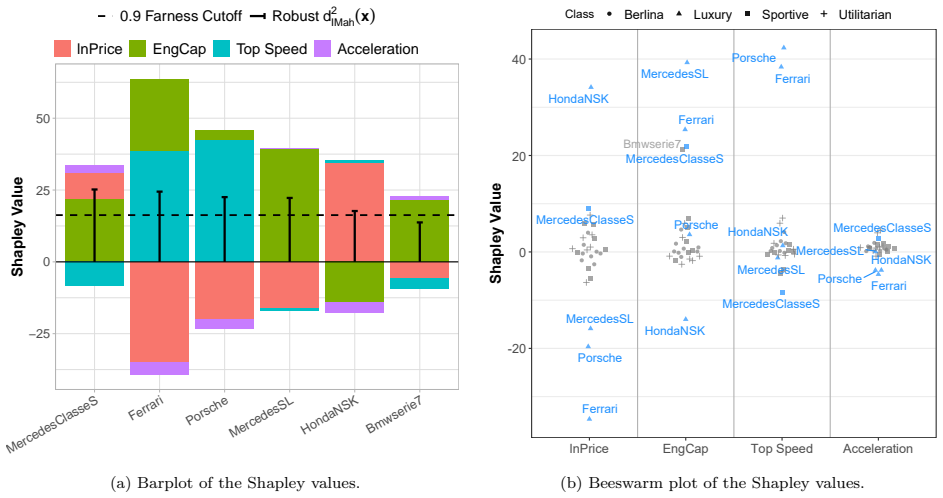
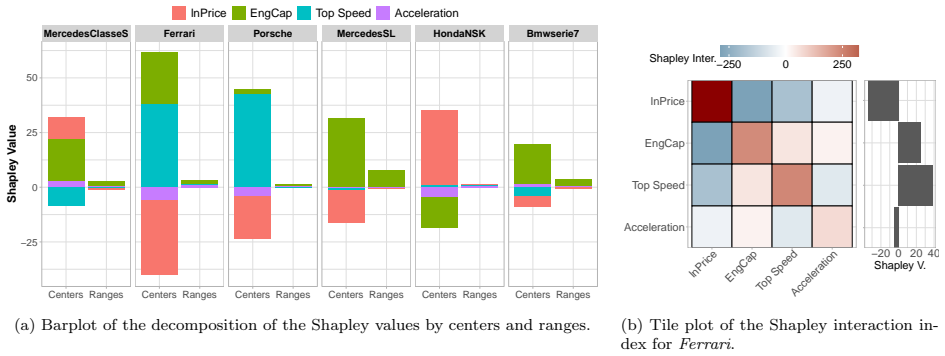
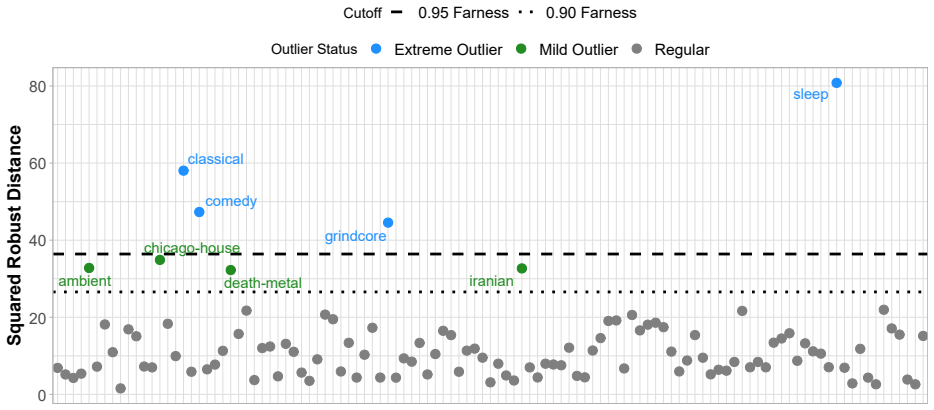
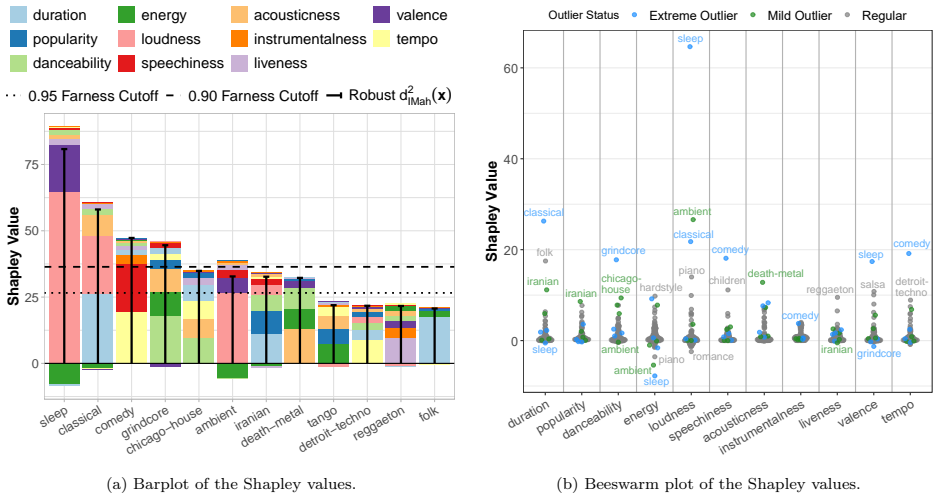
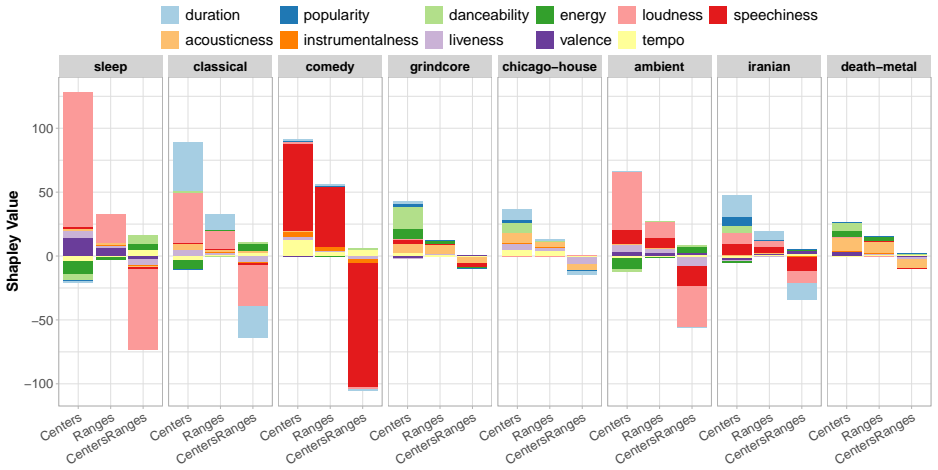
Building on an outlier detection framework based on the Interval Minimum Covariance Determinant estimator, we propose a novel approach to explain the outlyingness of interval-valued observations using the concept of the Shapley value. We derive a closed-form expression for the Shapley value of the squared robust Interval-Mahalanobis distance, enabling efficient computation of variable contributions. This formulation allows for a fine-grained interpretation of outliers, providing a detailed decomposition into contributions from centers, ranges, and cross-terms of the interval-valued observations. Moreover, the Shapley value is closely connected to the concept of cellwise outliers, as it can h
What carries the argument
Closed-form Shapley value of the squared robust Interval-Mahalanobis distance, which decomposes outlyingness into additive contributions from each variable's center and range plus cross-terms.
If this is right
- Variable contributions to any observation's outlyingness can be obtained in closed form rather than by sampling.
- Outlier scores decompose explicitly into center contributions, range contributions, and cross-terms for each variable.
- Variable-specific (cellwise) outliers become visible even when the overall multivariate score flags the observation.
- Pairwise interactions among variables that drive atypical behavior can be quantified with the Shapley interaction index.
Where Pith is reading between the lines
- The same derivation strategy might adapt to other robust distances once their squared form is available.
- In sensor or measurement applications, the center-versus-range split could indicate whether an anomaly stems from location shift or increased uncertainty.
- Synthetic interval data with known cellwise contamination could be used to check whether high Shapley contributions correctly flag the injected cells.
Load-bearing premise
The Interval Minimum Covariance Determinant estimator supplies a reliable robust location and scatter matrix for interval-valued observations.
What would settle it
Direct numerical enumeration of all coalitions on a small interval dataset produces Shapley values that differ from those given by the closed-form expression.
Figures

read the original abstract
Explainability is increasingly recognized as a key aspect of outlier detection. However, for complex data structures such as interval-valued data, it remains largely unexplored. Building on an outlier detection framework based on the Interval Minimum Covariance Determinant estimator, we propose a novel approach to explain the outlyingness of interval-valued observations using the concept of the Shapley value. We derive a closed-form expression for the Shapley value of the squared robust Interval-Mahalanobis distance, enabling efficient computation of variable contributions. This formulation allows for a fine-grained interpretation of outliers, providing a detailed decomposition into contributions from centers, ranges, and cross-terms of the interval-valued observations. Moreover, the Shapley value is closely connected to the concept of cellwise outliers, as it can help identify variable-specific outliers that may not be evident at multivariate level. We further extend the framework through the Shapley interaction index to capture pairwise variable interactions driving atypical behavior. The practical utility of the proposed approach is illustrated through two real-world datasets.
Editorial analysis
A structured set of objections, weighed in public.
Referee Report
Summary. The paper claims to derive a closed-form expression for the Shapley value of the squared robust Interval-Mahalanobis distance based on the Interval Minimum Covariance Determinant estimator. This enables efficient computation of variable contributions to outlyingness in interval-valued data, with decomposition into centers, ranges, and cross-terms, plus an extension to the Shapley interaction index for pairwise effects; utility is shown on two real-world datasets.
Significance. If the closed-form holds and the underlying estimator is reliable, the work would provide a useful advance in interpretability for outlier detection on interval data, linking Shapley values to cellwise outliers in a setting where such explanations are currently scarce.
major comments (2)
- [Abstract] Abstract: the claim of a closed-form derivation for the Shapley value is asserted without any equations, proof sketch, or verification steps supplied, preventing assessment of whether the math supports the stated result.
- [Interval MCD estimator description] The full Shapley derivation is constructed on top of the Interval MCD estimator (location and scatter), yet no simulation study, theoretical guarantee, or controlled contamination experiment is referenced to confirm that the estimator recovers true parameters for interval-valued observations.
minor comments (1)
- The asserted connection between the Shapley value and cellwise outliers is stated but not accompanied by a formal proposition or illustrative calculation showing how variable-specific contributions identify outliers invisible at the multivariate level.
Simulated Author's Rebuttal
We thank the referee for the detailed review and constructive comments on our manuscript. We address each major comment below, proposing revisions where they strengthen the presentation without altering the core contribution.
read point-by-point responses
-
Referee: [Abstract] Abstract: the claim of a closed-form derivation for the Shapley value is asserted without any equations, proof sketch, or verification steps supplied, preventing assessment of whether the math supports the stated result.
Authors: We agree that the abstract is intentionally concise and omits mathematical details to remain accessible. The closed-form Shapley value derivation, including the explicit expression for the squared robust Interval-Mahalanobis distance and its decomposition, is fully developed in Section 3 with supporting theorems. To address the concern, we will revise the abstract to briefly indicate that a closed-form expression is derived, enabling the decomposition into center, range, and cross-term contributions. revision: yes
-
Referee: [Interval MCD estimator description] The full Shapley derivation is constructed on top of the Interval MCD estimator (location and scatter), yet no simulation study, theoretical guarantee, or controlled contamination experiment is referenced to confirm that the estimator recovers true parameters for interval-valued observations.
Authors: The Interval MCD estimator is the robust base for computing the Interval-Mahalanobis distance, with its formulation and properties drawn from established interval data literature. Our focus is the novel Shapley-value layer for explainability. We will revise the manuscript to add explicit references to prior validation studies of the Interval MCD and a concise discussion of its breakdown properties. A dedicated new simulation study for the estimator falls outside the scope of this work, which centers on the explainability extension rather than re-validating the detector. revision: partial
Circularity Check
No circularity: closed-form Shapley derivation is independent of estimator fitting
full rationale
The paper's core claim is a mathematical derivation of a closed-form Shapley value for the squared robust Interval-Mahalanobis distance, using the output of the Interval MCD estimator as fixed input. No quoted step shows the Shapley expression reducing by construction to a fitted parameter, a self-definition, or a self-citation chain. The estimator supplies μ and Σ; the Shapley formula is then derived from the quadratic form. This matches the default expectation of a self-contained derivation (score 0-2). No patterns from the enumerated list are exhibited.
Axiom & Free-Parameter Ledger
axioms (1)
- domain assumption The Interval Minimum Covariance Determinant estimator provides a reliable robust estimate of location and scatter for interval-valued data.
Reference graph
Works this paper leans on
-
[1]
Explainable Artificial Intelligence (XAI): Concepts, taxonomies, opportunities and challenges toward responsible AI. Information Fusion 58, 82–115. doi:10.1016/j.inffus.2019.12.012. Billard, L., Diday, E.,
-
[2]
Symbolic Data Analysis: Conceptual Statistics and Data Mining. John Wiley & Sons. doi:10.1002/9780470090183. Brito, P.,
-
[3]
WIREs Data Mining and Knowledge Discovery 4, 281–295
Symbolic Data Analysis: another look at the interaction of Data Mining and Statistics. WIREs Data Mining and Knowledge Discovery 4, 281–295. doi:10.1002/widm.1133. Couso, I., Dubois, D.,
-
[4]
Statistical reasoning with set-valued information: Ontic vs. epistemic views. International Journal of Approximate Reasoning 55, 1502–1518. doi:10.1016/j.ijar. 2013.07.002. De Souza, R.M.C.R., De Carvalho, F.A.T.,
-
[5]
Pattern Recognition Letters 25, 353–365
Clustering of interval data based on city-block distances. Pattern Recognition Letters 25, 353–365. doi:10.1016/j.patrec.2003.10.016. De S´ a, J.N.A., Ferreira, M.R.P., De Carvalho, F.A.,
-
[6]
Kernel clustering with automatic variable weighting for interval data. Neurocomputing 650, 130849. doi:10.1016/j.neucom.2025.130849. Dias, S., Brito, P.,
-
[7]
European Journal of Operational Research 258, 1118–1130
Off the beaten track: A new linear model for interval data. European Journal of Operational Research 258, 1118–1130. doi:10.1016/j.ejor.2016.09.006. Diday, E.,
-
[8]
Pro- ceedings of IFCS, Classification and Related Methods of Data Analysis, 1987 , 673–684
The symbolic approach in clustering and related methods of data analysis. Pro- ceedings of IFCS, Classification and Related Methods of Data Analysis, 1987 , 673–684. 17 Duarte Silva, P., Brito, P.,
1987
-
[9]
Advances in Data Analysis and Classification 12, 785–822
Outlier detection in interval data. Advances in Data Analysis and Classification 12, 785–822. doi:10.1007/s11634-017-0305-y. Fagundes, R.A., De Souza, R.M.C.R., Cysneiros, F.J.A.,
-
[10]
Engineering Applications of Artificial Intelligence 26, 564–573
Robust regression with applica- tion to symbolic interval data. Engineering Applications of Artificial Intelligence 26, 564–573. doi:https://doi.org/10.1016/j.engappai.2012.05.004. Fujimoto, K., Kojadinovic, I., Marichal, J.L.,
-
[11]
Games and Economic Behavior 55, 72–99
Axiomatic characterizations of probabilistic and cardinal-probabilistic interaction indices. Games and Economic Behavior 55, 72–99. doi:10. 1016/j.geb.2005.03.002. Gir˜ ao Serr˜ ao, R., Oliveira, M.R., Oliveira, L.,
2005
-
[12]
Information Sciences 621, 227–247
Theoretical derivation of interval principal component analysis. Information Sciences 621, 227–247. doi:10.1016/j.ins.2022.11.093. Grabisch, M., Roubens, M.,
-
[13]
doi:10.1007/s42519-025-00450-6. Irpino, A., Verde, R.,
-
[14]
(Eds.), Data Science and Classification, Springer Berlin Heidelberg, Berlin, Heidelberg
A New Wasserstein Based Distance for the Hierarchical Clustering of Histogram Symbolic Data, in: Batagelj, V., Bock, H.H., Ferligoj, A., ˇZiberna, A. (Eds.), Data Science and Classification, Springer Berlin Heidelberg, Berlin, Heidelberg. pp. 185–192. doi:10.1007/3-540-34416-0_20. Irpino, A., Verde, R., 2015a. Basic statistics for distributional symbolic ...
-
[15]
Le-Rademacher, J., Billard, L.,
doi:10.1007/s11634-015-0197-7. Le-Rademacher, J., Billard, L.,
-
[16]
Symbolic Covariance Principal Component Analysis and Visualization for Interval-Valued Data. Journal of Computational and Graphical Statistics 21, 413–432. doi:10.1080/10618600.2012.679895. Li, S., Lee, R., Lang, S.D.,
-
[17]
Detecting outliers in interval data, in: Proceedings of the 44th Annual ACM Southeast Conference, Association for Computing Machinery, New York, NY, USA. pp. 290–295. doi:10.1145/1185448.1185514. Li, Z., Zhu, Y., Van Leeuwen, M.,
-
[18]
doi:10.1145/3609333. Longo, L., Brcic, M., Cabitza, F., Choi, J., Confalonieri, R., Ser, J.D., Guidotti, R., Hayashi, Y., Herrera, F., Holzinger, A., Jiang, R., Khosravi, H., Lecue, F., Malgieri, G., P´ aez, A., Samek, W., Schneider, J., Speith, T., Stumpf, S.,
-
[19]
Information Fusion 106, 102301
Explainable Artificial Intelligence (XAI) 2.0: A 18 manifesto of open challenges and interdisciplinary research directions. Information Fusion 106, 102301. doi:https://doi.org/10.1016/j.inffus.2024.102301. Loureiro, C.P., Oliveira, M.R., Brito, P., Oliveira, L.,
-
[20]
Lundberg, S.M., Erion, G.G., Lee, S.I.,
Minimum Covariance Determinant Estimator and Outlier Detection for Interval-valued Data.arXiv:2604.26769. Lundberg, S.M., Erion, G.G., Lee, S.I.,
-
[21]
Consistent Individualized Feature Attribution for Tree Ensembles.arXiv:1802.03888. Lundberg, S.M., Lee, S.I.,
-
[22]
A unified approach to interpreting model predictions, in: Pro- ceedings of the 31st International Conference on Neural Information Processing Systems, Curran Associates Inc., Red Hook, NY, USA. pp. 4768–4777. doi:10.48550/arXiv.1705.07874. Mallows, C.L.,
work page internal anchor Pith review Pith/arXiv arXiv doi:10.48550/arxiv.1705.07874
-
[23]
doi:10.1214/aoms/1177692631. Mayrhofer, M., Filzmoser, P.,
-
[24]
Econometrics and Statistics doi:10.1016/j.ecosta.2023.04.003
Multivariate outlier explanations using Shapley values and Mahalanobis distances. Econometrics and Statistics doi:10.1016/j.ecosta.2023.04.003. Nagler, T., Vatter, T.,
-
[25]
kde1d: Univariate Kernel Density Estimation. doi:10.32614/CRAN. package.kde1d. R package version 1.1.1. Oliveira, M.R., Azeitona, M., Pacheco, A., Valadas, R.,
-
[26]
Location and association measures for interval data based on Mallows’ distance.arXiv:2407.05105. Pandya, M.,
-
[27]
doi:10.34740/KAGGLE/DSV/4372070
Spotify Tracks Dataset. doi:10.34740/KAGGLE/DSV/4372070. Kaggle. Raymaekers, J., Rousseeuw, P.J.,
-
[28]
Machine Learning 113, 4953–4975
Transforming variables to central normality. Machine Learning 113, 4953–4975. doi:10.1007/s10994-021-05960-5. Raymaekers, J., Rousseeuw, P.J., Hubert, M.,
-
[29]
Class Maps for Visualizing Classification Results. Technometrics 64, 151–165. doi:10.1080/00401706.2021.1927849. Rousseeuw, P.J.,
-
[30]
Journal of the American Statistical Association 79, 871–880
Least Median of Squares Regression. Journal of the American Statistical Association 79, 871–880. doi:10.2307/2288718. Rousseeuw, P.J.,
-
[31]
Mathematical Statis- tics and Applications B, 283–297
Multivariate Estimation With High Breakdown Point. Mathematical Statis- tics and Applications B, 283–297. doi:10.1007/978-94-009-5438-0_20. Rousseeuw, P.J., van Driessen, K.,
-
[32]
A Fast Algorithm for the Minimum Covariance Determi- nant Estimator. Technometrics 41, 212–223. doi:10.2307/1270566. Shapley, L.S.,
-
[33]
(Eds.), Contributions to the Theory of Games, Volume II
A Value for n-Person Games, in: Kuhn, H.W., Tucker, A.W. (Eds.), Contributions to the Theory of Games, Volume II. Princeton University Press, Princeton, pp. 307–318. doi:10.1515/9781400881970-018. 19 Tian, W., Qin, Z.,
-
[34]
doi:10.1007/s11222-024-10386-9. Viattchenin, D.,
-
[35]
A new family of power transformations to improve normality or symmetry. Biometrika 87, 954–959. doi:10.1093/biomet/87.4.954. Young, H.P.,
-
[36]
International Journal of Game Theory 14, 65–72
Monotonic solutions of cooperative games. International Journal of Game Theory 14, 65–72. doi:10.1007/BF01769885. Zhao, Q., Wang, H., Wang, S.,
discussion (0)
Sign in with ORCID, Apple, or X to comment. Anyone can read and Pith papers without signing in.