Hallucination in World Models is Predictable and Preventable
Pith reviewed 2026-06-26 04:56 UTC · model grok-4.3
The pith
Hallucination in world models arises from low data coverage in state-action space and the same lightweight signals can both detect and fix it.
A machine-rendered reading of the paper's core claim, the machinery that carries it, and where it could break.
Core claim
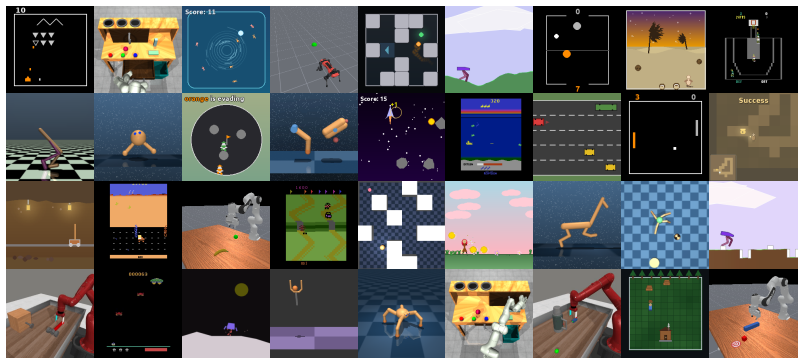
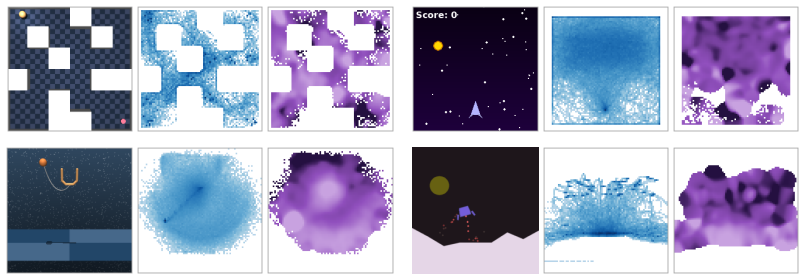
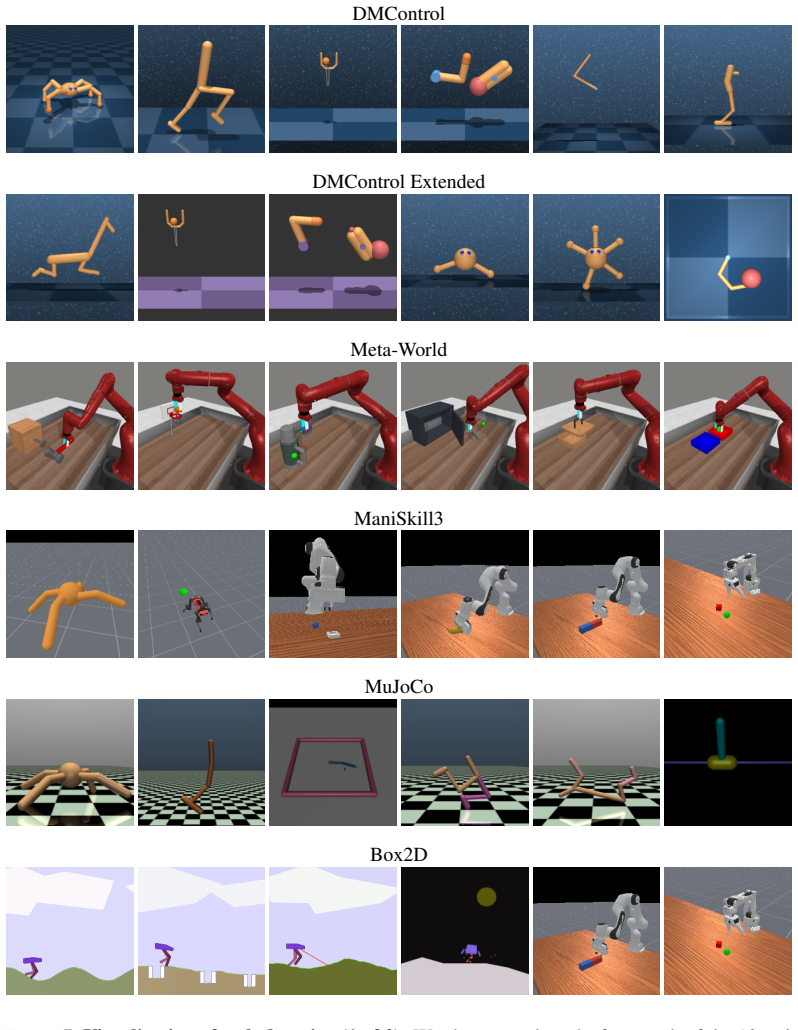
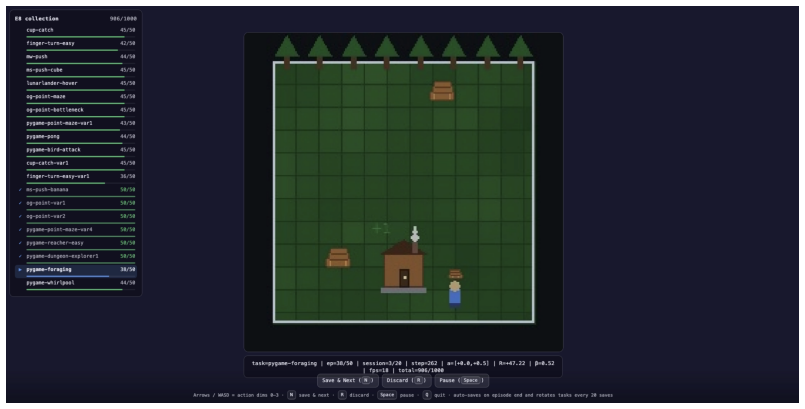
Hallucination concentrates in low-coverage regions of the state-action space. On the new 427-hour MMBench2 dataset the authors identify three modes—perceptual, action-marginalized, and scene-diverging—each anchored to a pipeline stage. Three lightweight data-centric signals accurately predict where rollouts will diverge from ground-truth dynamics. Coverage-aware sampling closes gaps at training time; the same signals used as curiosity rewards close gaps online, enabling data-efficient adaptation to unseen environments with as few as 50 trajectories. The findings establish that hallucination is inherently a coverage issue and that detection signals double as mitigation tools.
What carries the argument
Coverage-based hallucination predictors that both flag low-coverage regions and supply curiosity rewards for targeted data collection.
If this is right
- Hallucination rates drop when training data is actively balanced toward low-coverage regions.
- The same predictors enable reliable finetuning to new environments with only tens of real trajectories.
- Three separate hallucination modes can be isolated and addressed at their respective pipeline stages.
- Detection and mitigation become two uses of one set of coverage signals.
Where Pith is reading between the lines
- The approach may extend to other autoregressive generative models whose errors also cluster in under-represented input regions.
- Systematic coverage measurement could become a standard diagnostic for any learned dynamics model used in planning or control.
- The MMBench2 benchmark supplies a concrete testbed for comparing coverage-aware methods against purely architectural fixes.
Load-bearing premise
That the observed hallucinations are caused primarily by insufficient coverage rather than by model capacity, optimization choices, or other factors.
What would settle it
A controlled test in which the proposed signals fail to predict actual rollout errors on held-out simulator trajectories, or in which hallucinations occur at comparable rates inside and outside the identified low-coverage regions.
Figures


read the original abstract
Modern generative world models render increasingly realistic action-controllable futures, yet they frequently hallucinate: rollouts remain visually fluent while drifting from the ground-truth dynamics. We hypothesize that hallucination concentrates in low-coverage regions of the state-action space, where lightweight data-centric signals can both detect it and guide mitigation. To test this, we introduce MMBench2, a 427-hour, 210-task dataset for visual world modeling with ground-truth actions, rewards, and live simulators, and train a 350M-parameter world model on it. We identify three distinct hallucination modes: perceptual, action-marginalized, and scene-diverging -- each anchored to a different stage of the pipeline, and develop three signals that accurately predict where the model will fail. To close coverage gaps at training time, we develop a coverage-aware sampling technique; to close them online, our hallucination predictors serve as curiosity rewards for targeted data collection, yielding a data-efficient finetuning recipe that adapts the pretrained world model to entirely unseen environments with as few as 50 real environment trajectories. Overall, our findings reveal that hallucination in world models is inherently a data coverage issue, and that the same signals used to detect it can also be used for mitigation. An interactive web version of our paper is available at https://www.nicklashansen.com/mmbench2
Editorial analysis
A structured set of objections, weighed in public.
Referee Report
Summary. The paper claims that hallucination in generative world models concentrates in low-coverage regions of state-action space and can be both detected and mitigated using lightweight data-centric signals. It introduces the MMBench2 dataset (427 hours, 210 tasks with ground-truth actions/rewards/simulators), trains a 350M-parameter world model, identifies three hallucination modes (perceptual, action-marginalized, scene-diverging) tied to pipeline stages, develops three corresponding predictors, proposes coverage-aware sampling at training time, and uses the predictors as curiosity rewards for online data collection, enabling adaptation to unseen environments with as few as 50 trajectories. The central conclusion is that hallucination is inherently a data coverage issue and that the same signals serve for both detection and mitigation.
Significance. If the empirical claims hold, the work supplies a concrete, data-centric recipe for improving reliability of visual world models, which is relevant to model-based RL and robotics. Strengths include the scale of the new MMBench2 dataset, the explicit linkage of hallucination modes to pipeline stages, the dual use of predictors for detection and as rewards, and the reported data efficiency of the 50-trajectory adaptation result. These elements provide testable, practical contributions beyond purely architectural fixes.
minor comments (2)
- [Abstract] Abstract: the claims that signals 'accurately predict where the model will fail' and that mitigation succeeds 'with as few as 50 real environment trajectories' are stated without any accompanying metrics, baselines, or statistical details; a one-sentence summary of the key quantitative results should be added for immediate clarity.
- [Methods / Signal definitions] The three hallucination modes and their associated signals are described at a high level; explicit pseudocode or equations showing how each signal is computed from coverage statistics (without reference to model outputs) would improve reproducibility.
Simulated Author's Rebuttal
We thank the referee for their positive assessment of the manuscript, accurate summary of our contributions, and recommendation for minor revision. The highlighted strengths align with our intended focus on data-centric signals for hallucination detection and mitigation.
Circularity Check
No significant circularity; empirical validation on new dataset
full rationale
The paper's core argument is an empirical hypothesis tested via construction of MMBench2 (427-hour dataset with ground-truth), training a 350M world model, identification of three hallucination modes tied to pipeline stages, development of three predictive signals, coverage-aware sampling, and 50-trajectory curiosity-driven finetuning. All load-bearing claims (hallucination concentration in low-coverage regions, signals for detection/mitigation) are directly measured against live simulators and held-out environments rather than derived by definition, fitted parameters renamed as predictions, or self-citation chains. No equations, uniqueness theorems, or ansatzes reduce results to inputs by construction. The work is self-contained against external benchmarks (new dataset, quantitative adaptation results).
Axiom & Free-Parameter Ledger
axioms (1)
- domain assumption Hallucination concentrates in low-coverage regions of the state-action space
Reference graph
Works this paper leans on
-
[1]
Lillicrap, Jimmy Ba, and Mohammad Norouzi
Danijar Hafner, Timothy P. Lillicrap, Jimmy Ba, and Mohammad Norouzi. Dream to control: Learning behav- iors by latent imagination.ArXiv, abs/1912.01603,
Pith/arXiv arXiv 1912
-
[2]
Mastering diverse domains through world models.arXiv preprint arXiv:2301.04104,
Danijar Hafner, Jurgis Pasukonis, Jimmy Ba, and Timothy Lillicrap. Mastering diverse domains through world models.arXiv preprint arXiv:2301.04104,
-
[3]
Training agents inside of scalable world models.arXiv preprint arXiv:2509.24527,
Danijar Hafner, Wilson Yan, and Timothy Lillicrap. Training agents inside of scalable world models.arXiv preprint arXiv:2509.24527,
-
[4]
Query-key normalization for transformers
Alex Henry, Prudhvi Raj Dachapally, Shubham Shantaram Pawar, and Yuxuan Chen. Query-key normalization for transformers. InFindings of the Association for Computational Linguistics: EMNLP 2020, pages 4246– 4253,
2020
-
[5]
Training compute-optimal large language models.arXiv preprint arXiv:2203.15556, 10,
Jordan Hoffmann, Sebastian Borgeaud, Arthur Mensch, Elena Buchatskaya, Trevor Cai, Eliza Rutherford, DDL Casas, Lisa Anne Hendricks, Johannes Welbl, Aidan Clark, et al. Training compute-optimal large language models.arXiv preprint arXiv:2203.15556, 10,
-
[6]
doi: 10.1145/3703155. Ziqi Huang, Yinan He, Jiashuo Yu, Fan Zhang, Chenyang Si, Yuming Jiang, Yuanhan Zhang, Tianxing Wu, Qingyang Jin, Nattapol Chanpaisit, Yaohui Wang, Xinyuan Chen, Limin Wang, Dahua Lin, Yu Qiao, and Ziwei Liu. VBench: Comprehensive benchmark suite for video generative models. InProceedings of the IEEE/CVF Conference on Computer Vision...
-
[7]
When to trust your model: Model-based policy optimization.ArXiv, abs/1906.08253,
Michael Janner, Justin Fu, Marvin Zhang, and Sergey Levine. When to trust your model: Model-based policy optimization.ArXiv, abs/1906.08253,
arXiv 1906
-
[8]
doi: 10.1145/3571730. Harini Kannan, Danijar Hafner, Chelsea Finn, and Dumitru Erhan. Robodesk: A multi-task reinforcement learning benchmark.https://github.com/google-research/robodesk,
-
[9]
Sergey Levine, Aviral Kumar, George Tucker, and Justin Fu. Offline reinforcement learning: Tutorial, review, and perspectives on open problems.arXiv preprint arXiv:2005.01643,
Pith/arXiv arXiv 2005
-
[10]
Evaluating object hallu- cination in large vision-language models
11 Yifan Li, Yifan Du, Kun Zhou, Jinpeng Wang, Wayne Xin Zhao, and Ji-Rong Wen. Evaluating object hallu- cination in large vision-language models. InProceedings of the 2023 Conference on Empirical Methods in Natural Language Processing (EMNLP),
2023
-
[11]
Vincent Micheli, Eloi Alonso, and François Fleuret
URLhttps://arxiv.org/abs/ 2601.02427. Vincent Micheli, Eloi Alonso, and François Fleuret. Transformers are sample-efficient world models. InThe Eleventh International Conference on Learning Representations,
-
[12]
URLhttps://openreview.net/ forum?id=vhFu1Acb0xb. NVIDIA. Cosmos world foundation model platform for physical ai.arXiv preprint arXiv:2501.03575,
-
[13]
Open X-Embodiment Collaboration, Abby O’Neill, Abdul Rehman, Abhinav Gupta, Abhiram Maddukuri, Ab- hishek Gupta, Abhishek Padalkar, Abraham Lee, Acorn Pooley, Agrim Gupta, Ajay Mandlekar, Ajinkya Jain, Albert Tung, Alex Bewley, Alex Herzog, Alex Irpan, Alexander Khazatsky, Anant Rai, Anchit Gupta, Andrew Wang, Andrey Kolobov, Anikait Singh, Animesh Garg, ...
-
[14]
doi: 10.1109/IROS.2012.6386109. Dani Valevski, Yaniv Leviathan, Moab Arar, and Shlomi Fruchter. Diffusion models are real-time game en- gines,
-
[15]
URLhttps://arxiv.org/abs/2408.14837. Ashish Vaswani, Noam Shazeer, Niki Parmar, Jakob Uszkoreit, Llion Jones, Aidan N Gomez, Łukasz Kaiser, and Illia Polosukhin. Attention is all you need.Advances in neural information processing systems, 30,
-
[16]
Wan: Open and advanced large-scale video generative models.arXiv preprint arXiv:2503.20314,
Team Wan, Ang Wang, Baole Ai, Bin Wen, Chaojie Mao, Chen-Wei Xie, Di Chen, Feiwu Yu, Haiming Zhao, Jianxiao Yang, Jianyuan Zeng, Jiayu Wang, Jingfeng Zhang, Jingren Zhou, Jinkai Wang, Jixuan Chen, Kai Zhu, Kang Zhao, Keyu Yan, Lianghua Huang, Mengyang Feng, Ningyi Zhang, Pandeng Li, Pingyu Wu, Ruihang Chu, Ruili Feng, Shiwei Zhang, Siyang Sun, Tao Fang, T...
-
[17]
14 A Related Work World models for control.World models that learn environment dynamics from data have a long history in model-based RL, ranging from abstract latent dynamics models [Ha and Schmidhuber, 2018, Hafner et al., 2020, Hansen et al., 2022, 2024] to high-capacity generative models that render full pixel observations [Micheli et al., 2023, Alonso...
2018
-
[18]
Each data source contains 50 trajectories per task
22 Table 8.Targeted data collection for finetuning on 10 unseen tasks (experttest set).We finetune our world model on a set of 10 seen + 10 unseen tasks, varying data source and finetuning strategy. Each data source contains 50 trajectories per task. The offline results in Table 2 are computed over a test set that consists of trajectories from both expert...
2025
discussion (0)
Sign in with ORCID, Apple, or X to comment. Anyone can read and Pith papers without signing in.