Investigation of regional variations in CO₂ growth rates : Integrating Emission Inventories and Atmospheric Observations
Pith reviewed 2026-06-30 01:15 UTC · model grok-4.3
The pith
Regional atmospheric CO2 growth rates are dominated by natural carbon-cycle processes that mask anthropogenic emission signals.
A machine-rendered reading of the paper's core claim, the machinery that carries it, and where it could break.
Core claim
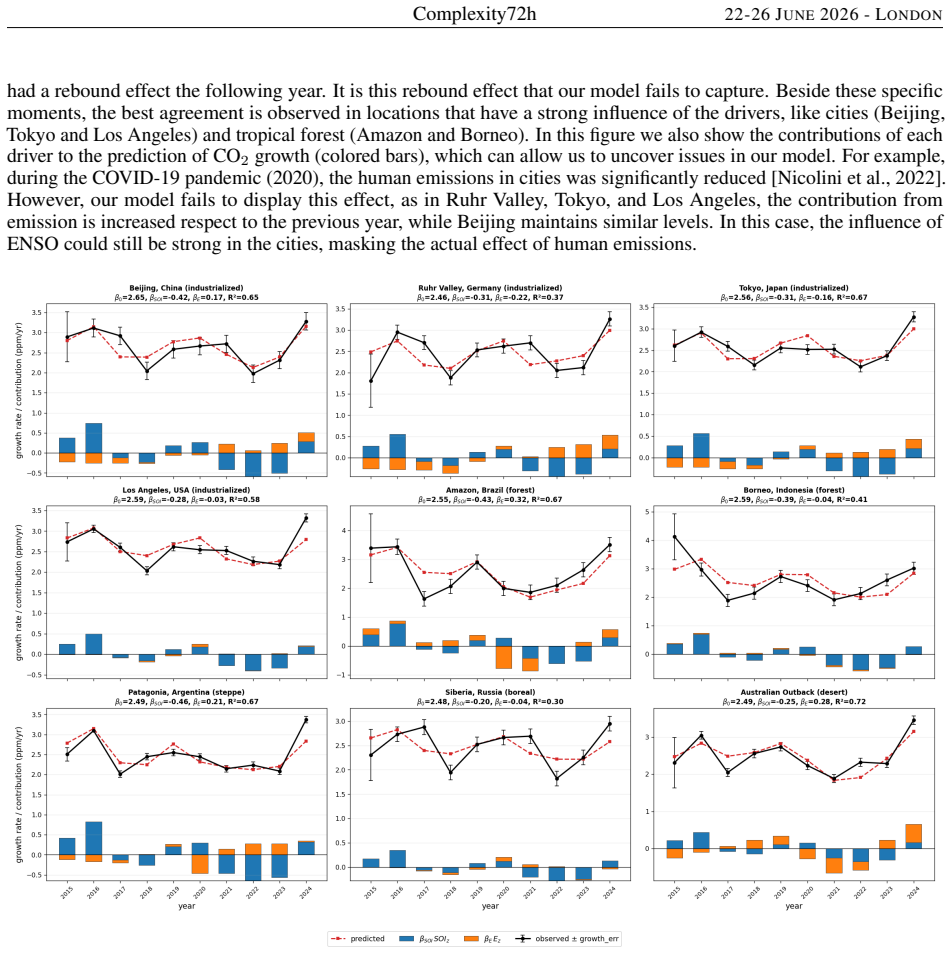
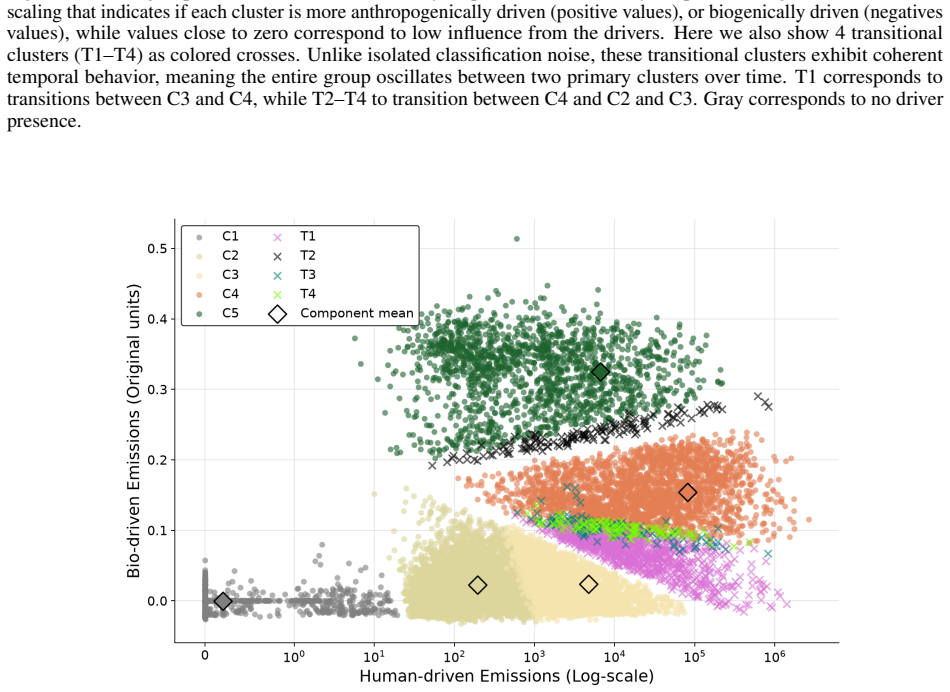
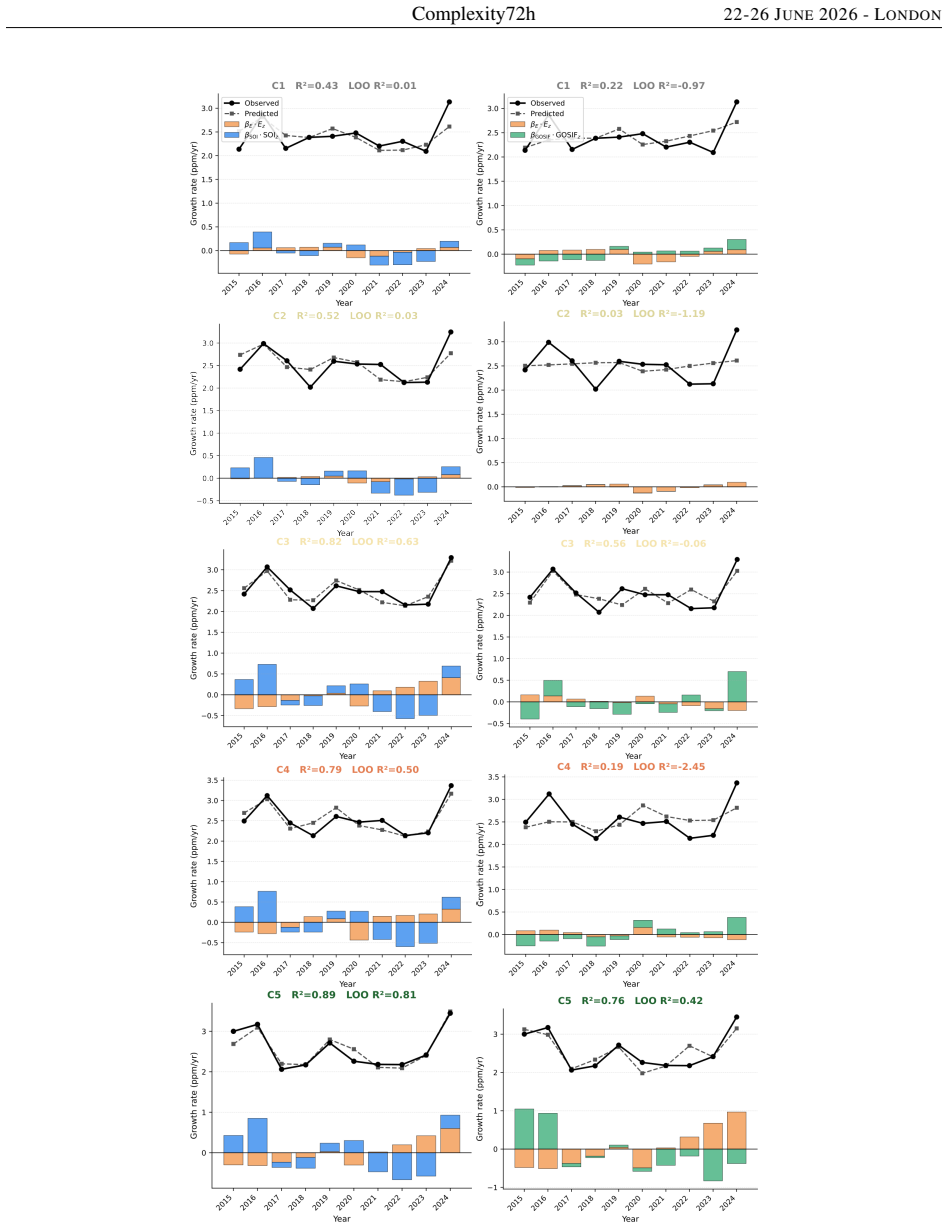
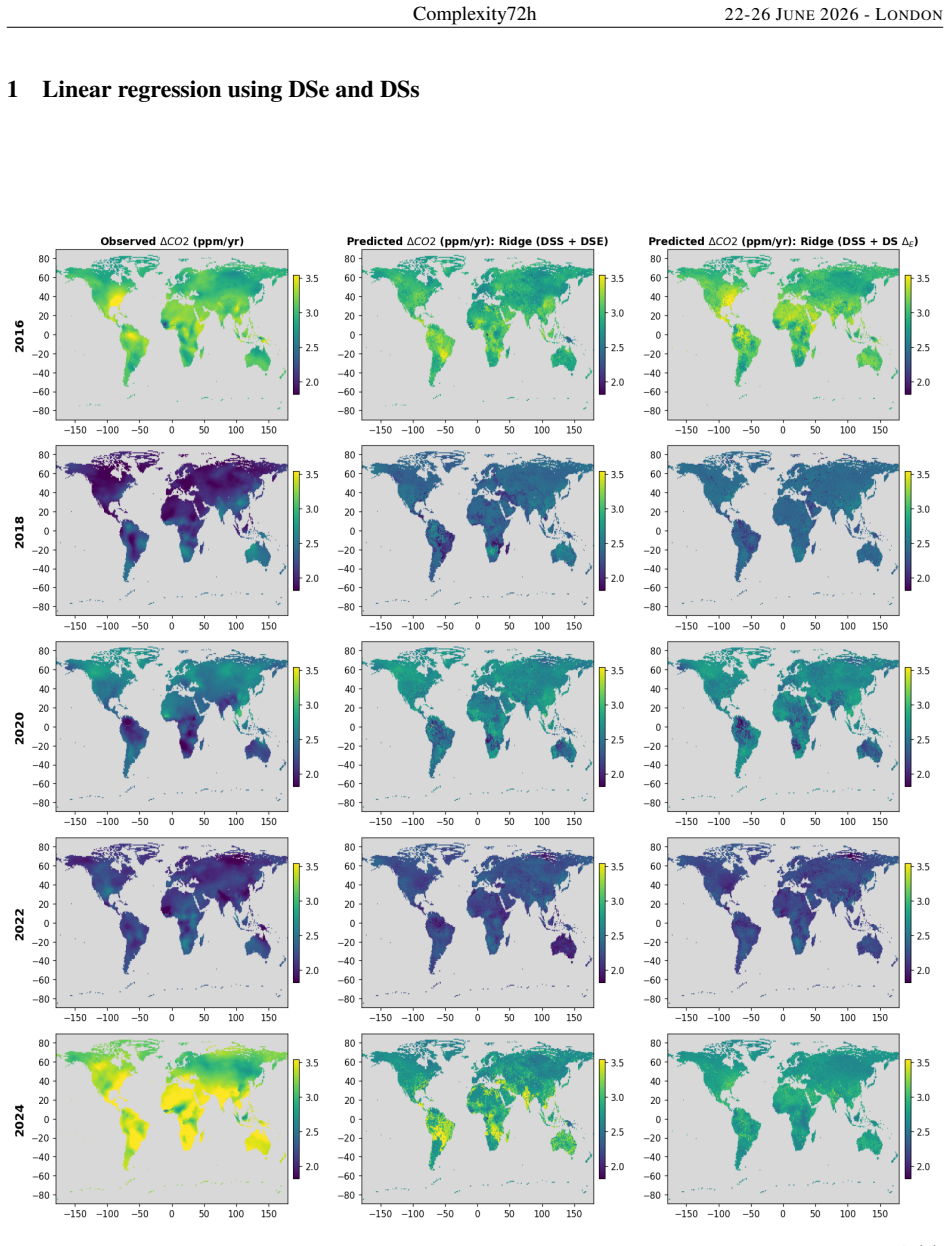
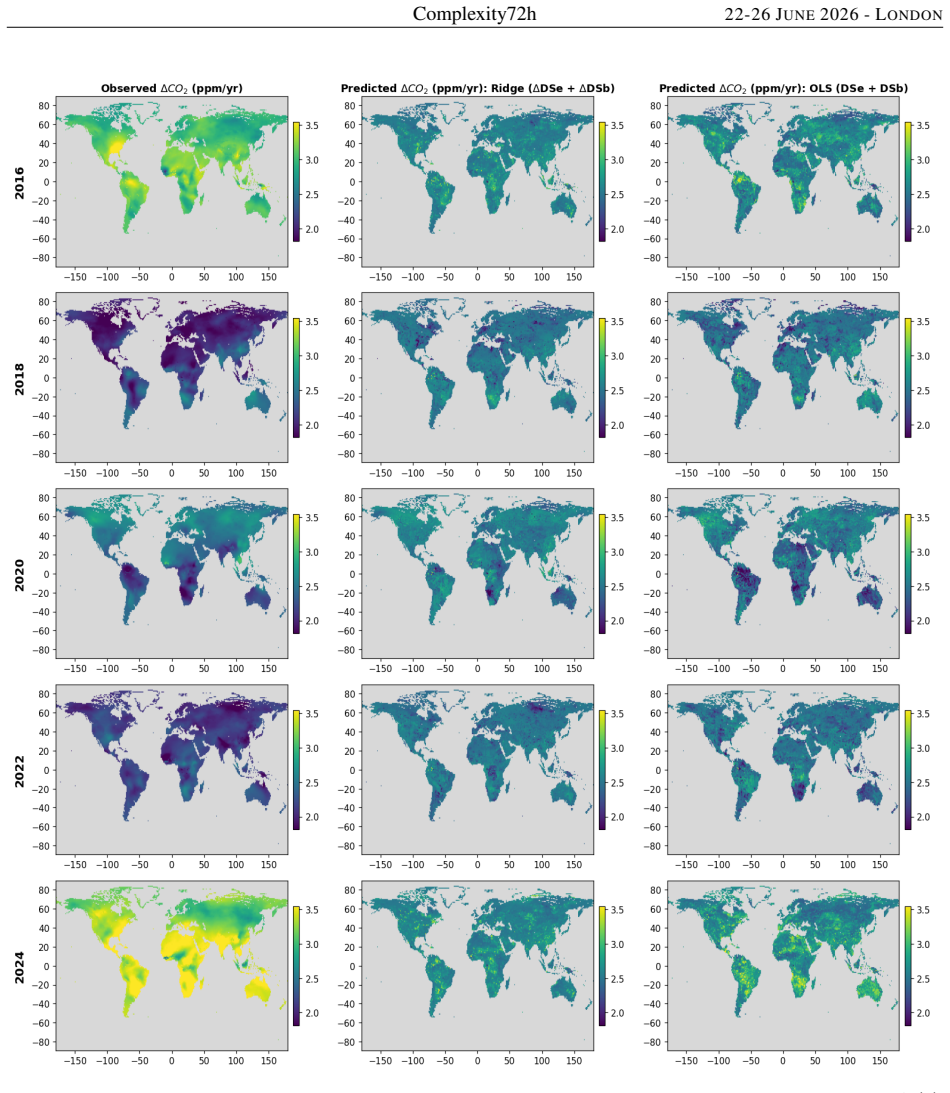
Atmospheric CO2 growth rate varies substantially across space and time but is dominated by natural carbon-cycle processes and global background trends. Anthropogenic emission signals are frequently masked by natural variability, making regional top-down detection of human emission changes difficult. The COVID-19 emission reductions in 2020, despite occurring during a neutral ENSO year, were not consistently reflected in regional atmospheric CO2 growth rates. Using unsupervised clustering and persistence analysis, five characteristic carbon-cycle regimes are identified, with spatial averaging removing much of the regional variability and leaving large-scale climate as the dominant control in
What carries the argument
Unsupervised clustering and persistence analysis applied to combined atmospheric, emission, biospheric, and climate-variability data to identify five characteristic carbon-cycle regimes.
If this is right
- Regional top-down detection of changes in human emissions is limited by the masking effect of natural variability.
- Spatial averaging of data shifts emphasis to large-scale climate controls in most identified regimes.
- Strong biogenic signals persist and dominate in active biosphere zones such as tropical forests.
- Global background trends exert primary control once local variability is averaged out.
Where Pith is reading between the lines
- Strategies for emission verification may need to prioritize regions where natural signals are weaker or more predictable.
- Higher-resolution transport modeling could help isolate anthropogenic contributions in future analyses.
- The identified regimes suggest that monitoring networks focused on tropical areas might capture more persistent biogenic influences on CO2.
Load-bearing premise
The atmospheric reanalysis, anthropogenic emission inventory, biospheric activity dataset, and climate variability index each accurately capture their target components without systematic biases large enough to change the clustering outcomes or the conclusion that natural signals mask anthropogenic ones.
What would settle it
Observation that regional atmospheric CO2 growth rates in 2020 showed reductions matching the scale and pattern of COVID-related emission decreases across multiple clusters.
Figures


read the original abstract
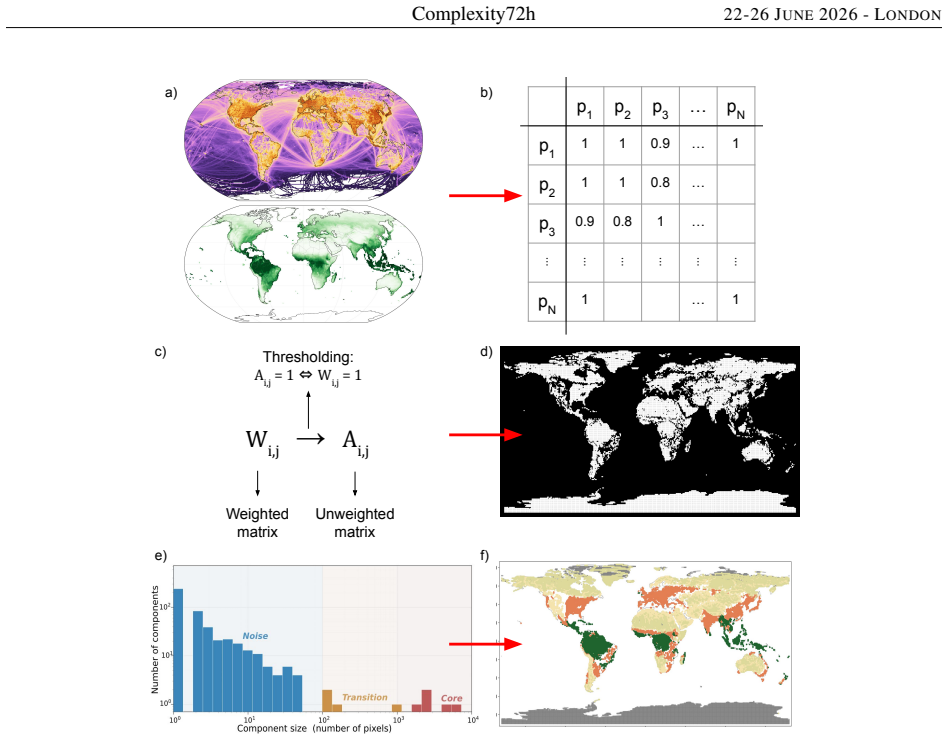
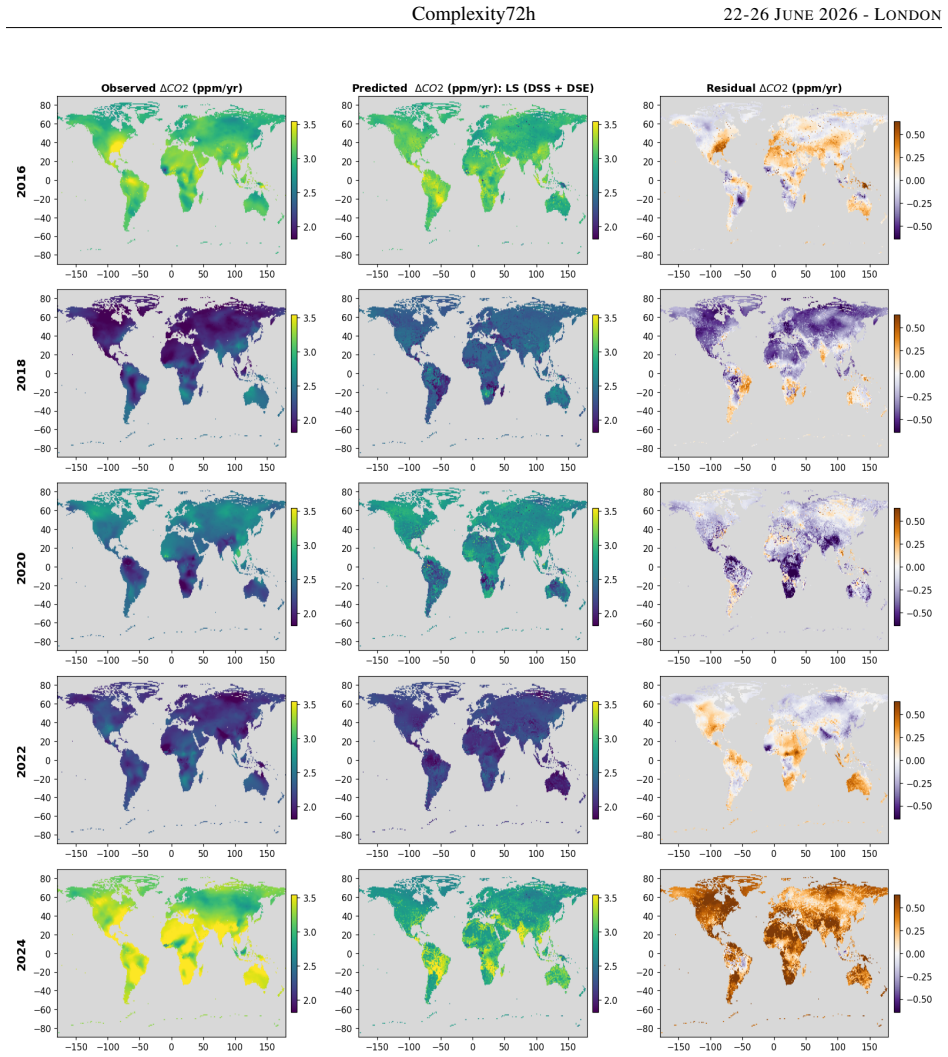
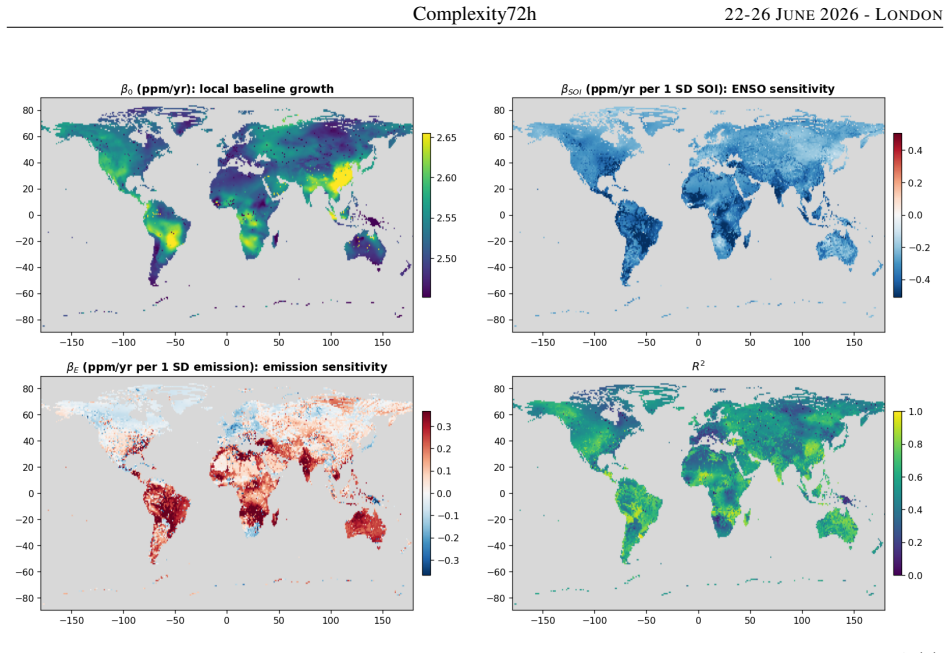
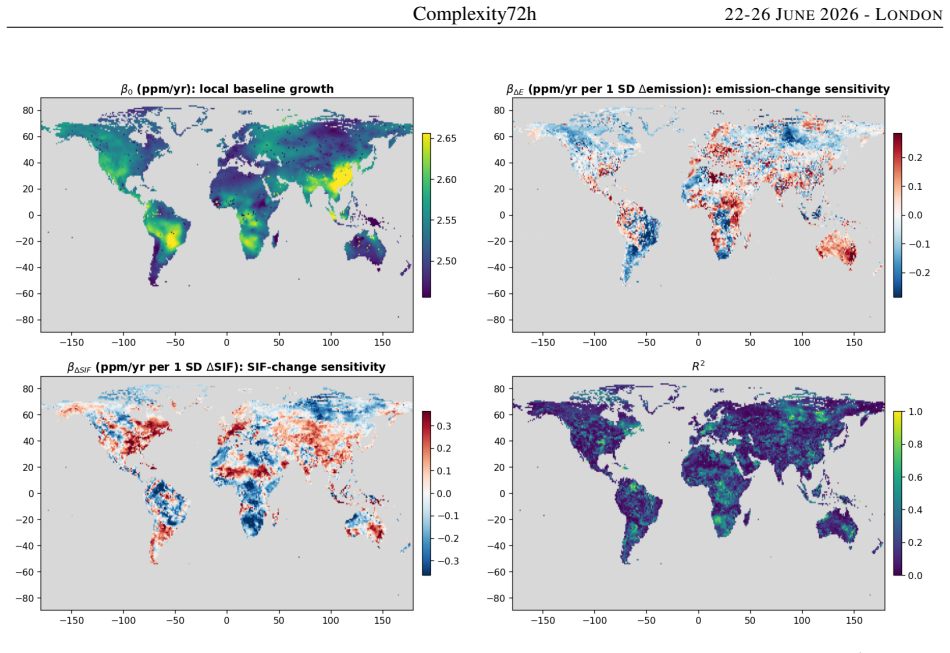
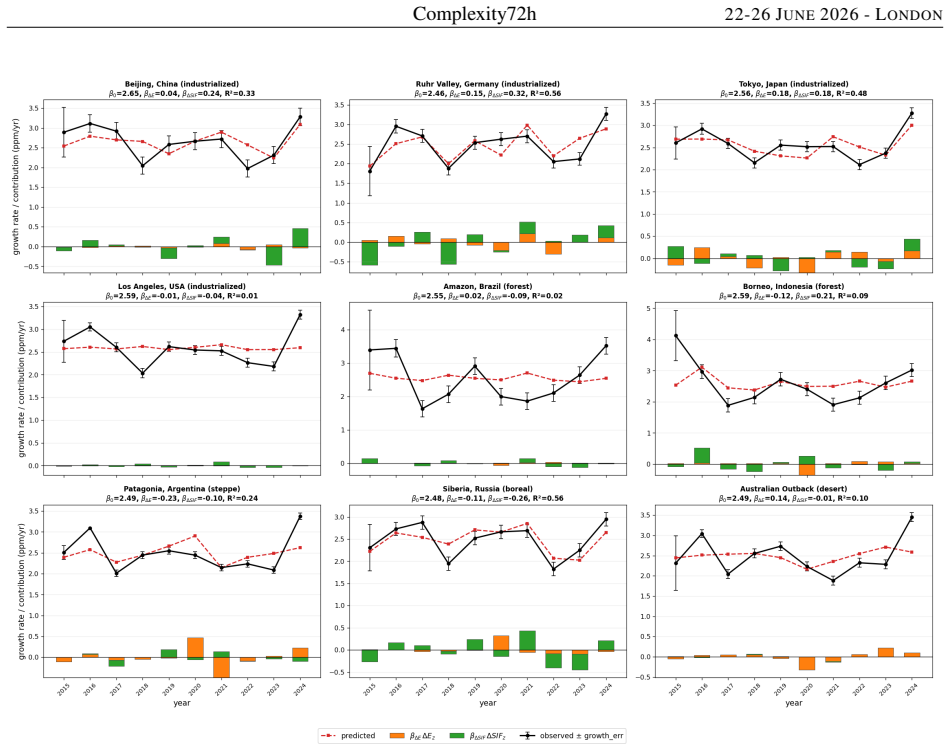
Atmospheric carbon dioxide (CO2) growth rates reflects the combined influence of anthropogenic emissions, biospheric carbon exchange, and climate variability. While climate mitigation is primarily evaluated using bottom-up emission inventories within political boundaries, there is a need to validate these emission reductions using atmospheric measurements. Here, we present a global top-down analysis of atmospheric CO2 growth rates using CAMS atmospheric CO2 reanalysis, EDGAR anthropogenic emissions, GOSIF dataset and the Southern Oscillation Index (SOI) as a measures of biospheric activity, to quantify the relative influence of human and natural drivers. We find that atmospheric CO2 growth rate varies substantially across space and time but is dominated by natural carbon-cycle processes and global background trends. Anthropogenic emission signals are frequently masked by natural variability, making regional top-down detection of human emission changes difficult. The COVID-19 emission reductions in 2020, despite occurring during a neutral ENSO year, were not consistently reflected in regional atmospheric CO2 growth rates, highlighting the dominant roles of biospheric dynamics and atmospheric transport. Using unsupervised clustering and persistence analysis, we identify five characteristic carbon-cycle regimes. Spatial averaging removes much of the regional variability, leaving large-scale climate as the dominant control in most regimes. The active biosphere is the main exception, where strong biogenic signals persist, underscoring the critical role of tropical forests in shaping atmospheric CO2 variability.
Editorial analysis
A structured set of objections, weighed in public.
Referee Report
Summary. The manuscript presents a top-down analysis of global atmospheric CO2 growth rates using CAMS reanalysis fields, EDGAR emission inventories, GOSIF GPP data, and the SOI index. It concludes that regional and temporal variations in growth rates are dominated by natural carbon-cycle processes and background trends, with anthropogenic emission signals (including 2020 COVID-related reductions during a neutral ENSO year) frequently masked by biospheric and transport variability. Unsupervised clustering identifies five characteristic regimes, with spatial averaging shown to suppress regional signals except in the active-biosphere regime.
Significance. If the central attribution holds after addressing dataset-bias and robustness concerns, the work would usefully quantify the practical limits of regional top-down detection of emission changes against natural variability, with direct relevance to verification of mitigation policies. The regime classification could provide a framework for interpreting carbon-cycle controls, though its value depends on demonstrated stability under alternative processing choices.
major comments (3)
- [Results and Discussion (clustering and persistence analysis)] The claim that anthropogenic signals are masked (including the 2020 COVID reductions not appearing in regional growth rates) rests on the assumption that CAMS, EDGAR, GOSIF, and SOI contain no systematic biases large enough to alter clustering outcomes or attribution; no sensitivity tests to alternative inventories, reanalysis products, or transport-error scenarios are reported, leaving the masking conclusion vulnerable to dataset-specific artifacts.
- [Methods (clustering and persistence analysis)] The unsupervised clustering procedure that yields the five carbon-cycle regimes is presented without reported hyperparameters (e.g., number of clusters chosen, distance metric, initialization), data-exclusion criteria, or cross-validation against random seeds or subsamples; this directly affects the robustness of the regime map and the subsequent claim that spatial averaging leaves large-scale climate as the dominant control.
- [Results (growth-rate maps and time series)] No uncertainty quantification (error bars, bootstrap intervals, or ensemble spread) is attached to the reported growth-rate time series, regime assignments, or the statement that COVID reductions were "not consistently reflected"; without these, it is impossible to determine whether the absence of an anthropogenic signal exceeds the expected variability from natural terms.
minor comments (2)
- [Figures] Figure captions should explicitly state the temporal averaging window and any spatial smoothing applied to the growth-rate fields.
- [Abstract and Methods] The abstract states that the analysis uses "measures of biospheric activity" but the text does not clarify how GOSIF GPP is converted into a growth-rate contribution; a short methods paragraph would improve clarity.
Simulated Author's Rebuttal
We thank the referee for their constructive comments, which highlight important aspects of robustness and presentation. We address each major comment below and outline revisions to strengthen the manuscript.
read point-by-point responses
-
Referee: [Results and Discussion (clustering and persistence analysis)] The claim that anthropogenic signals are masked (including the 2020 COVID reductions not appearing in regional growth rates) rests on the assumption that CAMS, EDGAR, GOSIF, and SOI contain no systematic biases large enough to alter clustering outcomes or attribution; no sensitivity tests to alternative inventories, reanalysis products, or transport-error scenarios are reported, leaving the masking conclusion vulnerable to dataset-specific artifacts.
Authors: We agree that the lack of reported sensitivity tests represents a limitation in demonstrating robustness. While the datasets employed are standard and widely validated in the carbon-cycle literature, we will add sensitivity analyses in the revised manuscript using alternative emission inventories and reanalysis products to evaluate the stability of the clustering outcomes and the attribution of masked anthropogenic signals. revision: yes
-
Referee: [Methods (clustering and persistence analysis)] The unsupervised clustering procedure that yields the five carbon-cycle regimes is presented without reported hyperparameters (e.g., number of clusters chosen, distance metric, initialization), data-exclusion criteria, or cross-validation against random seeds or subsamples; this directly affects the robustness of the regime map and the subsequent claim that spatial averaging leaves large-scale climate as the dominant control.
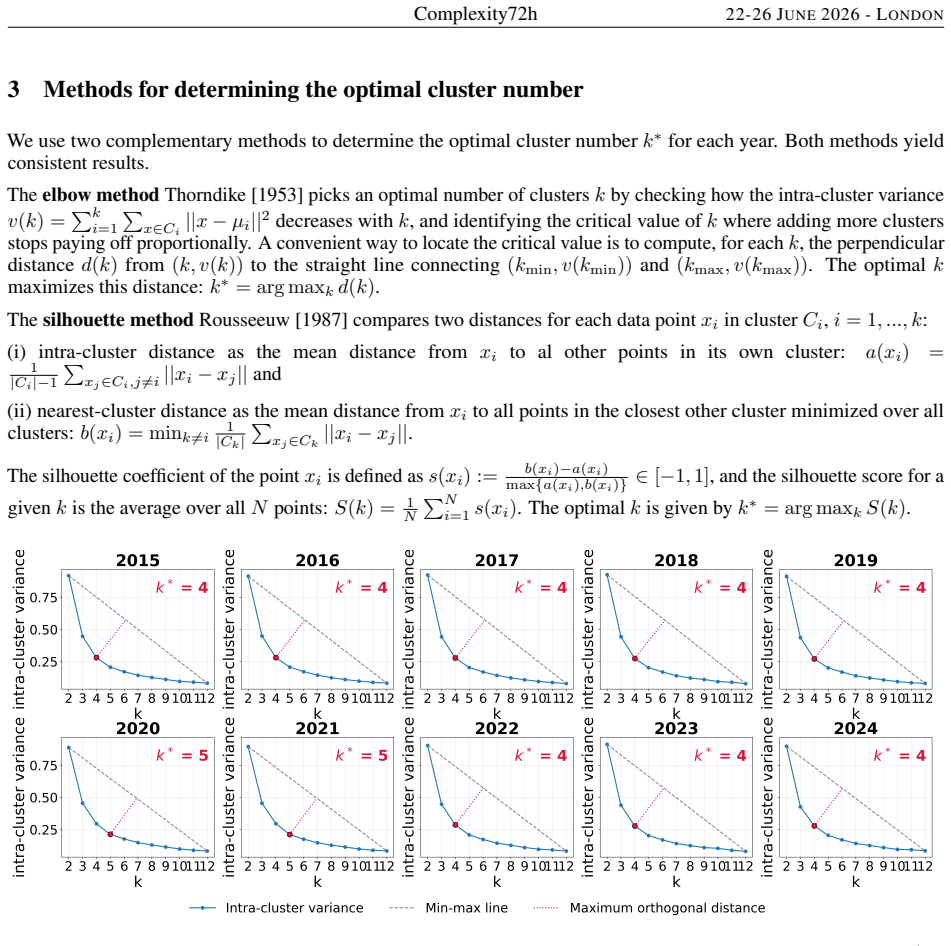
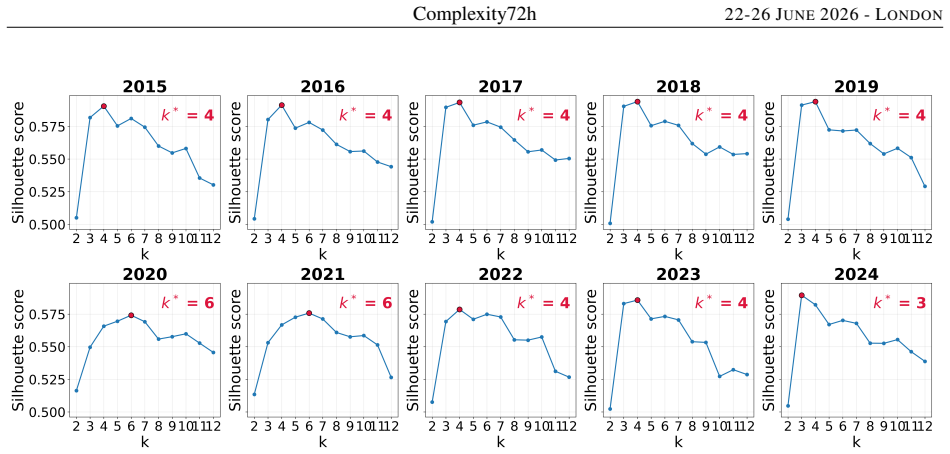
Authors: The clustering procedure details were not fully specified in the original submission. In the revised Methods section we will report the number of clusters (selected via silhouette analysis), the distance metric, initialization approach, data-exclusion criteria, and results across multiple random seeds and subsamples to confirm the stability of the five-regime classification and the spatial-averaging conclusions. revision: yes
-
Referee: [Results (growth-rate maps and time series)] No uncertainty quantification (error bars, bootstrap intervals, or ensemble spread) is attached to the reported growth-rate time series, regime assignments, or the statement that COVID reductions were "not consistently reflected"; without these, it is impossible to determine whether the absence of an anthropogenic signal exceeds the expected variability from natural terms.
Authors: We concur that uncertainty quantification is necessary to support statements about signal masking. The revised manuscript will include bootstrap-derived intervals or ensemble spread estimates for the growth-rate time series and regime assignments, enabling a quantitative evaluation of whether the absence of the COVID-related signal is distinguishable from natural variability. revision: yes
Circularity Check
No significant circularity; analysis relies on independent external datasets and unsupervised methods
full rationale
The paper performs a top-down analysis by ingesting four independent external datasets (CAMS CO2 reanalysis, EDGAR emissions, GOSIF GPP, SOI index) and applying unsupervised clustering plus persistence analysis. No equations, fitted parameters, or self-citations are used to derive the reported spatial regimes or the conclusion that natural variability masks anthropogenic signals. All load-bearing inputs are externally sourced and not redefined from the paper's own outputs, satisfying the self-contained criterion.
Axiom & Free-Parameter Ledger
axioms (1)
- domain assumption CAMS reanalysis, EDGAR, GOSIF, and SOI each provide sufficiently unbiased representations of their target quantities for the purpose of regime identification.
Reference graph
Works this paper leans on
-
[1]
Thoning, K. W. and Tans, P. P. , number =. 1989 , journal =. doi:10.1029/JD094iD06p08549 , issn =
-
[2]
Sussmann, Ralf and Rettinger, Markus , number =. 2020 , journal =. doi:10.3390/RS12152387 , issn =
-
[4]
Lindqvist, H. and O'Dell, C. W. and Basu, S. and Boesch, H. and Chevallier, F. and Deutscher, N. and Feng, L. and Fisher, B. and Hase, F. and Inoue, M. and Kivi, R. and Morino, I. and Palmer, P. I. and Parker, R. and Schneider, M. and Sussmann, R. and Yoshida, Y. , number =. 2015 , journal =. doi:10.5194/acp-15-13023-2015 , issn =
-
[5]
Labzovskii, Lev D. and Kenea, Samuel Takele and Lindqvist, Hannakaisa and Kim, Jinwon and Li, Shanlan and Byun, Young Hwa and Goo, Tae Young , number =. 2021 , journal =. doi:10.3390/RS13193868/S1 , issn =
-
[6]
2024 , journal =
Hachmeister, Jonas and Schneising, Oliver and Buchwitz, Michael and Burrows, John P and Notholt, Justus and Buschmann, Matthias , pages =. 2024 , journal =
2024
-
[7]
Tollefson, Jeff , number =. 2016 , journal =. doi:10.1038/nature.2016.19216 , issn =
-
[8]
Li, Xing and Xiao, Jingfeng , number =. 2019 , journal =. doi:10.3390/rs11050517 , issn =
-
[9]
doi:10.1038/nclimate2911 , issn =
2016 , journal =. doi:10.1038/nclimate2911 , issn =
-
[10]
Rogelj, Joeri and Huppmann, Daniel and Krey, Volker and Riahi, Keywan and Clarke, Leon and Gidden, Matthew and Nicholls, Zebedee and Meinshausen, Malte , number =. 2019 , journal =. doi:10.1038/s41586-019-1541-4 , issn =
-
[11]
Comber, Alexis and Brunsdon, Christopher and Charlton, Martin and Dong, Guanpeng and Harris, Richard and Lu, Binbin and L. 2023 , journal =. doi:https://doi.org/10.1111/gean.12316 , issn =
-
[12]
1979 , booktitle =
Hartigan, J A and Wong, M A , number =. 1979 , booktitle =
1979
-
[13]
and Gasser, Thomas and Grassi, Giacomo and Forsell, Nicklas and Janssens, Iris and Lamb, William F
Gidden, Matthew J. and Gasser, Thomas and Grassi, Giacomo and Forsell, Nicklas and Janssens, Iris and Lamb, William F. and Minx, Jan and Nicholls, Zebedee and Steinhauser, Jan and Riahi, Keywan , number =. 2023 , journal =. doi:10.1038/s41586-023-06724-y , issn =
-
[14]
Xiao, Qingyang and Chang, Howard H and Geng, Guannan and Liu, Yang , number =. 2018 , journal =. doi:10.1021/acs.est.8b02917 , issn =
-
[15]
1987 , journal =
Ropelewski, Chester F and Jones, Phil D , number =. 1987 , journal =
1987
-
[16]
and Griffith, David W
Mostafavi Pak, Nasrin and Hachmeister, Jonas and Rettinger, Markus and Buschmann, Matthias and Deutscher, Nicholas M. and Griffith, David W. T. and Iraci, Laura T. and Lan, Xin and McGee, Erin and Morino, Isamu and Pollard, Dave and Roehl, Coleen M. and Strong, Kimberly and Kivi, Rigel and Wennberg, Paul , month =. 2025 , journal =
2025
-
[17]
2017 , booktitle =
Lesnikowski, Alexandra and Ford, James D and Berrang-Ford, Lea and Biesbroek, G R , pages =. 2017 , booktitle =
2017
-
[18]
Lourens, Lucas J , editor =. 2021 , booktitle =. doi:https://doi.org/10.1016/B978-0-12-821575-3.00028-1 , keywords =
-
[19]
2019 , journal =
Lenton, Timothy M and Rockstr. 2019 , journal =
2019
-
[20]
Zhu, Qindan and Laughner, Joshua L and Cohen, Ronald C , number =. 2022 , journal =. doi:10.1021/acs.est.1c05636 , issn =
-
[21]
2022 , journal =
Lamb, William F and Grubb, Michael and Diluiso, Francesca and Minx, Jan C , number =. 2022 , journal =
2022
-
[22]
Grassi, Giacomo and Stehfest, Elke and Rogelj, Joeri and van Vuuren, Detlef and Cescatti, Alessandro and House, Jo and Nabuurs, Gert Jan and Rossi, Simone and Alkama, Ramdane and Vi. 2021 , journal =. doi:10.1038/s41558-021-01033-6 , issn =
-
[23]
2026 , journal =
Lamb, W F and Andrew, R M and Jones, M and Nicholls, Z and Peters, G P and Smith, C and Saunois, M and Grassi, G and Pongratz, J and Smith, S J and Tubiello, F N and Crippa, M and Gidden, M and Friedlingstein, P and Minx, J and Forster, P M , number =. 2026 , journal =
2026
-
[24]
2023 , journal =
Vernooij, R and Eames, T and Russell-Smith, J and Yates, C and Beatty, R and Evans, J and Edwards, A and Ribeiro, N and Wooster, M and Strydom, T and Giongo, M V and Borges, M A and Menezes Costa, M and Barradas, A C S and van Wees, D and der Werf, G R , number =. 2023 , journal =
2023
-
[25]
2009 , journal =
Yeh, Sang-Wook and Kug, Jong-Seong and Dewitte, Boris and Kwon, Min-Ho and Kirtman, Ben P and Jin, Fei-Fei , number =. 2009 , journal =
2009
-
[26]
Isson, T T and Planavsky, N J and Coogan, L A and Stewart, E M and Ague, J J and Bolton, E W and Zhang, S and McKenzie, N R and Kump, L R , number =. 2020 , journal =. doi:https://doi.org/10.1029/2018GB006061 , issn =
-
[27]
Brunsdon, Chris and Fotheringham, A Stewart and Charlton, Martin E , number =. 1996 , journal =. doi:https://doi.org/10.1111/j.1538-4632.1996.tb00936.x , issn =
-
[28]
McMillen, Daniel P , number =. 2004 , journal =. doi:10.1111/j.0002-9092.2004.600
-
[29]
Allen, Myles R. and Frame, David J. and Friedlingstein, Pierre and Gillett, Nathan P. and Grassi, Giacomo and Gregory, Jonathan M. and Hare, William and House, Jo and Huntingford, Chris and Jenkins, Stuart and Jones, Chris D. and Knutti, Reto and Lowe, Jason A. and Matthews, H. Damon and Meinshausen, Malte and Meinshausen, Nicolai and Peters, Glen P. and ...
-
[30]
Kennedy, John and Dunn, Robert and McCarthy, Mark and Titchner, Holly and Morice, Colin , number =. 2017 , journal =. doi:10.1002/wea.3042 , issn =
-
[31]
2025 , journal =
Friedlingstein, Pierre and O'Sullivan, Michael and Jones, Matthew W and Andrew, Robbie M and Bakker, Dorothee C E and Hauck, Judith and Landsch. 2025 , journal =
2025
-
[32]
Grassi, Giacomo and Peters, Glen P and Canadell, Josep G and Cescatti, Alessandro and Federici, Sandro and Gidden, Matthew J and Harris, Nancy and Herold, Martin and Krug, Thelma and O’Sullivan, Michael and Pongratz, Julia and Sanz, María J and Schwingshackl, Clemens and van Vuuren, Detlef , number =. 2025 , journal =. doi:10.1038/s41893-025-01565-1 , issn =
-
[33]
2024 , journal =
Forster, P M and Smith, C and Walsh, T and Lamb, W F and Lamboll, R and Hall, B and Hauser, M and Ribes, A and Rosen, D and Gillett, N P and Palmer, M D and Rogelj, J and von Schuckmann, K and Trewin, B and Allen, M and Andrew, R and Betts, R A and Borger, A and Boyer, T and Broersma, J A and Buontempo, C and Burgess, S and Cagnazzo, C and Cheng, L and Fr...
2024
-
[34]
Forster, P M and Smith, C and Walsh, T and Lamb, W F and Lamboll, R and Cassou, C and Hauser, M and Hausfather, Z and Lee, J.-Y. and Palmer, M D and von Schuckmann, K and Slangen, A B A and Szopa, S and Trewin, B and Yun, J and Gillett, N P and Jenkins, S and Matthews, H D and Raghavan, K and Ribes, A and Rogelj, J and Rosen, D and Zhang, X and Allen, M a...
2025
-
[35]
2017 , journal =
Chatterjee, A and Gierach, M M and Sutton, A J and Feely, R A and Crisp, D and Eldering, A and Gunson, M R and O’Dell, C W and Stephens, B B and Schimel, D S , number =. 2017 , journal =
2017
-
[36]
2024 , journal =
Crippa, Monica and Guizzardi, Diego and Pagani, Federico and Schiavina, Marcello and Melchiorri, Michele and Pisoni, Enrico and Graziosi, Francesco and Muntean, Marilena and Maes, Joachim and Dijkstra, Lewis , number =. 2024 , journal =
2024
-
[37]
Crippa, Monica and Guizzardi, Diego and Pagani, Federico and Schiavina, Marcello and Melchiorri, Michele and Pisoni, Enrico and Graziosi, Francesco and Muntean, Marilena and Maes, Joachim and Dijkstra, Lewis and Van Damme, Martin and Clarisse, Lieven and Coheur, Pierre , number =. 2024 , journal =. doi:10.5194/essd-16-2811-2024 , issn =
-
[38]
BONGAARTS, JOHN , number =. 2024 , journal =. doi:https://doi.org/10.1111/padr.12632 , issn =
-
[39]
Marongiu, Alessandro and Distefano, Gabriele Giuseppe and Moretti, Marco and Petrosino, Federico and Fossati, Giuseppe and Collalto, Anna Gilia and Angelino, Elisabetta , number =. 2024 , journal =. doi:10.3390/air2040022 , issn =
-
[40]
Stirnberg, Roland and Cermak, Jan and Fuchs, Julia and Andersen, Hendrik , number =. 2020 , journal =. doi:https://doi.org/10.1029/2019JD031380 , issn =
-
[41]
Craft, Brianna and Fisher, Susannah , number =. 2018 , journal =. doi:10.1080/14693062.2018.1485546 , issn =
-
[42]
Cleveland, William S , number =. 1979 , journal =. doi:10.1080/01621459.1979.10481038 , issn =
-
[43]
1987 , booktitle =
Rousseeuw, Peter J , pages =. 1987 , booktitle =
1987
-
[44]
2013 , journal =
Solanki, Sami K and Krivova, Natalie A and Haigh, Joanna D , pages =. 2013 , journal =
2013
-
[45]
Pauw, Pieter and Mbeva, Kennedy and van Asselt, Harro , number =. 2019 , journal =. doi:10.1057/s41599-019-0298-6 , issn =
-
[46]
Mann, Michael E and Rahmstorf, Stefan and Steinman, Byron A and Tingley, Martin and Miller, Sonya K , number =. 2016 , journal =. doi:10.1038/srep19831 , issn =
-
[47]
2019 , booktitle =
Delbeke, Jos and Runge-Metzger, Artur and Slingenberg, Yvon and Werksman, Jake , pages =. 2019 , booktitle =
2019
-
[48]
Cole-Dai, Jihong , number =. 2010 , journal =. doi:https://doi.org/10.1002/wcc.76 , issn =
-
[49]
2012 , journal =
Levitus, Sydney and Antonov, John I and Boyer, Tim P and Baranova, Olga K and Garcia, Hernan Eduardo and Locarnini, Ricardo Alejandro and Mishonov, Alexey V and Reagan, James R and Seidov, Dan and Yarosh, Evgeney S , number =. 2012 , journal =
2012
-
[50]
Tyndall, John , number =. 1861 , journal =. doi:10.1080/14786446108643138 , issn =
-
[51]
Arrhenius, Svante , number =. 1896 , journal =. doi:10.1080/14786449608620846 , issn =
-
[52]
and Calvin, K
Lee, H. and Calvin, K. and Dasgupta, D. and Krinner, G. and Mukherji, A. and Thorne, P. and Trisos, C. and Romero, J. and Aldunce, P. and Barret, K. and Blanco, G. , doi =
-
[53]
Liu, Junjie and Bowman, Kevin W. and Schimel, David S. and Parazoo, Nicolas C. and Jiang, Zhe and Lee, Meemong and Bloom, A. Anthony and Wunch, Debra and Frankenberg, Christian and Sun, Ying and others , journal =. 2017 , publisher =. doi:10.1126/science.aam5690 , url =
-
[54]
Shiga, Yoichi P. and Tadi. Geophysical Research Letters , volume =. 2018 , publisher =. doi:10.1002/2017GL076630 , url =
-
[55]
Zhang, Shaoqing and Lei, Liping and Sheng, Mengya and Song, Hao and Li, Luman and Guo, Kaiyuan and Ma, Caihong and Liu, Liangyun and Zeng, Zhaocheng , journal =. 2022 , publisher =. doi:10.3390/rs14195024 , url =
-
[56]
Hakkarainen, Janne and Ialongo, Iolanda and Tamminen, Johanna , journal =. 2016 , publisher =. doi:10.1002/2016GL070885 , url =
-
[57]
Mostafavi Pak, Nasrin and Hachmeister, Jonas and Rettinger, Markus and Buschmann, Matthias and Deutscher, Nicholas M. and Griffith, David W. T. and Iraci, Laura T. and Lan, Xin and McGee, Erin and Morino, Isamu and others , journal =. 2026 , publisher =. doi:10.5194/bg-23-1477-2026 , url =
-
[58]
Atmospheric Chemistry and Physics , volume =
Buchwitz, Michael and Reuter, Maximilian and Schneising, Oliver and No. Atmospheric Chemistry and Physics , volume =. 2018 , publisher =. doi:10.5194/acp-18-17355-2018 , url =
-
[59]
doi:10.1017/9781009157964 , url =
2019 , pages =. doi:10.1017/9781009157964 , url =
-
[60]
Technical note: The CAMS greenhouse gas reanalysis from 2003 to 2020 , JOURNAL =
Agust\'. Technical note: The CAMS greenhouse gas reanalysis from 2003 to 2020 , JOURNAL =. 2023 , NUMBER =
2003
-
[61]
Solanki, Sami K. and Krivova, Natalie A. and Haigh, Joanna D. , title =. Annual Review of Astronomy and Astrophysics , volume =. 2013 , publisher =. doi:10.1146/annurev-astro-082812-141007 , issn =
-
[62]
and Jin, Fei-Fei , title =
Yeh, Sang-Wook and Kug, Jong-Seong and Dewitte, Boris and Kwon, Min-Ho and Kirtman, Ben P. and Jin, Fei-Fei , title =. Nature , volume =. 2009 , doi =
2009
-
[63]
Friedlingstein, Pierre and O'Sullivan, Michael and Jones, Matthew W. and Andrew, Robbie M. and Bakker, Dorothee C. E. and Hauck, Judith and Landsch. Earth System Science Data , volume =. 2026 , publisher =. doi:10.5194/essd-18-3211-2026 , url =
-
[64]
2026 , month = jan, url =
2026
-
[65]
and Berrang-Ford, Lea and Biesbroek, Robbert , title =
Lesnikowski, Alexandra and Ford, James D. and Berrang-Ford, Lea and Biesbroek, Robbert , title =. 2017 , isbn =
2017
-
[66]
and Jones, Phil D
Ropelewski, Chester F. and Jones, Phil D. , title =. Monthly Weather Review , volume =. 1987 , doi =
1987
-
[67]
, title =
Thorndike, Robert L. , title =. Psychometrika , volume =. 1953 , doi =
1953
-
[68]
, title =
Rousseeuw, Peter J. , title =. Journal of Computational and Applied Mathematics , volume =. 1987 , doi =
1987
-
[69]
and Planavsky, Noah J
Isson, Terry T. and Planavsky, Noah J. and Coogan, Laurence A. and Stewart, Emily M. and Ague, Jay J. and Bolton, Edward W. and Zhang, Shuang and McKenzie, N. Ryan and Kump, Lee R. , title =. Global Biogeochemical Cycles , volume =. 2020 , doi =
2020
-
[70]
and Smith, Chris and Walsh, Tristram and Lamb, William F
Forster, Piers M. and Smith, Chris and Walsh, Tristram and Lamb, William F. and Lamboll, Robin and Hall, Bradley and Hauser, Mathias and Ribes, Aur. Earth System Science Data , volume =. 2024 , publisher =. doi:10.5194/essd-16-2625-2024 , issn =
-
[71]
and Smith, Chris and Walsh, Tristram and Lamb, William F
Forster, Piers M. and Smith, Chris and Walsh, Tristram and Lamb, William F. and Lamboll, Robin and Cassou, Christophe and Hauser, Mathias and Hausfather, Zeke and Lee, June-Yi and Palmer, Matthew D. and others , title =. Earth System Science Data , volume =. 2025 , publisher =. doi:10.5194/essd-17-2641-2025 , url =
-
[72]
2025 , doi =
Crippa, Monica and Guizzardi, Diego and Pagani, Federico and Banja, Manjola and Muntean, Marilena and Schaaf, Edwin and Quadrelli, Roberta and Risquez Martin, Ana and Taghavi-Moharamli, Parisa and K. 2025 , doi =
2025
-
[73]
and Sutton, Adrienne J
Chatterjee, Abhishek and Gierach, Michelle M. and Sutton, Adrienne J. and Feely, Richard A. and Crisp, David and Eldering, Annmarie and Gunson, Michael R. and O'Dell, Christopher W. and Stephens, Britton B. and Schimel, David S. , title =. Science , volume =. 2017 , doi =
2017
-
[74]
and Andrew, Robbie M
Lamb, William F. and Andrew, Robbie M. and Jones, Matthew W. and Nicholls, Zebedee and Peters, Glen P. and Smith, Christopher J. and Saunois, Marielle and Grassi, Giacomo and Pongratz, Julia and Smith, Steven J. and Tubiello, Francesco N. and Crippa, Monica and Gidden, Matthew and Friedlingstein, Pierre and Minx, Jan C. and Forster, Piers M. , title =. Ea...
2026
-
[75]
and Wong, Manchek A
Hartigan, John A. and Wong, Manchek A. , title =. Journal of the Royal Statistical Society: Series C (Applied Statistics) , volume =. 1979 , doi =
1979
-
[76]
, title =
Lan, Xin and Tans, Pieter and Thoning, Kirk W. , title =. 2026 , doi =
2026
-
[77]
Zhang, Yucong and Liu, Xinjie and Lei, Liping and Liu, Liangyun , title =. Remote Sensing , volume =. 2022 , publisher =. doi:10.3390/rs14163899 , issn =
-
[78]
Ji, Zhanghui and Song, Hao and Lei, Liping and Sheng, Mengya and Guo, Kaiyuan and Zhang, Shaoqing , title =. Atmosphere , volume =. 2024 , publisher =. doi:10.3390/atmos15030323 , issn =
-
[79]
Atmospheric Measurement Techniques , volume =
Mustafa, Farhan and Bu, Lingbing and Wang, Qin and Yao, Na and Shahzaman, Muhammad and Bilal, Muhammad and Aslam, Rana Waqar and Iqbal, Rashid , title =. Atmospheric Measurement Techniques , volume =. 2021 , publisher =. doi:10.5194/amt-14-7277-2021 , issn =
-
[80]
Earth System Dynamics , volume=
Dynamic savanna burning emission factors based on satellite data using a machine learning approach , author=. Earth System Dynamics , volume=. 2023 , publisher=
2023
-
[81]
5 concentrations in China from satellite data , author=
An ensemble machine-learning model to predict historical PM2. 5 concentrations in China from satellite data , author=. Environmental science & technology , volume=. 2018 , publisher=
2018
discussion (0)
Sign in with ORCID, Apple, or X to comment. Anyone can read and Pith papers without signing in.