Insights into Jet-Induced Cloud Disruption in NGC 1316: ALMA Reveals a Spatially Extended Molecular Gas
Pith reviewed 2026-06-30 09:03 UTC · model grok-4.3
The pith
ALMA data show that jets in NGC 1316 destroy molecular clouds, producing mostly extended gas.
A machine-rendered reading of the paper's core claim, the machinery that carries it, and where it could break.
Core claim
The high extended gas fraction results from the destruction of molecular clouds due to interactions with the jet plasma. NGC 1316 may be a good example of jet-induced negative feedback through the ablation, dispersal, and rarification of dense molecular clouds through jet-ISM interactions.
What carries the argument
The expanding bubble model for the 5 kpc warm ionized gas shell, powered by a jet of 1.6×10^43 erg s^{-1}, that encompasses the molecular NW Shell and drives the observed cloud disruption.
If this is right
- Gas near the jet exhibits R21 ~1 and R31 ~1 while gas away from the jet shows typical ratios of ~0.7 and ~0.3.
- The 24 identified GMAs have velocity dispersions roughly twice those of clouds in normal star-forming galaxies at the same size.
- The molecular NW Shell lies inside the 5 kpc ionized shell whose morphology and energy budget match jet-driven expansion.
- The net effect is a reduction in the dense molecular gas reservoir available for star formation.
Where Pith is reading between the lines
- The same ablation process could operate in other radio galaxies that host kpc-scale jets and extended molecular gas.
- If confirmed, the mechanism supplies a direct channel by which jet activity can lower the star-formation efficiency without expelling all the gas.
- Higher-resolution ALMA imaging or kinematic modeling of individual GMAs could test whether the high dispersions arise from direct jet-cloud collisions.
Load-bearing premise
The 5 kpc warm ionized gas shell is an expanding bubble whose energetics and shape are powered by the jet at 1.6×10^43 erg s^{-1}.
What would settle it
A direct measurement showing that the jet mechanical power is orders of magnitude below or above 1.6×10^43 erg s^{-1}, or finding that the elevated line ratios and high dispersions do not spatially correlate with jet proximity, would falsify the disruption claim.
Figures


read the original abstract
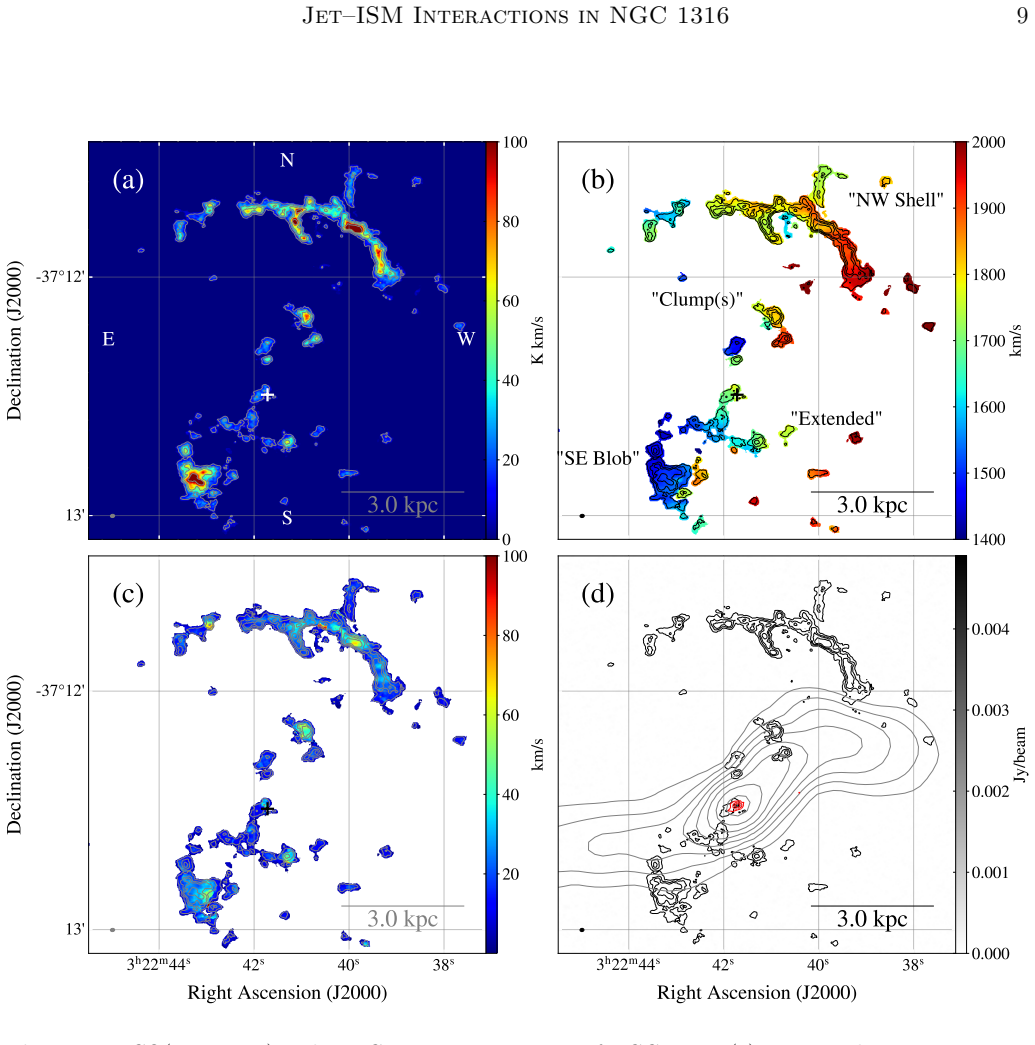
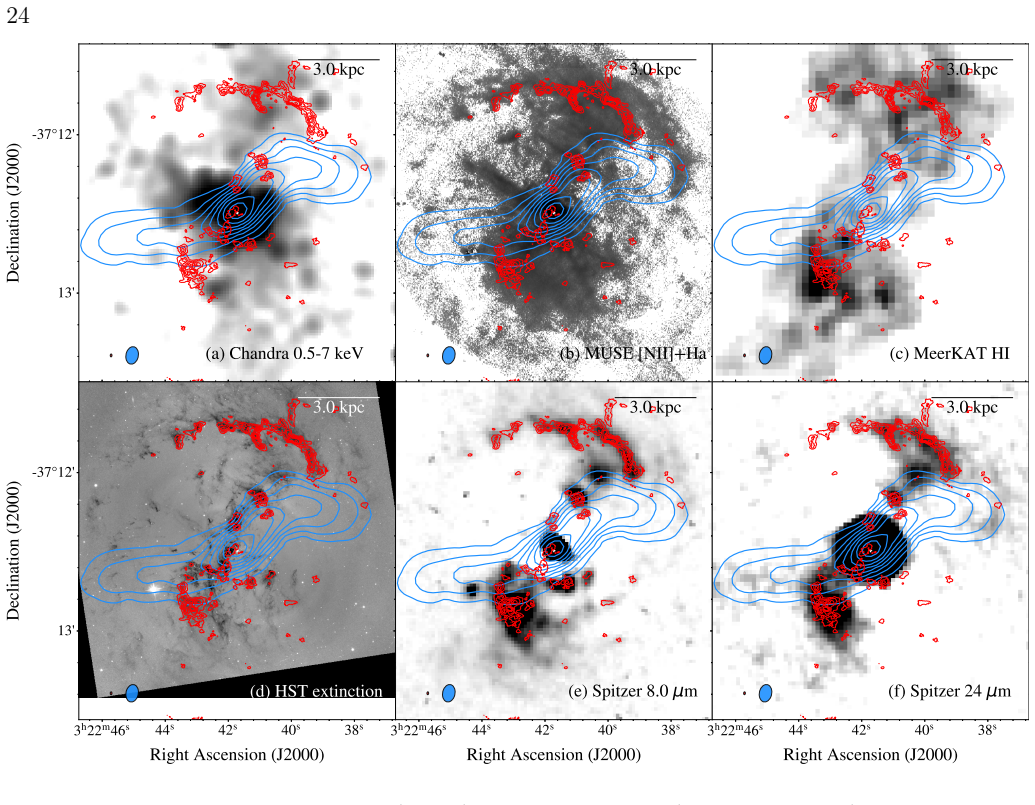
We present ALMA CO($J=1-0$) observations of a nearby radio galaxy NGC1316 at a 100-pc resolution to investigate the impact of AGN jets on the molecular gas. The molecular gas exhibits complex spatial and kinematic distributions, with broad CO line widths ($>50$ km s$^{-1}$) observed in several regions. The interferometric CO flux is only 34%-38% compared to single-dish data, indicating a large fraction of spatially extended molecular gas, especially in the central regions. We identified 24 Giant Molecular Clouds Associations (GMAs) primarily within the ``NW Shell'' and the ``SE Blob''; these GMAs show velocity dispersions approximately twice as high as those in typical star-forming galaxies for their sizes. Analysis of archival ALMA CO($J=2-1$) and CO($J=3-2$) data reveals elevated line ratios ($R_{21} \sim 1$ and $R_{31} \sim 1$) in gas near the jet, whereas, away from the jet, typical values ($R_{21} \sim 0.7$, $R_{31} \sim 0.3$). A multi-wavelength comparison reveals a $\sim$5 kpc warm ionized gas shell that encompasses the molecular NW Shell. The observed energetics and bubble morphology are consistent with an expanding bubble model driven by the jet assuming a jet power of $1.6\times10^{43}$~erg~s$^{-1}$. We propose that the high extended gas fraction results from the destruction of molecular clouds due to interactions with the jet plasma. NGC1316 may be a good example of jet-induced negative feedback through the ablation, dispersal, and rarification of dense molecular clouds through jet-ISM interactions.
Editorial analysis
A structured set of objections, weighed in public.
Referee Report
Summary. The paper presents ALMA CO(1-0) observations of NGC 1316 at ~100 pc resolution. It reports that interferometric flux recovers only 34-38% of single-dish values, indicating substantial spatially extended molecular gas; identifies 24 GMAs with velocity dispersions roughly twice those of typical star-forming galaxies; finds elevated CO(2-1)/CO(1-0) and CO(3-2)/CO(1-0) ratios near the jet; and associates a ~5 kpc warm ionized shell with an expanding bubble whose energetics match a jet power of 1.6×10^{43} erg s^{-1}. The central interpretation is that jet-ISM interactions ablate and disperse molecular clouds, providing an example of negative feedback.
Significance. If the causal attribution of the extended molecular component and the ionized shell to jet-driven ablation holds, the work supplies a nearby, spatially resolved case of AGN jet feedback that can be compared directly with simulations of cloud destruction. The line-ratio and GMA dispersion measurements supply quantitative diagnostics that are independent of the bubble model and could be tested in other systems.
major comments (2)
- [Abstract] Abstract: The statement that 'the observed energetics and bubble morphology are consistent with an expanding bubble model driven by the jet' is conditioned on assuming a jet power of 1.6×10^{43} erg s^{-1}. The manuscript must show whether this value is obtained from independent radio or X-ray constraints or is chosen to match the shell; if the latter, the negative-feedback interpretation becomes circular and requires an explicit sensitivity test to lower powers.
- The 34-38% missing CO flux is interpreted as jet-ablated, dispersed material. The text should quantify whether excitation variations, primary-beam attenuation, or single-dish calibration offsets could account for a comparable fraction; without such tests the attribution to jet-induced destruction remains one of several viable explanations.
minor comments (1)
- [Abstract] The abstract states line widths '>50 km s^{-1}' but does not specify whether these are FWHM or dispersion; consistent usage with the GMA table would aid comparison.
Simulated Author's Rebuttal
We thank the referee for their constructive and detailed report. We address each major comment below and have made revisions to the manuscript where the concerns are valid.
read point-by-point responses
-
Referee: [Abstract] Abstract: The statement that 'the observed energetics and bubble morphology are consistent with an expanding bubble model driven by the jet' is conditioned on assuming a jet power of 1.6×10^{43} erg s^{-1}. The manuscript must show whether this value is obtained from independent radio or X-ray constraints or is chosen to match the shell; if the latter, the negative-feedback interpretation becomes circular and requires an explicit sensitivity test to lower powers.
Authors: The adopted jet power is drawn from independent radio lobe energetics reported in the literature for NGC 1316. To eliminate any ambiguity, we have revised the abstract to state the value's origin explicitly and added a sensitivity analysis in the discussion section demonstrating consistency of the bubble model for jet powers between 5×10^{42} and 3×10^{43} erg s^{-1}. revision: yes
-
Referee: [—] The 34-38% missing CO flux is interpreted as jet-ablated, dispersed material. The text should quantify whether excitation variations, primary-beam attenuation, or single-dish calibration offsets could account for a comparable fraction; without such tests the attribution to jet-induced destruction remains one of several viable explanations.
Authors: We agree that the original text did not provide quantitative limits on these alternatives. The revised manuscript includes new calculations: excitation variations (constrained by the archival CO(2-1) and CO(3-2) maps) can explain at most ~15% of the discrepancy; primary-beam attenuation affects <5% of the total flux; and single-dish calibration offsets are limited to ~10-20% based on literature cross-checks. These tests support extended emission as the dominant cause, though we have softened the language to present jet ablation as the favored interpretation. revision: yes
Circularity Check
No significant circularity; claims rest on independent observations
full rationale
The paper presents new ALMA CO(1-0) data showing missing flux (34-38%), elevated line ratios near the jet, and morphological coincidence with an ionized shell. The expanding-bubble consistency check explicitly assumes a jet power value rather than deriving or predicting it from the data. No equations, parameters, or results reduce to fitted inputs by construction, and no self-citation chains or self-definitional steps appear. The negative-feedback interpretation is an inference from the observations against standard models, not a tautology.
Axiom & Free-Parameter Ledger
free parameters (1)
- jet power =
1.6e43 erg s^{-1}
axioms (2)
- domain assumption Molecular line ratios indicate excitation conditions influenced by jet interactions.
- domain assumption Velocity dispersions twice typical indicate jet-induced turbulence or disruption.
Reference graph
Works this paper leans on
-
[1]
Alexander, D. M., Hickox, R. C., Aird, J., et al. 2025, NewAR, 101, 101733, doi: 10.1016/j.newar.2025.101733
-
[2]
Arnaboldi, M., Freeman, K. C., Gerhard, O., et al. 1998, ApJ, 507, 759, doi: 10.1086/306359 42 1472 km/s 1522 km/s 1572 km/s 1622 km/s 1672 km/s 1722 km/s 1772 km/s 1822 km/s 1872 km/s 1922 km/s 1972 km/s 2022 km/s 0.1 0.2 0.3 0.4 0.5 0.6 0.7 0.8 0.9 1.0 12M/TP Figure 19.12-m/TP ratio map at different velocity channels. Contours indicate the TP integrated...
-
[3]
2023, A&A, 671, L12, doi: 10.1051/0004-6361/202345964
Audibert, A., Ramos Almeida, C., Garc´ ıa-Burillo, S., et al. 2023, A&A, 671, L12, doi: 10.1051/0004-6361/202345964
-
[4]
2025, MNRAS, 541, 494, doi: 10.1093/mnras/staf977 Banda-Barrag´ an, W
Ruffa, I. 2025, MNRAS, 541, 494, doi: 10.1093/mnras/staf977 Banda-Barrag´ an, W. E., Br¨ uggen, M., Heesen, V., et al. 2021, MNRAS, 506, 5658, doi: 10.1093/mnras/stab1884
-
[5]
Barnes, K. L., van Zee, L., Dale, D. A., et al. 2014, ApJ, 789, 126, doi: 10.1088/0004-637X/789/2/126
-
[6]
Gaibler, V. 2016, MNRAS, 455, 4166, doi: 10.1093/mnras/stv2551 Jet–ISM Interactions in NGC 131643 1472 km/s 1522 km/s 1572 km/s 1622 km/s 1672 km/s 1722 km/s 1772 km/s 1822 km/s 1872 km/s 1922 km/s 1972 km/s 2022 km/s 0.1 0.2 0.3 0.4 0.5 0.6 0.7 0.8 0.9 1.0 7M/TP Figure 20.7-m/TP ratio map at different velocity channels. Contours indicate the TP integrate...
-
[7]
Bolatto, A. D., Wolfire, M., & Leroy, A. K. 2013, ARA&A, 51, 207, doi: 10.1146/annurev-astro-082812-140944
work page internal anchor Pith review doi:10.1146/annurev-astro-082812-140944 2013
-
[8]
Bower, R. G., Benson, A. J., Malbon, R., et al. 2006, MNRAS, 370, 645, doi: 10.1111/j.1365-2966.2006.10519.x Cald´ u-Primo, A., Schruba, A., Walter, F., et al. 2015, AJ, 149, 76, doi: 10.1088/0004-6256/149/2/76
-
[9]
Cantiello, M., Grado, A., Blakeslee, J. P., et al. 2013, A&A, 552, A106, doi: 10.1051/0004-6361/201220756
-
[10]
Cavagnolo, K. W., McNamara, B. R., Nulsen, P. E. J., et al. 2010, ApJ, 720, 1066, doi: 10.1088/0004-637X/720/2/1066
-
[11]
2003, PASP, 115, 763, doi: 10.1086/376392
Chabrier, G. 2003, PASP, 115, 763, doi: 10.1086/376392
work page internal anchor Pith review doi:10.1086/376392 2003
-
[12]
Chapin, E. L., Pope, A., Scott, D., et al. 2009, MNRAS, 398, 1793, doi: 10.1111/j.1365-2966.2009.15267.x
-
[13]
Cielo, S., Bieri, R., Volonteri, M., Wagner, A. Y., & Dubois, Y. 2018, MNRAS, 477, 1336, doi: 10.1093/mnras/sty708 44
-
[14]
2014, ApJ, 784, 3, doi: 10.1088/0004-637X/784/1/3
Colombo, D., Hughes, A., Schinnerer, E., et al. 2014, ApJ, 784, 3, doi: 10.1088/0004-637X/784/1/3
-
[15]
Cooper, J. L., Bicknell, G. V., Sutherland, R. S., & Bland-Hawthorn, J. 2009, ApJ, 703, 330, doi: 10.1088/0004-637X/703/1/330
-
[16]
Cowie, L. L., & McKee, C. F. 1977, ApJ, 211, 135, doi: 10.1086/154911
-
[17]
Cowie, L. L., & Songaila, A. 1977, Nature, 266, 501, doi: 10.1038/266501a0
-
[18]
Croton, D. J., Springel, V., White, S. D. M., et al. 2006, MNRAS, 365, 11, doi: 10.1111/j.1365-2966.2005.09675.x
-
[19]
M., Combes, F., Oosterloo, T., et al
Dasyra, K. M., Combes, F., Oosterloo, T., et al. 2016, A&A, 595, L7, doi: 10.1051/0004-6361/201629689 Dav´ e, R., Angl´ es-Alc´ azar, D., Narayanan, D., et al. 2019, MNRAS, 486, 2827, doi: 10.1093/mnras/stz937
-
[20]
Davis, T. A., Greene, J. E., Ma, C.-P., et al. 2019, MNRAS, 486, 1404, doi: 10.1093/mnras/stz871
-
[21]
Draine, B. T., Dale, D. A., Bendo, G., et al. 2007, ApJ, 663, 866, doi: 10.1086/518306 Duah Asabere, B., Horellou, C., Jarrett, T. H., &
-
[22]
2016, A&A, 592, A20, doi: 10.1051/0004-6361/201528047
Winkler, H. 2016, A&A, 592, A20, doi: 10.1051/0004-6361/201528047
-
[23]
Dutta, R., Sharma, P., Sarkar, K. C., & Stone, J. M. 2024, ApJ, 973, 148, doi: 10.3847/1538-4357/ad67d7
-
[24]
D., Goss, W
Ekers, R. D., Goss, W. M., Wellington, K. J., et al. 1983, A&A, 127, 361
1983
-
[25]
2022, ApJ, 938, 105, doi: 10.3847/1538-4357/ac8ff8
Fabbiano, G., Paggi, A., Morganti, R., et al. 2022, ApJ, 938, 105, doi: 10.3847/1538-4357/ac8ff8
-
[26]
Fabian, A. C. 2012, ARA&A, 50, 455, doi: 10.1146/annurev-astro-081811-125521
work page internal anchor Pith review doi:10.1146/annurev-astro-081811-125521 2012
-
[27]
M., Storchi-Bergmann, T., et al
Finlez, C., Nagar, N. M., Storchi-Bergmann, T., et al. 2018, MNRAS, 479, 3892, doi: 10.1093/mnras/sty1555
-
[28]
Fomalont, E. B., Ebneter, K. A., van Breugel, W. J. M., & Ekers, R. D. 1989, ApJL, 346, L17, doi: 10.1086/185568
-
[29]
2001, PASJ, 53, L41, doi: 10.1093/pasj/53.6.L41
Fukui, Y., Mizuno, N., Yamaguchi, R., Mizuno, A., & Onishi, T. 2001, PASJ, 53, L41, doi: 10.1093/pasj/53.6.L41
-
[30]
2015, A&A, 579, A62, doi: 10.1051/0004-6361/201526151
Gaspari, M., Brighenti, F., & Temi, P. 2015, A&A, 579, A62, doi: 10.1051/0004-6361/201526151
-
[31]
Gaspari, M., Ruszkowski, M., & Oh, S. P. 2013, MNRAS, 432, 3401, doi: 10.1093/mnras/stt692
-
[32]
2017, MNRAS, 466, 677, doi: 10.1093/mnras/stw3108
Gaspari, M., Temi, P., & Brighenti, F. 2017, MNRAS, 466, 677, doi: 10.1093/mnras/stw3108
-
[33]
Geldzahler, B. J., & Fomalont, E. B. 1984, AJ, 89, 1650, doi: 10.1086/113668
-
[34]
Minniti, D. 2001, MNRAS, 328, 237, doi: 10.1046/j.1365-8711.2001.04860.x
-
[35]
2026, arXiv e-prints, arXiv:2601.16566, doi: 10.48550/arXiv.2601.16566
Gronke, M., & Schneider, E. 2026, arXiv e-prints, arXiv:2601.16566, doi: 10.48550/arXiv.2601.16566
-
[36]
Harrison, C. M., & Ramos Almeida, C. 2024, Galaxies, 12, 17, doi: 10.3390/galaxies12020017
-
[37]
Heyer, M. H., Carpenter, J. M., & Snell, R. L. 2001, ApJ, 551, 852, doi: 10.1086/320218
-
[38]
2018, PASJ, 70, 73, doi: 10.1093/pasj/psy071
Hirota, A., Egusa, F., Baba, J., et al. 2018, PASJ, 70, 73, doi: 10.1093/pasj/psy071
-
[39]
2024, ApJ, 976, 198, doi: 10.3847/1538-4357/ad8228
Hirota, A., Koda, J., Egusa, F., et al. 2024, ApJ, 976, 198, doi: 10.3847/1538-4357/ad8228
-
[40]
Horellou, C., Black, J. H., van Gorkom, J. H., et al. 2001, A&A, 376, 837, doi: 10.1051/0004-6361:20011039
-
[41]
Husemann, B., Bennert, V. N., Jahnke, K., et al. 2019, ApJ, 879, 75, doi: 10.3847/1538-4357/ab24bc
-
[42]
2016, ApJ, 820, 42, doi: 10.3847/0004-637X/820/1/42
Iodice, E., Capaccioli, M., Grado, A., et al. 2016, ApJ, 820, 42, doi: 10.3847/0004-637X/820/1/42
-
[43]
2017, ApJ, 839, 21, doi: 10.3847/1538-4357/aa6846
Iodice, E., Spavone, M., Capaccioli, M., et al. 2017, ApJ, 839, 21, doi: 10.3847/1538-4357/aa6846
-
[44]
Jarrett, T. H., Cluver, M. E., Brown, M. J. I., et al. 2019, ApJS, 245, 25, doi: 10.3847/1538-4365/ab521a
-
[45]
2007, ApJL, 666, L21, doi: 10.1086/521527
Kaneda, H., Onaka, T., & Sakon, I. 2007, ApJL, 666, L21, doi: 10.1086/521527
-
[46]
2003, ApJ, 586, 826, doi: 10.1086/367930
Kim, D.-W., & Fabbiano, G. 2003, ApJ, 586, 826, doi: 10.1086/367930
-
[47]
Kleiner, D., Serra, P., Maccagni, F. M., et al. 2021, A&A, 648, A32, doi: 10.1051/0004-6361/202039898
-
[48]
2025, ApJ, 986, 29, doi: 10.3847/1538-4357/add1dc
Koda, J., Egusa, F., Hirota, A., et al. 2025, ApJ, 986, 29, doi: 10.3847/1538-4357/add1dc
-
[49]
2020, ApJL, 890, L10, doi: 10.3847/2041-8213/ab70b7
Koda, J., Sawada, T., Sakamoto, K., et al. 2020, ApJL, 890, L10, doi: 10.3847/2041-8213/ab70b7
-
[50]
2023, ApJ, 949, 108, doi: 10.3847/1538-4357/acc65e
Koda, J., Hirota, A., Egusa, F., et al. 2023, ApJ, 949, 108, doi: 10.3847/1538-4357/acc65e
-
[51]
Kroupa, P., Aarseth, S., & Hurley, J. 2001, MNRAS, 321, 699, doi: 10.1046/j.1365-8711.2001.04050.x
-
[52]
Lagos, P., Loubser, S. I., Scott, T. C., et al. 2022, MNRAS, 516, 5487, doi: 10.1093/mnras/stac2535 Jet–ISM Interactions in NGC 131645
-
[53]
Lanz, L., Jones, C., Forman, W. R., et al. 2010, ApJ, 721, 1702, doi: 10.1088/0004-637X/721/2/1702
-
[54]
K., Hughes, A., Liu, D., et al
Leroy, A. K., Hughes, A., Liu, D., et al. 2021, ApJS, 255, 19, doi: 10.3847/1538-4365/abec80
-
[55]
K., Rosolowsky, E., Usero, A., et al
Leroy, A. K., Rosolowsky, E., Usero, A., et al. 2022, ApJ, 927, 149, doi: 10.3847/1538-4357/ac3490
-
[56]
1998, A&AS, 130, 267, doi: 10.1051/aas:1998411
Chiosi, C. 1998, A&AS, 130, 267, doi: 10.1051/aas:1998411
-
[57]
M., Murgia, M., Serra, P., et al
Maccagni, F. M., Murgia, M., Serra, P., et al. 2020, A&A, 634, A9, doi: 10.1051/0004-6361/201936867
-
[58]
M., Serra, P., Gaspari, M., et al
Maccagni, F. M., Serra, P., Gaspari, M., et al. 2021, A&A, 656, A45, doi: 10.1051/0004-6361/202141143
-
[59]
2014, ARA&A, 52, 415, doi: 10.1146/annurev-astro-081811-125615
Madau, P., & Dickinson, M. 2014, ARA&A, 52, 415, doi: 10.1146/annurev-astro-081811-125615
work page internal anchor Pith review doi:10.1146/annurev-astro-081811-125615 2014
-
[60]
2019, MNRAS, 490, 1666, doi: 10.1093/mnras/stz2530
Maddox, N., Serra, P., Venhola, A., et al. 2019, MNRAS, 490, 1666, doi: 10.1093/mnras/stz2530
-
[61]
2021, MNRAS, 508, 4738, doi: 10.1093/mnras/stab2822
Mandal, A., Mukherjee, D., Federrath, C., et al. 2021, MNRAS, 508, 4738, doi: 10.1093/mnras/stab2822
-
[62]
McKee, C. F., & Cowie, L. L. 1977, ApJ, 215, 213, doi: 10.1086/155350
-
[63]
McKee, C. F., & Ostriker, J. P. 1977, ApJ, 218, 148, doi: 10.1086/155667
-
[64]
P., Waters, B., Schiebel, D., Young, W., & Golap, K
McMullin, J. P., Waters, B., Schiebel, D., Young, W., & Golap, K. 2007, in Astronomical Society of the Pacific Conference Series, Vol. 376, Astronomical Data Analysis Software and Systems XVI, ed. R. A. Shaw, F. Hill, & D. J. Bell, 127
2007
-
[65]
2024, ApJL, 965, L27, doi: 10.3847/2041-8213/ad324b
Milisavljevic, D., Temim, T., De Looze, I., et al. 2024, ApJL, 965, L27, doi: 10.3847/2041-8213/ad324b
-
[66]
2015, A&A, 580, A1, doi: 10.1051/0004-6361/201525860
Frieswijk, W., & Tadhunter, C. 2015, A&A, 580, A1, doi: 10.1051/0004-6361/201525860
work page internal anchor Pith review doi:10.1051/0004-6361/201525860 2015
-
[67]
Bernhard, E. P., & Raymond Oonk, J. B. 2021, A&A, 656, A55, doi: 10.1051/0004-6361/202141766
-
[68]
Morokuma-Matsui, K., Serra, P., Maccagni, F. M., et al. 2019, PASJ, 71, 85, doi: 10.1093/pasj/psz067
-
[69]
2022, ApJS, 263, 40, doi: 10.3847/1538-4365/ac983b
Morokuma-Matsui, K., Bekki, K., Wang, J., et al. 2022, ApJS, 263, 40, doi: 10.3847/1538-4365/ac983b
-
[70]
2025, arXiv e-prints, arXiv:2506.03888, doi: 10.48550/arXiv.2506.03888
Mukherjee, D. 2025, arXiv e-prints, arXiv:2506.03888, doi: 10.48550/arXiv.2506.03888
-
[71]
2016, MNRAS, 461, 967, doi: 10.1093/mnras/stw1368
Wagner, A. 2016, MNRAS, 461, 967, doi: 10.1093/mnras/stw1368
-
[72]
Sutherland, R. S., & Silk, J. 2018a, MNRAS, 479, 5544, doi: 10.1093/mnras/sty1776
work page internal anchor Pith review doi:10.1093/mnras/sty1776
-
[73]
Mukherjee, D., Wagner, A. Y., Bicknell, G. V., et al. 2018b, MNRAS, 476, 80, doi: 10.1093/mnras/sty067
-
[74]
2025, A&A, 694, A110, doi: 10.1051/0004-6361/202453139
Murthy, S., Morganti, R., Oosterloo, T., et al. 2025, A&A, 694, A110, doi: 10.1051/0004-6361/202453139
-
[75]
Murthy, S., Morganti, R., Wagner, A. Y., et al. 2022, Nature Astronomy, 6, 488, doi: 10.1038/s41550-021-01596-6
-
[76]
Fisher, R. T. 2006, ApJS, 164, 477, doi: 10.1086/501530
-
[77]
2020, MNRAS, 498, 2391, doi: 10.1093/mnras/staa2419
Nelson, D., Sharma, P., Pillepich, A., et al. 2020, MNRAS, 498, 2391, doi: 10.1093/mnras/staa2419
-
[78]
Nesvadba, N. P. H., Boulanger, F., Salom´ e, P., et al. 2010, A&A, 521, A65, doi: 10.1051/0004-6361/200913333
-
[79]
2008, MNRAS, 387, 1669, doi: 10.1111/j.1365-2966.2008.13360.x
Nowak, N., Saglia, R. P., Thomas, J., et al. 2008, MNRAS, 391, 1629, doi: 10.1111/j.1365-2966.2008.13960.x
-
[80]
Ogle, P. M., Lanz, L., & Appleton, P. N. 2014, ApJL, 788, L33, doi: 10.1088/2041-8205/788/2/L33
discussion (0)
Sign in with ORCID, Apple, or X to comment. Anyone can read and Pith papers without signing in.