A time-series classification framework for individual-level absenteeism prediction under severe class imbalance
Pith reviewed 2026-07-01 05:34 UTC · model grok-4.3
The pith
A TSC framework predicts future individual absences by separating historical sequences from future labels and applying LSTM-FCN with imbalance-aware losses.
A machine-rendered reading of the paper's core claim, the machinery that carries it, and where it could break.
Core claim
The central claim is that separating historical attendance sequences from future absence labels via a TSC framework, combined with LSTM-FCN architecture and imbalance losses like BFL with alpha set to 1/(1+rho) or G-Mean, enables proactive prediction with specificity 0.813 and balanced accuracy 0.888, yielding about 80% on test data.
What carries the argument
The LSTM-Fully Convolutional Network (LSTM-FCN) architecture paired with Binary Focal Loss or Geometric Mean loss, applied to separated historical time series and future labels.
Load-bearing premise
The simulated dataset calibrated to the UCI collection accurately captures the sequential behavioural structure and severe class imbalance of real individual attendance histories without introducing artifacts or data leakage.
What would settle it
Evaluating the model on actual longitudinal attendance data from a real organization and observing whether the balanced accuracy remains near 80% or drops significantly due to differences in sequence structure.
Figures


read the original abstract
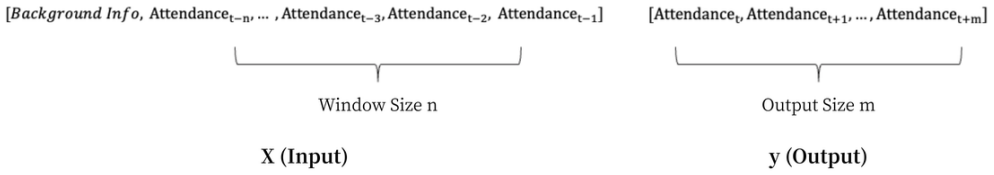
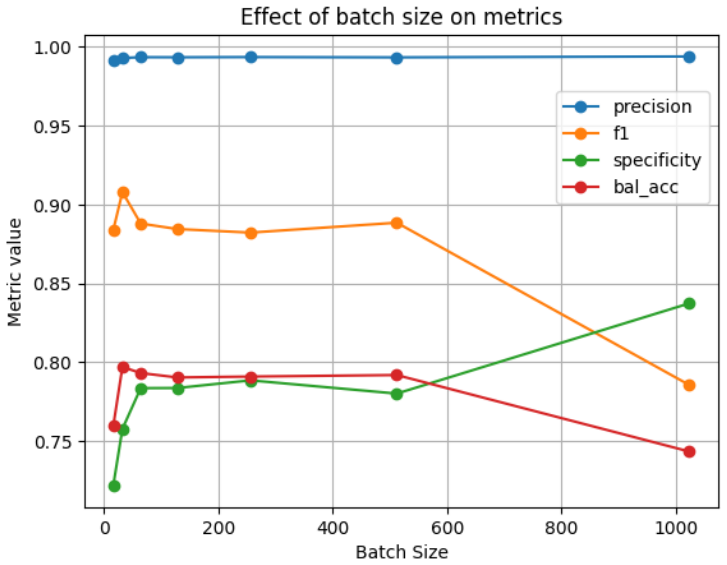
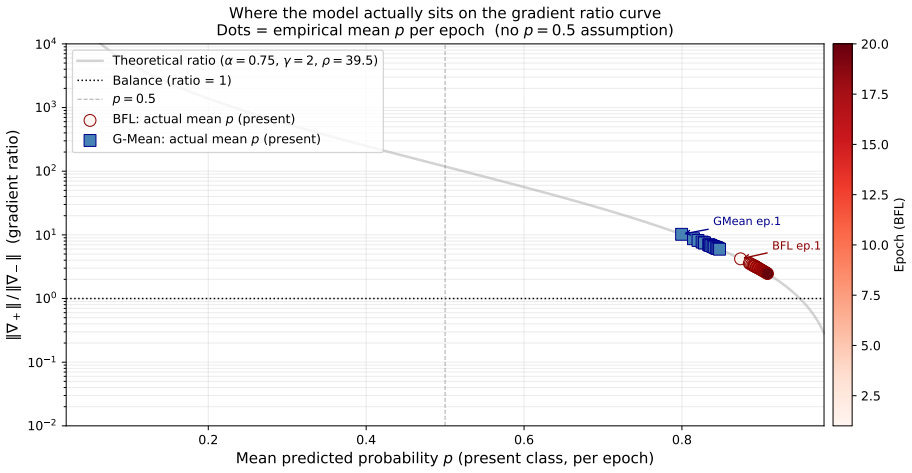
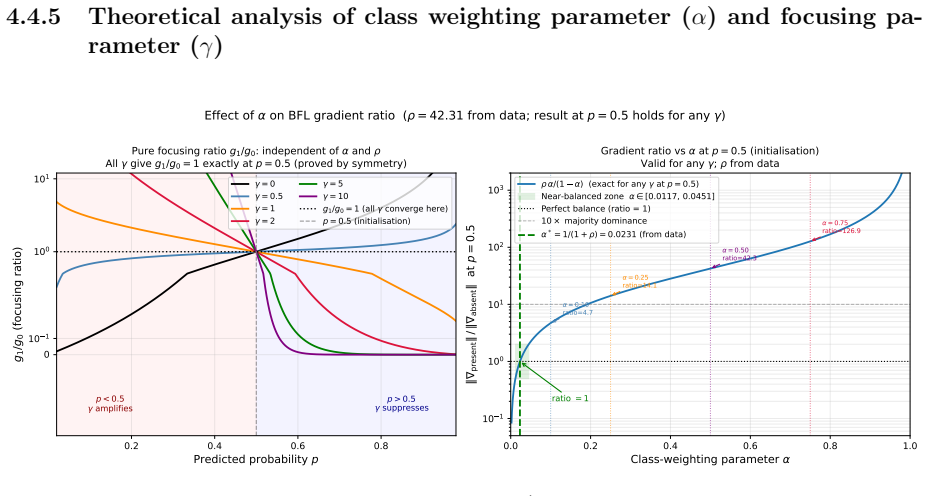
Staff absenteeism imposes substantial operational costs in high-demand work environments such as healthcare, emergency services, meat processing, construction, and courier and delivery services, where proactive workforce planning depends on reliable individual-level absence prediction. Existing regression and classification approaches share a structural limitation; they map features observed at time t to labels at the same time t, reproducing already-realised outcomes rather than predicting future events, and discard the sequential behavioural structure inherent in individual attendance histories. We propose a Time Series Classification (TSC) framework that separates historical attendance sequences from future absence labels, enabling genuinely proactive prediction. Due to the lack of public longitudinal attendance data, we construct a reproducible simulated dataset calibrated to the UCI dataset. We analyse Binary Focal Loss (BFL) and Geometric Mean (G-Mean) loss under severe class imbalance using only the imbalance ratio $\rho$. For BFL, the initial gradient ratio is $\rho\alpha/(1-\alpha)$, implying the balanced weight $\alpha = 1/(1+\rho) \approx 0.023$. Experiments show that performance is governed mainly by $\alpha$, with BFL achieving specificity 0.813 and balanced accuracy 0.888, comparable to G-Mean. Unlike BFL, G-Mean adapts automatically without parameter calibration. Among three deep learning architectures evaluated, Long Short-Term Memory (LSTM), Convolutional Neural Network (CNN), and the hybrid LSTM-Fully Convolutional Network (LSTM-FCN), the LSTM-FCN delivers strong precision and specificity. Stable performance is obtained with batch sizes >= 64 and window sizes between 40-80 days, yielding balanced accuracy of approximately 80% on held-out test data.
Editorial analysis
A structured set of objections, weighed in public.
Referee Report
Summary. The manuscript proposes a time-series classification framework for proactive individual-level absenteeism prediction that separates historical attendance sequences from future labels. It constructs a reproducible simulated dataset calibrated to the UCI Absenteeism collection, derives a balancing parameter α = 1/(1+ρ) ≈ 0.023 for Binary Focal Loss from the initial gradient ratio, compares it to Geometric Mean loss, and evaluates LSTM, CNN, and LSTM-FCN architectures under severe class imbalance, reporting specificity 0.813, balanced accuracy 0.888, and approximately 80% balanced accuracy on held-out test data with the LSTM-FCN.
Significance. If the simulation faithfully reproduces real longitudinal temporal structure without leakage, the framework would address a practical gap in proactive workforce planning for high-demand sectors. The automatic adaptation of G-Mean loss without parameter tuning and the explicit separation of history from future labels are strengths; the derivation of α directly from ρ is parameter-free in the stated sense.
major comments (2)
- [Abstract] Abstract and data-construction description: the simulation is characterized only as 'reproducible simulated dataset calibrated to the UCI dataset' without specifying whether it employs per-individual transition probabilities, higher-order Markov structure, or merely marginal ρ; this is load-bearing for the central claim because the proactive TSC performance (specificity 0.813, balanced accuracy 0.888) cannot be interpreted without evidence that temporal autocorrelation and absence clustering are preserved and that input windows contain no information about future labels.
- [Abstract] Abstract: the reported metrics (specificity 0.813, balanced accuracy 0.888, ~80% on held-out test) are stated without error bars, confidence intervals, statistical tests against baselines, or ablation details on window size and batch-size effects, making it impossible to assess whether the LSTM-FCN advantage is robust or an artifact of the particular simulated realization.
minor comments (1)
- [Abstract] Notation: ρ is introduced without an explicit definition in the abstract even though it is the sole parameter used for both losses.
Simulated Author's Rebuttal
We thank the referee for their thoughtful comments, which help improve the clarity and robustness of our manuscript. We address each major comment below and will incorporate revisions accordingly.
read point-by-point responses
-
Referee: [Abstract] Abstract and data-construction description: the simulation is characterized only as 'reproducible simulated dataset calibrated to the UCI dataset' without specifying whether it employs per-individual transition probabilities, higher-order Markov structure, or merely marginal ρ; this is load-bearing for the central claim because the proactive TSC performance (specificity 0.813, balanced accuracy 0.888) cannot be interpreted without evidence that temporal autocorrelation and absence clustering are preserved and that input windows contain no information about future labels.
Authors: We acknowledge that the abstract and data-construction description lack sufficient detail on the simulation methodology. We will revise the manuscript to explicitly describe the simulation process, specifying the use of per-individual transition probabilities derived from the UCI Absenteeism dataset. This approach preserves temporal autocorrelation and absence clustering while ensuring that input windows contain no information about future labels, as the framework separates historical attendance sequences from future absence labels. revision: yes
-
Referee: [Abstract] Abstract: the reported metrics (specificity 0.813, balanced accuracy 0.888, ~80% on held-out test) are stated without error bars, confidence intervals, statistical tests against baselines, or ablation details on window size and batch-size effects, making it impossible to assess whether the LSTM-FCN advantage is robust or an artifact of the particular simulated realization.
Authors: We agree that including measures of variability and ablation studies would enhance the assessment of robustness. In the revised manuscript, we will report standard deviations or confidence intervals from multiple experimental runs, include statistical tests comparing to baselines, and provide additional ablation results on the effects of window sizes (40-80 days) and batch sizes (>=64). This will demonstrate that the LSTM-FCN performance is stable and not an artifact of a single realization. revision: yes
Circularity Check
No significant circularity detected
full rationale
The alpha derivation for Binary Focal Loss follows directly from the standard initial gradient ratio formula using only the given imbalance ratio rho and is independent of any fitted model or test performance. G-Mean loss requires no parameter tuning. The simulated dataset is calibrated to UCI statistics but the reported metrics are measured on held-out test data under explicit temporal separation of history from future labels; no equation reduces the performance numbers to quantities defined solely by tuning on the test set. No self-citations are invoked as load-bearing uniqueness theorems or ansatzes. The central claims rest on empirical evaluation rather than self-referential definitions or fitted-input predictions.
Axiom & Free-Parameter Ledger
free parameters (1)
- alpha =
1/(1+rho) approx 0.023
axioms (1)
- domain assumption The simulated dataset calibrated to the UCI collection accurately captures sequential behavioural structure and class imbalance of real attendance histories.
Reference graph
Works this paper leans on
-
[1]
Dalia Alzu’bi et al. “Classification model for reducing absenteeism of nurses at hos- pitals using machine learning and artificial neural network techniques”. In:Interna- tional Journal of System Assurance Engineering and Management15.7 (July 2024), pp. 3266–3278.issn: 0976-4348.doi:10.1007/s13198-024-02334-7.url:https: //doi.org/10.1007/s13198-024-02334-7
-
[2]
Zahid B Asghar et al. “Trends, variations and prediction of staff sickness absence rates among NHS ambulance services in England: a time series study”. In:BMJ Open11.9 (2021).issn: 2044-6055.doi:10.1136/bmjopen- 2021- 053885. eprint: https : / / bmjopen . bmj . com / content / 11 / 9 / e053885 . full . pdf.url:https : //bmjopen.bmj.com/content/11/9/e053885
-
[3]
Anthony Bagnall et al.The Great Time Series Classification Bake Off: An Experi- mental Evaluation of Recently Proposed Algorithms. Extended Version. 2016. arXiv: 1602.01711 [cs.LG].url:https://arxiv.org/abs/1602.01711
work page internal anchor Pith review Pith/arXiv arXiv 2016
-
[4]
Psychosocial work stress and occupational stres- sors in emergency medical services
Rupkatha Bardhan and Traci Byrd. “Psychosocial work stress and occupational stres- sors in emergency medical services”. In:Healthcare. Vol. 11. 7. MDPI. 2023, p. 976
2023
-
[5]
Bishop.Pattern Recognition and Machine Learning
Christopher M. Bishop.Pattern Recognition and Machine Learning. Information Sci- ence and Statistics. New York: Springer, 2006
2006
- [6]
-
[7]
A deep learning approach for intrusion detection in Internet of Things using focal loss function
Ayesha S. Dina, A.B. Siddique, and D. Manivannan. “A deep learning approach for intrusion detection in Internet of Things using focal loss function”. In:Internet of Things22 (2023), p. 100699.issn: 2542-6605.doi:https://doi.org/10.1016/ j.iot.2023.100699.url:https://www.sciencedirect.com/science/article/ pii/S2542660523000227
-
[8]
Stress, fear, and anxiety among construction workers: a systematic review
Carlos Gomez-Salgado et al. “Stress, fear, and anxiety among construction workers: a systematic review”. In:Frontiers in Public Health11 (2023), p. 1226914. 32
2023
-
[9]
Priya Goyal et al.Accurate, Large Minibatch SGD: Training ImageNet in 1 Hour
-
[10]
arXiv:1706.02677 [cs.CV].url:https://arxiv.org/abs/1706.02677
work page internal anchor Pith review Pith/arXiv arXiv
-
[11]
Semi-Supervised Bayesian GANs with Log-Signatures for Uncertainty- Aware Credit Card Fraud Detection
David Hirnschall. “Semi-Supervised Bayesian GANs with Log-Signatures for Uncertainty- Aware Credit Card Fraud Detection”. In:Mathematics13.19 (2025).issn: 2227-7390. doi:10.3390/math13193229.url:https://www.mdpi.com/2227- 7390/13/19/ 3229
work page doi:10.3390/math13193229.url:https://www.mdpi.com/2227- 2025
-
[12]
Deep learning for time series classification: a review
Hassan Ismail Fawaz et al. “Deep learning for time series classification: a review”. In: Data Mining and Knowledge Discovery33.4 (July 2019), pp. 917–963.issn: 1573- 756X.doi:10.1007/s10618- 019- 00619- 1.url:https://doi.org/10.1007/ s10618-019-00619-1
-
[13]
InceptionTime: Finding AlexNet for time series classi- fication
Hassan Ismail Fawaz et al. “InceptionTime: Finding AlexNet for time series classi- fication”. In:Data Mining and Knowledge Discovery34.6 (Sept. 2020), 1936–1962. issn: 1573-756X.doi:10.1007/s10618-020-00710-y.url:http://dx.doi.org/ 10.1007/s10618-020-00710-y
work page doi:10.1007/s10618-020-00710-y.url:http://dx.doi.org/ 2020
-
[14]
Somchat Jiriwibhakorn and Shazia Kanwal. “Time Series-Based Fault Detection and Classification in IEEE 9-Bus Transmission Lines Using Deep Learning”. In:IEEE Access13 (2025), pp. 118135–118146.doi:10.1109/ACCESS.2025.3586045
-
[15]
LSTM Fully Convolutional Networks for Time Series Classifi- cation
Fazle Karim et al. “LSTM Fully Convolutional Networks for Time Series Classifi- cation”. In:IEEE Access6 (2018), pp. 1662–1669.doi:10 . 1109 / ACCESS . 2017 . 2779939
2018
-
[16]
Multivariate LSTM-FCNs for time series classification
Fazle Karim et al. “Multivariate LSTM-FCNs for time series classification”. In:Neu- ral Networks116 (2019), pp. 237–245.issn: 0893-6080.doi:https://doi.org/10. 1016/j.neunet.2019.04.014.url:https://www.sciencedirect.com/science/ article/pii/S0893608019301200
2019
-
[17]
The effects of emergency medical service work on the psycho- logical, physical, and social well-being of ambulance personnel: a systematic review of qualitative research
Sharon Lawn et al. “The effects of emergency medical service work on the psycho- logical, physical, and social well-being of ambulance personnel: a systematic review of qualitative research”. In:BMC psychiatry20.1 (2020), p. 348
2020
-
[18]
Focal loss for dense object detection
Tsung-Yi Lin et al. “Focal loss for dense object detection”. In:Proceedings of the IEEE international conference on computer vision. 2017, pp. 2980–2988
2017
-
[19]
Lindell, Marcus and Schwerin, Casper.Processing, Modeling, and Forecasting: A Time Series Analysis of Sick Leave Absences in Sweden and Evaluating the Impact of Macro Factors. eng. Student Paper. 2023
2023
-
[20]
Predicting workplace absenteeism using machine learning: a pilot study in occupational health
Pablo Llamas Bl´ azquez. “Predicting workplace absenteeism using machine learning: a pilot study in occupational health”. In:Journal of Occupational Medicine and Toxicology20.1 (2025), p. 38.doi:10.1186/s12995-025-00482-5
-
[21]
Ida Lumintu and Achmad Maududie. “Supporting Sustainable Workforce Manage- ment for Worker Illness Absence Through Predictive Analytics”. In:Engineering Proceedings84.1 (2025).issn: 2673-4591.doi:10.3390/engproc2025084017.url: https://www.mdpi.com/2673-4591/84/1/17. 33
-
[22]
How should clinicians respond to patients experiencing ongoing present traumatic stress of industrial meat production?
Rachel MacNair. “How should clinicians respond to patients experiencing ongoing present traumatic stress of industrial meat production?” In:AMA Journal of Ethics 25.4 (2023), pp. 251–255
2023
-
[23]
UCI Machine Learn- ing Repository
Andrea Martiniano and Ricardo Ferreira.Absenteeism at work. UCI Machine Learn- ing Repository. DOI: https://doi.org/10.24432/C5X882. 2012
-
[24]
Gopal Nath et al. “Incorporating a Machine Learning Model into a Web-Based Ad- ministrative Decision Support Tool for Predicting Workplace Absenteeism”. In:In- formation13.7 (2022).issn: 2078-2489.doi:10.3390/info13070320.url:https: //www.mdpi.com/2078-2489/13/7/320
-
[25]
Predicting health-related absenteeism with machine learning: A case study
Aleksander Piciga and Matjaˇ z Kukar. “Predicting health-related absenteeism with machine learning: A case study”. In: (2024)
2024
-
[26]
Maria Valentina Popa et al. “An Integrated AI Framework for Occupational Health: Predicting Burnout, Long COVID, and Extended Sick Leave in Healthcare Workers”. In:Healthcare13.18 (2025).issn: 2227-9032.doi:10.3390/healthcare13182266. url:https://www.mdpi.com/2227-9032/13/18/2266
-
[27]
Towards effective classification of imbalanced data with convolutional neural networks
Vidwath Raj, Sven Magg, and Stefan Wermter. “Towards effective classification of imbalanced data with convolutional neural networks”. In:Artificial Neural Networks in Pattern Recognition. Springer. 2016, pp. 150–162
2016
-
[28]
An explicit formula for the A-polynomial of twist knots
Mayakkannan Raman, Narentheren Kaliappen, and Choo Ling Suan. “A Study on Machine Learning Classifier Models in Analyzing Discipline of Individuals Based on Various Reasons Absenteeism from Work”. In:2020 International Conference on Decision Aid Sciences and Application (DASA). 2020, pp. 360–364.doi:10.1109/ DASA51403.2020.9317017
work page internal anchor Pith review Pith/arXiv arXiv 2020
-
[29]
The psychological impact of slaughterhouse em- ployment: A systematic literature review
Jessica Slade and Emma Alleyne. “The psychological impact of slaughterhouse em- ployment: A systematic literature review”. In:Trauma, Violence, & Abuse24.2 (2023), pp. 429–440
2023
-
[30]
Don't Decay the Learning Rate, Increase the Batch Size
Samuel L. Smith et al.Don’t Decay the Learning Rate, Increase the Batch Size. 2018. arXiv:1711.00489 [cs.LG].url:https://arxiv.org/abs/1711.00489
work page internal anchor Pith review Pith/arXiv arXiv 2018
-
[31]
A Deep Convolutional Neural Network for Time Series Classification with Intermediate Targets
Aboozar Taherkhani, Georgina Cosma, and T. M. McGinnity. “A Deep Convolutional Neural Network for Time Series Classification with Intermediate Targets”. In:SN Computer Science4.6 (Oct. 2023), p. 832.issn: 2661-8907.doi:10.1007/s42979- 023-02159-4.url:https://doi.org/10.1007/s42979-023-02159-4
-
[32]
Time series activity classifica- tion using gated recurrent units
Yi-Fei Tan, Xiaoning Guo, and Soon-Chang Poh. “Time series activity classifica- tion using gated recurrent units”. In:International Journal of Electrical and Com- puter Engineering (IJECE)11 (Aug. 2021), p. 3551.doi:10.11591/ijece.v11i4. pp3551-3558
-
[33]
Predictive analysis of absen- teeism in MNCs using machine learning algorithm
Krittika Tewari, Shriya Vandita, and Shruti Jain. “Predictive analysis of absen- teeism in MNCs using machine learning algorithm”. In:Proceedings of ICRIC 2019. Springer. 2020, pp. 3–14.doi:10.1007/978-3-030-29407-6_1. 34
-
[34]
Predicting Absenteeism at Work Using Tree-Based Learners
Zaman Wahid et al. “Predicting Absenteeism at Work Using Tree-Based Learners”. In:Proceedings of the 3rd International Conference on Machine Learning and Soft Computing. ICMLSC ’19. Association for Computing Machinery, 2019, 7–11.isbn: 9781450366120.doi:10 . 1145 / 3310986 . 3310994.url:https : / / doi . org / 10 . 1145/3310986.3310994
-
[35]
Time series classification from scratch with deep neural networks: A strong baseline
Zhiguang Wang, Weizhong Yan, and Tim Oates. “Time series classification from scratch with deep neural networks: A strong baseline”. In: May 2017, pp. 1578–1585. doi:10.1109/IJCNN.2017.7966039
-
[36]
Md Doulotuzzaman Xames. “Toward a socially sustainable workforce in service op- erations: Predicting employee burnout with ensemble machine learning”. In:Sustain- able Manufacturing and Service Economics4 (2025), p. 100033.doi:10.1016/j. smse.2025.100033
work page doi:10.1016/j 2025
-
[37]
Prototype Learning for Medical Time Series Classification via Hu- man–Machine Collaboration
Jia Xie et al. “Prototype Learning for Medical Time Series Classification via Hu- man–Machine Collaboration”. In:Sensors24.8 (2024).issn: 1424-8220.doi:10 . 3390/s24082655.url:https://www.mdpi.com/1424-8220/24/8/2655
2024
-
[38]
A Transformer-based Framework for Multivariate Time Series Representation Learning
George Zerveas et al. “A Transformer-based Framework for Multivariate Time Series Representation Learning”. In:Proceedings of the 27th ACM SIGKDD Conference on Knowledge Discovery & Data Mining. KDD ’21. Association for Computing Machin- ery, 2021, 2114–2124.isbn: 9781450383325.doi:10.1145/3447548.3467401.url: https://doi.org/10.1145/3447548.3467401
-
[39]
B la˙ zej Lyszczarz and Jakub Wojtasik. “Excess and reduced work absence during COVID-19 in Poland: insights from cause-specific time-series models”. In:Population Health Metrics23.1 (July 2025), p. 35.issn: 1478-7954.doi:10.1186/s12963-025- 00400-1.url:https://doi.org/10.1186/s12963-025-00400-1. 35
discussion (0)
Sign in with ORCID, Apple, or X to comment. Anyone can read and Pith papers without signing in.