Modeling and Chasing the Energy-Efficiency Sweet Spots in Modern GPUs
Pith reviewed 2026-07-02 06:21 UTC · model grok-4.3
The pith
An analytical model decomposes GPU power into linear and nonlinear components to identify workload-specific transition frequencies where energy efficiency degrades.
A machine-rendered reading of the paper's core claim, the machinery that carries it, and where it could break.
Core claim
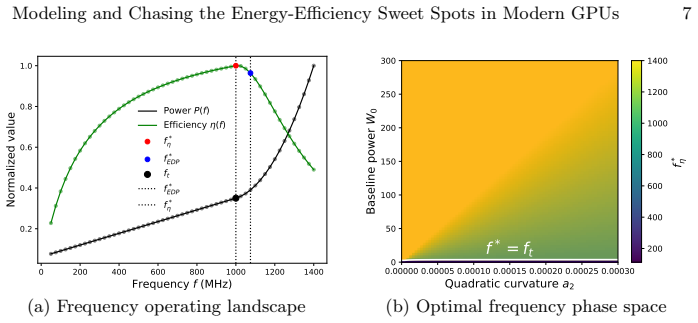
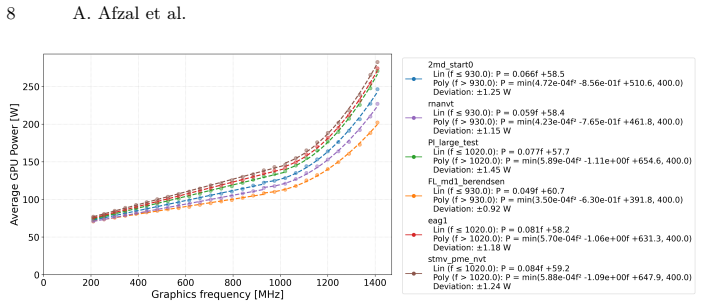
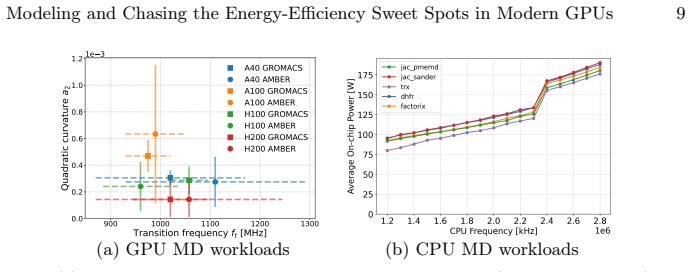
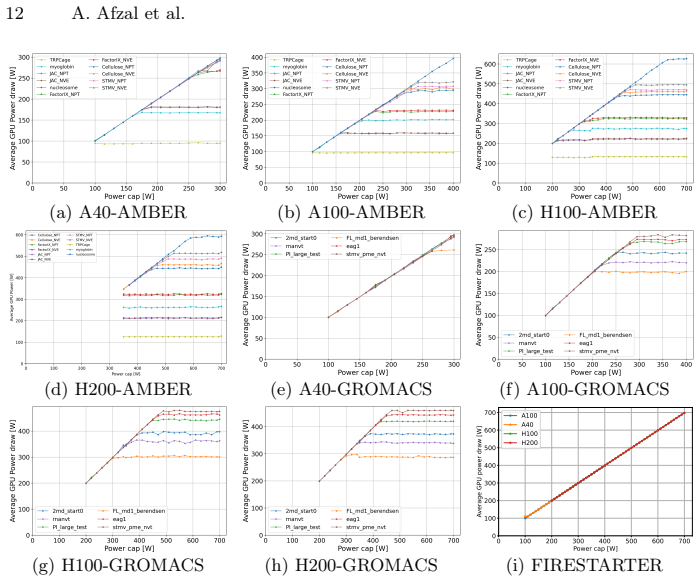
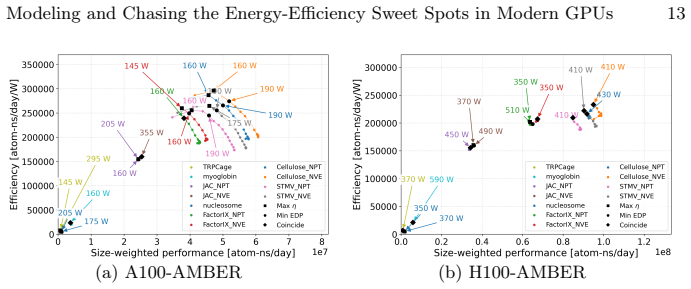
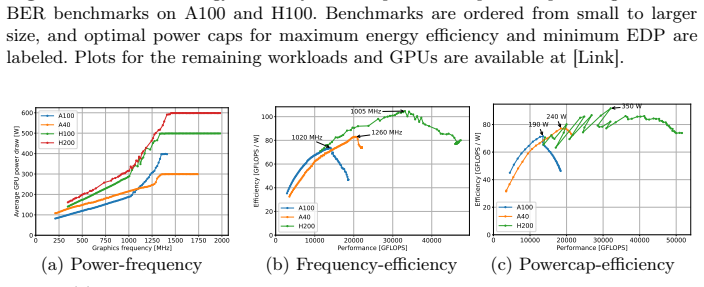
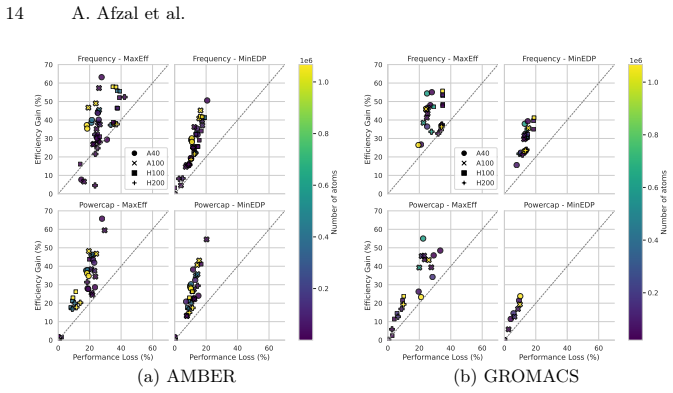
GPU power can be expressed as the sum of a linear term and a nonlinear term; the point at which the nonlinear term begins to dominate defines a transition frequency beyond which energy-to-solution worsens. This transition frequency, together with baseline power and the strength of the nonlinear term, are the three dominant parameters that govern efficiency. The decomposition reproduces empirical measurements on A40, A100, H100 and H200 GPUs across GROMACS, AMBER and FIRESTARTER workloads with low residual error. Power capping proves less effective than frequency reduction for moving workloads into the efficient regime, particularly when they operate far from thermal design power.
What carries the argument
Analytical decomposition of GPU power into linear and nonlinear components that isolates a workload- and architecture-dependent transition frequency.
If this is right
- Energy-to-solution curves exhibit distinct efficient and inefficient regimes whose boundary shifts with both workload and GPU generation.
- Baseline power, the coefficient of the nonlinear term, and the transition frequency together determine the location of the energy-efficiency sweet spot.
- Frequency reduction moves a workload into the efficient regime more reliably than power capping when the workload stays below thermal design power.
- The fitted parameters supply explicit numerical guidance for choosing operating frequencies on the four tested GPU architectures.
Where Pith is reading between the lines
- The same decomposition could be applied to other accelerators whose power curves show similar nonlinear scaling.
- Runtime systems could use online estimates of the transition frequency to adjust clocks dynamically without exhaustive search.
- Hardware designers might target reductions in the nonlinear power term to enlarge the efficient operating window on future GPUs.
- The model supplies a quantitative way to compare efficiency headroom across successive GPU generations under identical workloads.
Load-bearing premise
The nonlinear power-frequency behavior observed on the tested GPUs and workloads produces clear regime transitions that a simple linear-plus-nonlinear split can capture across systems.
What would settle it
Measure power and energy-to-solution on a previously untested GPU or workload, fit the same linear-plus-nonlinear model, and check whether the predicted transition frequency still aligns with the measured efficiency drop within the reported error bounds.
Figures

read the original abstract
Energy consumption is a key limitation in high-performance computing on heterogeneous CPU-GPU systems. This work studies how hardware configuration affects energy-to-solution under realistic workloads. We study energy efficiency regimes using molecular dynamics benchmarks (GROMACS and AMBER) and a stress-test benchmark (FIRESTARTER) on systems with A40, A100, H100, and H200 GPUs and Intel Ice Lake CPU, varying frequency scaling and power cap. We show that energy-to-solution exhibits workload- and architecture-dependent transitions between efficient and inefficient regimes, driven by nonlinear GPU power-frequency scaling. We introduce an interpretable analytical model that decomposes GPU power into linear and nonlinear components, identifying a workload- and architecture-dependent transition frequency beyond which efficiency degrades. The model fits empirical data with low error and highlights the role of baseline power, nonlinear power behavior, and transition frequency as the dominant parameters governing energy efficiency. Power capping is generally less effective for efficiency tuning than frequency reduction, especially for workloads that operate far from thermal design power. Overall, energy-efficient HPC execution is a configuration-dependent problem with identifiable regime shifts, and we provide model-driven guidance for selecting operating points.
Editorial analysis
A structured set of objections, weighed in public.
Referee Report
Summary. The manuscript introduces an interpretable analytical model decomposing GPU power into linear and nonlinear components to identify workload- and architecture-dependent transition frequencies beyond which energy efficiency degrades. Experiments use GROMACS, AMBER, and FIRESTARTER benchmarks on A40/A100/H100/H200 GPUs with frequency scaling and power caps, claiming the model fits empirical data with low error and that frequency reduction outperforms power capping for efficiency tuning, with baseline power, nonlinear coefficients, and transition frequency as dominant parameters.
Significance. If the fitting procedure and regime identification are rigorously validated, the work offers practical, model-driven guidance for energy-efficient configuration of modern GPUs in HPC, addressing a timely concern. The multi-architecture empirical coverage is a clear strength, as is the emphasis on an interpretable decomposition rather than black-box fitting. The absence of derivation steps, error analysis, and independent validation in the current form limits immediate applicability and generalizability.
major comments (3)
- [§3] §3 (model definition): The linear-plus-nonlinear decomposition and transition frequency identification lack any derivation steps, justification for the functional form, or explicit equations showing how coefficients are obtained from data; this is load-bearing for the central claim that the model is interpretable and identifies dominant parameters.
- [§4] §4 (results): The claim of fitting empirical data with low error supplies no error metrics, error bars, data exclusion rules, or validation procedure (e.g., cross-validation or hold-out sets), making it impossible to assess whether the reported fit supports the regime-transition conclusions.
- [§4.2] §4.2 and §5: Transition frequency and nonlinear coefficients appear determined from the same empirical runs used to demonstrate the efficient/inefficient regimes, with no independent derivation, external benchmark, or sensitivity analysis to address potential circularity.
minor comments (2)
- [Figures 3-5] Figure captions and axis labels should explicitly state units and scaling for frequency and power measurements to improve reproducibility.
- [Introduction] The manuscript would benefit from citing additional recent GPU power modeling literature for context on the novelty of the linear/nonlinear split.
Simulated Author's Rebuttal
We thank the referee for the constructive and detailed comments. The feedback identifies key areas where additional rigor in model derivation, quantitative validation, and addressing potential circularity will improve the manuscript. We respond to each major comment below and commit to revisions that strengthen the presentation without altering the core claims or experimental scope.
read point-by-point responses
-
Referee: [§3] §3 (model definition): The linear-plus-nonlinear decomposition and transition frequency identification lack any derivation steps, justification for the functional form, or explicit equations showing how coefficients are obtained from data; this is load-bearing for the central claim that the model is interpretable and identifies dominant parameters.
Authors: We acknowledge that the submitted manuscript presents the model form without explicit derivation steps or the fitting equations. The decomposition is motivated by the characteristic shape of measured GPU power-frequency curves (linear regime at moderate frequencies transitioning to superlinear due to voltage scaling), consistent with prior literature on GPU power modeling. In the revision we will add to §3: (i) a brief derivation showing how the transition frequency is obtained as the frequency at which the nonlinear term's contribution to total power exceeds a defined threshold, (ii) justification of the functional form by reference to established dynamic and static power components, and (iii) the explicit least-squares procedure used to obtain the baseline power, linear coefficient, and nonlinear coefficient from the measured data. revision: yes
-
Referee: [§4] §4 (results): The claim of fitting empirical data with low error supplies no error metrics, error bars, data exclusion rules, or validation procedure (e.g., cross-validation or hold-out sets), making it impossible to assess whether the reported fit supports the regime-transition conclusions.
Authors: The current text describes fit quality only qualitatively. We agree this is insufficient. The revised §4 will report quantitative metrics (RMSE and R² for each GPU–workload pair), include error bars derived from repeated measurements, document data exclusion rules (runs exhibiting thermal throttling or measurement variance above a threshold), and describe a hold-out validation procedure in which a subset of frequency points is withheld during fitting and then used to verify regime-transition predictions. revision: yes
-
Referee: [§4.2] §4.2 and §5: Transition frequency and nonlinear coefficients appear determined from the same empirical runs used to demonstrate the efficient/inefficient regimes, with no independent derivation, external benchmark, or sensitivity analysis to address potential circularity.
Authors: The transition frequency and coefficients are obtained by fitting the model to the power-frequency measurements from the same experimental campaign used to illustrate the efficiency regimes; this is an inherent aspect of an empirical modeling study. To address circularity concerns we will add, in the revision, a sensitivity analysis that perturbs the nonlinear coefficient within its observed range across architectures and shows the resulting variation in identified transition frequency and efficiency conclusions. We will also supply a physical interpretation of the transition frequency grounded in GPU voltage-frequency behavior that does not rely on the specific benchmark data. Independent external benchmarks are not present in the current dataset; the multi-architecture, multi-workload consistency serves as the primary robustness check. revision: partial
Circularity Check
No significant circularity identified
full rationale
The paper proposes an analytical decomposition of GPU power into linear and nonlinear components, fits the resulting model to empirical benchmark data on multiple GPU architectures, and reports low fitting error while highlighting fitted parameters such as transition frequency. This constitutes standard empirical modeling and validation rather than any derivation that reduces to its own inputs by construction. No equations, self-citations, uniqueness theorems, or renamings are present in the supplied text that would trigger the enumerated circularity patterns. The central claim remains self-contained against the external benchmark runs.
Axiom & Free-Parameter Ledger
free parameters (3)
- transition frequency
- baseline power
- nonlinear power coefficients
axioms (1)
- domain assumption GPU power consumption can be usefully decomposed into a constant baseline plus a nonlinear frequency-dependent term
Reference graph
Works this paper leans on
-
[1]
Abraham, M.J., Murtola, T., Schulz, R., Páll, S., Smith, J.C., Hess, B., Lin- dahl, E.: GROMACS: High performance molecular simulations through multi- level parallelism from laptops to supercomputers. SoftwareX1-2, 19–25 (2015). https://doi.org/10.1016/j.softx.2015.06.001
-
[2]
Afzal, A.: The cost of computation: Metrics and models for modern multicore- based systems in scientific computing. Master’s thesis, Department Informatik, Friedrich Alexander Universität Erlangen-Nürnberg (2015).https://doi.org/10. 13140/RG.2.2.35954.25283
-
[3]
Afzal, A., Hager, G., Wellein, G.: SPEChpc 2021 Benchmarks on Ice Lake and Sap- phire Rapids Infiniband Clusters: A Performance and Energy Case Study. In: 14th IEEE/ACM Performance Modeling, Benchmarking and Simulation of High Perfor- mance Computer Systems (PMBS) (2023).https://doi.org/10.1145/3624062. 3624197
-
[4]
Afzal, A., Hager, G., Wellein, G.: Analytic Roofline Modeling and Energy Analysis of LULESH Proxy Application on Multi-Core Clusters. International Journal of High Performance Computing Applications (IJHPCA) (2025).https://doi.org/ 10.1177/10943420251363711
-
[5]
Afzal, A., Hager, G., Wellein, G.: Wattlytics: An Interactive Web Platform for Smarter Energy Decisions (2026).https://doi.org/10.48550/arXiv.2604.08182
work page internal anchor Pith review Pith/arXiv arXiv doi:10.48550/arxiv.2604.08182 2026
-
[6]
Afzal, A., Kahler, A., Hager, G., Wellein, G.: GROMACS Unplugged: How Power Capping and Frequency Shapes Performance on GPUs. Euro-Par 2025: Parallel Processing Workshops Volume in the Springer Lecture Notes in Computer Science (LNCS) series (2025).https://doi.org/10.48550/arXiv.2412.08792 16 A. Afzal et al
-
[7]
Journal of computational chemistry26(16), 1668–1688 (2005)
Case, D.A., Cheatham III, T.E., Darden, T., Gohlke, H., Luo, R., Merz Jr, K.M., Onufriev, A., Simmerling, C., Wang, B., Woods, R.J.: The amber biomolecular sim- ulation programs. Journal of computational chemistry26(16), 1668–1688 (2005). https://doi.org/10.1002/jcc.20290
-
[8]
In: 2013 International Green Computing Confer- ence Proceedings
Hackenberg, D., Oldenburg, R., Molka, D., Schöne, R.: Introducing firestarter: A processor stress test utility. In: 2013 International Green Computing Confer- ence Proceedings. pp. 1–9. IEEE (2013).https://doi.org/10.1109/IGCC.2013. 6604507
-
[9]
Concurrency and Computation: Practice and Experience28(2), 189–210 (2016).https://doi
Hager, G., Treibig, J., Habich, J., Wellein, G.: Exploring performance and power properties of modern multi-core chips via simple machine models. Concurrency and Computation: Practice and Experience28(2), 189–210 (2016).https://doi. org/https://doi.org/10.1002/cpe.3180
-
[10]
In: ICC 2025-IEEE International Conference on Communications
Han, Y., Nan, Z., Zhou, S., Niu, Z.: Dvfs-aware dnn inference on gpus: Latency modeling and performance analysis. In: ICC 2025-IEEE International Conference on Communications. pp. 1274–1279. IEEE (2025).https://doi.org/10.1109/ ICC52391.2025.11161883
-
[11]
In: IEEE InternationalElectron Devices Meeting,
Horowitz, M., Alon, E., Patil, D., Naffziger, S., Kumar, R., Bernstein, K.: Scaling, power, and the future of cmos. In: IEEE InternationalElectron Devices Meeting,
- [12]
-
[13]
In: Wyrzykowski, R., Deelman, E., Dongarra, J., Karczewski, K
Krzywaniak, A., Czarnul, P.: Performance/energy aware optimization of parallel applications on gpus under power capping. In: Wyrzykowski, R., Deelman, E., Dongarra, J., Karczewski, K. (eds.) Parallel Processing and Applied Mathematics. pp. 123–133. Springer International Publishing, Cham (2020).https://doi.org/ 10.1007/978-3-030-43222-5_11
-
[14]
ACM SIGARCH computer architecture news41(3), 487–498 (2013).https://doi.org/ 10.1145/2485922.2485964
Leng, J., Hetherington, T., ElTantawy, A., Gilani, S., Kim, N.S., Aamodt, T.M., Reddi, V.J.: GPUWattch: Enabling energy optimizations in GPGPUs. ACM SIGARCH computer architecture news41(3), 487–498 (2013).https://doi.org/ 10.1145/2485922.2485964
-
[15]
In: Proceedings of the 42nd Annual IEEE/ACM Interna- tional Symposium on Microarchitecture
Li, S., Ahn, J.H., Strong, R.D., Brockman, J.B., Tullsen, D.M., Jouppi, N.P.: Mc- pat: an integrated power, area, and timing modeling framework for multicore and manycore architectures. In: Proceedings of the 42nd Annual IEEE/ACM Interna- tional Symposium on Microarchitecture. p. 469–480. MICRO 42, Association for Computing Machinery, New York, NY, USA (2...
-
[16]
Weste, N.H., Harris, D.: CMOS VLSI design: a circuits and sys- tems perspective. Addison-Wesley Publishing Company, United States (2015),https://www.pearson.com/en-us/subject-catalog/p/ cmos-vlsi-design-a-circuits-and-systems-perspective/P200000003427/ 9780137981076
2015
discussion (0)
Sign in with ORCID, Apple, or X to comment. Anyone can read and Pith papers without signing in.