Recognition: unknown
Wattlytics: A Web Platform for Co-Optimizing Performance, Energy, and TCO in HPC Clusters
Pith reviewed 2026-05-10 16:48 UTC · model grok-4.3
The pith
Energy-efficient GPUs can outperform higher-performance alternatives in cost-effectiveness under budget or energy constraints in HPC clusters.
A machine-rendered reading of the paper's core claim, the machinery that carries it, and where it could break.
Core claim
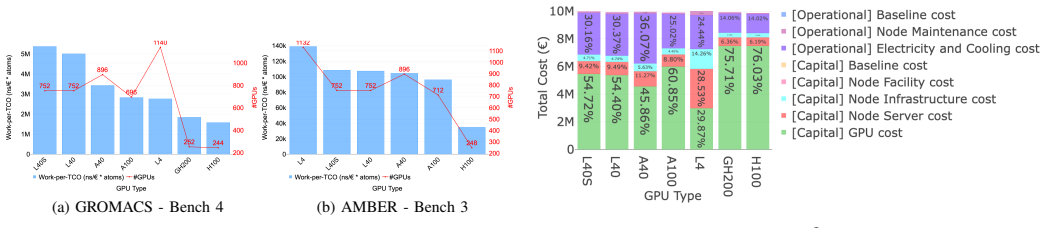
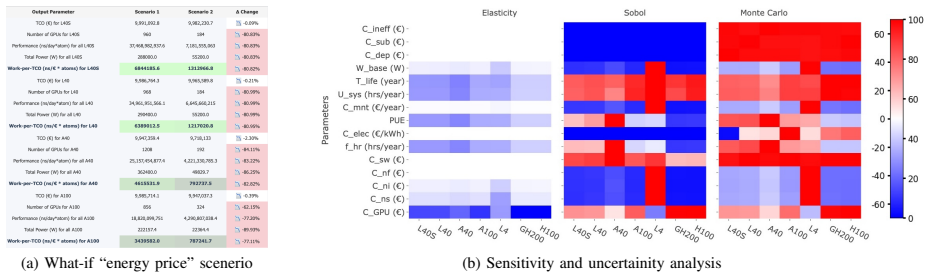
Wattlytics integrates benchmark-driven GPU performance scaling, DVFS-aware piecewise power modeling, and multi-year TCO analysis within one interactive environment. It computes metrics including TCO breakdown, work-per-TCO, power-per-TCO, and work-per-watt-per-TCO, while supporting sensitivity analysis through elasticity, Sobol indices, and Monte Carlo methods. Case studies across fixed-budget, fixed-GPU-count, fixed-performance, and fixed-power modes show that optimally deployed energy-efficient GPUs can outperform higher-performance alternatives in overall cost-effectiveness.
What carries the argument
The Wattlytics web platform, which merges benchmark performance data, frequency-sensitive power models, and lifetime cost metrics to enable exploration of heterogeneous GPU cluster designs under constraints.
Load-bearing premise
The benchmark-driven performance scaling and DVFS-aware piecewise power models accurately predict real-world behavior for the selected scientific workloads across the listed GPU architectures under varying frequency settings.
What would settle it
Direct measurements of performance and power draw for workloads such as GROMACS and AMBER on GPUs like H100 and L40S at multiple frequency settings, compared to the platform's model outputs; significant mismatches would show the predictions do not hold.
Figures


read the original abstract
The escalating computational demands and energy footprint of GPU-accelerated computing systems complicate informed design and operational decisions. We present the first release of Wattlytics (https://wattlytics.netlify.app), an interactive, browser-based decision-support system. Unlike existing procurement-oriented calculators, Wattlytics uniquely integrates benchmark-driven GPU performance scaling, dynamic voltage and frequency scaling (DVFS)-aware piecewise power modeling, and multi-year total cost of ownership (TCO) analysis within a single interactive environment. Users can configure heterogeneous systems across contemporary GPU architectures (GH200, H100, L40S, L40, A40, A100, and L4), select representative scientific workloads (e.g., GROMACS, AMBER), and explore deployment scenarios under constraints such as energy prices, system lifetime, and frequency scaling. Wattlytics computes multidimensional decision metrics (TCO breakdown, work-per-TCO, power-per-TCO, and work-per-watt-per-TCO) and supports design-space exploration, what-if scenarios, sensitivity metrics (elasticity, Sobol indices, Monte Carlo) and collaborative features to guide realistic cluster design and procurement under uncertainty. We demonstrate selected scenarios comparing deployment strategies under different operational modes: ixed budget, fixed GPU count, fixed performance, and fixed power. Our case studies show that, under budget or energy constraints, optimally deployed energy-efficient GPUs can outperform higher-performance alternatives in overall cost-effectiveness. Wattlytics helps users explore the design parameter space and distinguish between cost- and risk-driving factors, turning HPC design into a well-informed and explainable decision-making process.
Editorial analysis
A structured set of objections, weighed in public.
Referee Report
Summary. The paper introduces Wattlytics, a browser-based interactive platform that integrates benchmark-driven GPU performance scaling models, DVFS-aware piecewise power models, and multi-year TCO calculations for heterogeneous HPC clusters. Users can configure systems with GPUs such as GH200, H100, L40S, A100, and L4, select workloads including GROMACS and AMBER, and explore scenarios under fixed-budget, fixed-power, or fixed-performance constraints. The platform outputs multidimensional metrics (TCO breakdown, work-per-TCO, power-per-TCO) plus sensitivity analyses (elasticity, Sobol indices, Monte Carlo). Case studies illustrate that, under budget or energy constraints, optimally deployed energy-efficient GPUs can outperform higher-performance alternatives in cost-effectiveness.
Significance. If the underlying performance scaling and power models are shown to be accurate, Wattlytics offers a genuinely useful, accessible decision-support tool that goes beyond static procurement calculators by enabling what-if exploration, uncertainty quantification, and collaborative analysis. The emphasis on explainable, multi-objective metrics addresses a real gap in HPC design workflows.
major comments (2)
- [Case Studies] Case Studies section: the headline finding that energy-efficient GPUs outperform higher-performance alternatives under budget/energy constraints is produced by feeding benchmark-derived scaling curves and frequency-dependent power models into the TCO engine, yet the manuscript supplies no validation against hardware counters, no error bars on predicted performance or power, and no sensitivity of the ranking conclusions to plausible model error. This directly undermines the reliability of the reported multidimensional metrics and deployment recommendations.
- [Model description] Model description (performance scaling and DVFS piecewise power models): the abstract and case-study narrative treat these as accurate predictors for the listed workloads across GH200/H100/L40S/etc. at non-default frequencies, but no cross-validation, residual analysis, or comparison to measured data is reported. Because the central claim rests on these models, the absence of quantitative accuracy assessment is load-bearing.
minor comments (2)
- [Introduction] The platform URL is given but no permanent archive (e.g., Zenodo snapshot of the deployed code and data) is referenced, which would improve reproducibility of the interactive demonstrations.
- [Methods] Notation for the piecewise power model and the exact functional form of the performance scaling curves should be stated explicitly (equations or pseudocode) rather than described only at a high level.
Simulated Author's Rebuttal
We thank the referee for the constructive comments highlighting the need for explicit model validation and sensitivity analysis. We agree that these elements are important for supporting the reliability of the case-study findings and will revise the manuscript to incorporate them.
read point-by-point responses
-
Referee: [Case Studies] Case Studies section: the headline finding that energy-efficient GPUs outperform higher-performance alternatives under budget/energy constraints is produced by feeding benchmark-derived scaling curves and frequency-dependent power models into the TCO engine, yet the manuscript supplies no validation against hardware counters, no error bars on predicted performance or power, and no sensitivity of the ranking conclusions to plausible model error. This directly undermines the reliability of the reported multidimensional metrics and deployment recommendations.
Authors: We acknowledge that the current manuscript does not report hardware-counter validation, error bars, or sensitivity of the GPU rankings to model error. The case studies are presented as demonstrations of the platform's what-if and multi-objective analysis capabilities rather than as definitive procurement advice. In the revision we will add benchmark-derived error bars, a sensitivity study perturbing the scaling and power model parameters within observed variability ranges, and explicit discussion of how these affect the relative cost-effectiveness rankings. This will directly improve the robustness of the reported metrics. revision: yes
-
Referee: [Model description] Model description (performance scaling and DVFS piecewise power models): the abstract and case-study narrative treat these as accurate predictors for the listed workloads across GH200/H100/L40S/etc. at non-default frequencies, but no cross-validation, residual analysis, or comparison to measured data is reported. Because the central claim rests on these models, the absence of quantitative accuracy assessment is load-bearing.
Authors: The performance scaling and piecewise power models are constructed from benchmark measurements on the target GPUs, yet the manuscript indeed omits cross-validation, residual analysis, and direct measured-data comparisons. We will add a dedicated subsection (or appendix) that reports these quantitative assessments, including hold-out validation errors, residual distributions, and side-by-side plots of predicted versus measured performance and power for the listed workloads and frequency settings. This will supply the accuracy evaluation needed to underpin the abstract and case-study claims. revision: yes
Circularity Check
No circularity: platform integrates empirical models without self-referential reduction
full rationale
The manuscript describes a web-based decision-support tool that combines benchmark-derived performance scaling curves, DVFS-aware piecewise power models, and TCO formulas into interactive metrics. No derivation chain exists in which a claimed prediction or result is shown by the paper's own equations to be identical to its inputs by construction. The case-study outcomes are computed outputs of the integrated models applied to user-configured scenarios; the models themselves are presented as externally benchmarked rather than fitted and then renamed as predictions within the same closed loop. No self-citation load-bearing steps, uniqueness theorems, or ansatzes smuggled via prior work are invoked to justify core claims. The work is therefore self-contained as an engineering platform rather than a mathematical derivation.
Axiom & Free-Parameter Ledger
Reference graph
Works this paper leans on
-
[1]
The Green500 List: Energy-Efficient Supercomputers,
J. Dongarra, H. Meuer, H. Simon, M. Meuer, and E. Strohmaier, “The Green500 List: Energy-Efficient Supercomputers,” https://www.top500 .org/lists/green500, Nov 2025
2025
-
[2]
A review of energy efficiency evaluation metrics for data centers,
X. Shao, Z. Zhang, P. Song, Y . Feng, and X. Wang, “A review of energy efficiency evaluation metrics for data centers,”Energy and Buildings, vol. 271, p. 112308, 2022. [Online]. Available: https://doi.org/10.1016/j.enbuild.2022.112308
-
[3]
H. Klemick, E. Mansur, D. Raimi, and J. Shapiro, “How do data centers make energy efficiency investment decisions? Qualitative evidence from focus groups and interviews,”Energy Efficiency, vol. 12, no. 5, pp. 1359–1377, 2019. [Online]. Available: https: //doi.org/10.1007/s12053-019-09782-2
-
[4]
Accurate Energy and Performance Prediction for Frequency-Scaled GPU Kernels,
K. Fan, B. Cosenza, and B. Juurlink, “Accurate Energy and Performance Prediction for Frequency-Scaled GPU Kernels,”Computation, vol. 8, no. 2, 2020. [Online]. Available: https://doi.org/10.3390/computation8 020037
-
[5]
GPGPU Power Modeling for Multi-domain V oltage-Frequency Scaling,
J. Guerreiro, A. Ilic, N. Roma, and P. Tomas, “GPGPU Power Modeling for Multi-domain V oltage-Frequency Scaling,” in2018 IEEE International Symposium on High Performance Computer Architecture (HPCA). Los Alamitos, CA, USA: IEEE Computer Society, 2018, pp. 789–800. [Online]. Available: https://doi.org/10.1109/HPCA.2018.0007 2
-
[6]
A survey and measurement study of GPU DVFS on energy conservation,
X. Mei, Q. Wang, and X. Chu, “A survey and measurement study of GPU DVFS on energy conservation,”Digital Communications and Networks, vol. 3, no. 2, pp. 89–100, 2017. [Online]. Available: https://doi.org/10.1016/j.dcan.2016.10.001
-
[7]
V . Kandiah, S. Peverelle, M. Khairy, J. Pan, A. Manjunath, T. G. Rogers, T. M. Aamodt, and N. Hardavellas, “AccelWattch: A Power Modeling Framework for Modern GPUs,” inMICRO-54: 54th Annual IEEE/ACM International Symposium on Microarchitecture. New York, NY , USA: Association for Computing Machinery, 2021, p. 738–753. [Online]. Available: https://doi.org...
-
[8]
PowerSensor3: A Fast and Accurate Open Source Power Measurement Tool,
S. van der Vlugt, L. Oostrum, G. Schoonderbeek, B. van Werkhoven, B. Veenboer, K. Doekemeijer, and J. Romein, “PowerSensor3: A Fast and Accurate Open Source Power Measurement Tool,” inProceedings of the International Symposium on Performance Analysis of Systems and Software (ISPASS), 2025. [Online]. Available: https://doi.org/10.48550/arXiv.2504.17883
-
[9]
EAR: Energy management framework for HPC,
J. Corbal ´an and L. Brochard, “EAR: Energy management framework for HPC,” https://www.bsc.es/research-and-development/software-and -apps/software-list/ear-energy-management-framework-hpc, 2018
2018
-
[10]
M. Khairy, Z. Shen, T. M. Aamodt, and T. G. Rogers, “Accel-Sim: An Extensible Simulation Framework for Validated GPU Modeling,” in2020 ACM/IEEE 47th Annual International Symposium on Computer Architecture (ISCA), 2020, pp. 473–486. [Online]. Available: https://doi.org/10.1109/ISCA45697.2020.00047
-
[11]
Powerlog: Lightweight Power Profiling Tool for NVIDIA GPUs,
A. R. Shovon, “Powerlog: Lightweight Power Profiling Tool for NVIDIA GPUs,” https://pypi.org/project/powerlog, 2026
2026
-
[12]
LIKWID: A Lightweight Performance-Oriented Tool Suite for x86 Multicore Environments,
J. Treibig, G. Hager, and G. Wellein, “LIKWID: A Lightweight Performance-Oriented Tool Suite for x86 Multicore Environments,” in 2010 39th International Conference on Parallel Processing Workshops, 2010, pp. 207–216. [Online]. Available: https://doi.org/10.1109/ICPP W.2010.38
-
[13]
AIMeter: Measuring, Analyzing, and Visualizing Energy and Carbon Footprint of AI Workloads,
H. Huang, K. Zhang, H. Liao, K. Wu, and G. Tang, “AIMeter: Measuring, Analyzing, and Visualizing Energy and Carbon Footprint of AI Workloads,” inArXiv preprint, 2025. [Online]. Available: https://doi.org/10.48550/arXiv.2506.20535
-
[14]
WattScope: Non-intrusive Application-level Power Disaggregation in Datacenters,
X. Guan, N. Bashir, D. Irwin, and P. Shenoy, “WattScope: Non-intrusive Application-level Power Disaggregation in Datacenters,”SIGMETRICS Perform. Eval. Rev., vol. 51, no. 4, p. 24–25, Feb. 2024. [Online]. Available: https://doi.org/10.1145/3649477.3649491
-
[15]
mlco2/codecarbon: v3.2.6,
B. Courty, V . Schmidt, S. Luccioni, Goyal-Kamal, MarionCoutarel, B. Feld, J. Lecourt, LiamConnell, A. Saboni, Inimaz, supatomic, M. L ´eval, L. Blanche, A. Cruveiller, ouminasara, F. Zhao, A. Joshi, A. Bogroff, H. de Lavoreille, N. Laskaris, E. Abati, D. Blank, Z. Wang, A. Catovic, M. Alencon, M. Stechly, C. Bauer, L. O. N. de Ara ´ujo, JPW, and MinervaB...
-
[16]
Available: https://doi.org/10.5281/zenodo.19334697
[Online]. Available: https://doi.org/10.5281/zenodo.19334697
-
[17]
A Simple Model for Determining True Total Cost of Ownership for Data Centers,
J. Koomey, K. Brill, P. Turner, J. Stanley, and B. Taylor, “A Simple Model for Determining True Total Cost of Ownership for Data Centers,” https://m.softchoice.com/files/pdf/about/sustain-enable/simplemodeldet ermingtruetco.pdf, 2007
2007
-
[18]
Total Cost of Ownership (TCO) resources and calculators,
NVIDIA, “Total Cost of Ownership (TCO) resources and calculators,” https://www.nvidia.com/en-us/networking/total-cost-ownership, 2026
2026
-
[19]
Intel Xeon Processor Advisor,
Intel, “Intel Xeon Processor Advisor,” https://xeonprocessoradvisor.int el.com, 2026
2026
-
[20]
AMD EPYC Server Virtualization TCO Estimation Tool,
AMD, “AMD EPYC Server Virtualization TCO Estimation Tool,” https: //www.amd.com/en/processors/epyc-VirtTCOtool, 2026
2026
-
[21]
Total Cost of Ownership (TCO) Calculator,
Scale Computing, “Total Cost of Ownership (TCO) Calculator,” https: //www.scalecomputing.com/total-cost-of-ownership-tco-calculator, 2026
2026
-
[22]
Cloud Carbon Footprint,
ThoughtWorks and the Cloud Carbon Footprint community, “Cloud Carbon Footprint,” https://www.cloudcarbonfootprint.org/ and https://github.com/cloud-carbon-footprint/cloud-carbon-footprint, 2026
2026
-
[23]
DC Pro: Data Center Profiler,
Lawrence Berkeley National Laboratory (LBNL), “DC Pro: Data Center Profiler,” https://datacenters.lbl.gov/dcpro, 2026
2026
-
[24]
LT-TCO: A TCO Calculation Model of Data Centers for Long-Term Data Preservation,
W. Yan, J. Yao, Q. Cao, and Y . Zhang, “LT-TCO: A TCO Calculation Model of Data Centers for Long-Term Data Preservation,” in2019 IEEE International Conference on Networking, Architecture and Storage (NAS), 2019, pp. 1–8. [Online]. Available: https: //doi.org/10.1109/NAS.2019.8834714
-
[25]
Metrics and an Infrastructure Model to Evaluate Data Center Efficiency,
C. L. Belady and C. G. Malone, “Metrics and an Infrastructure Model to Evaluate Data Center Efficiency,” inProceedings of the ASME 2007 InterPACK Conference collocated with the ASME/JSME 2007 Thermal Engineering Heat Transfer Summer Conference, ser. International Electronic Packaging Technical Conference and Exhibition, vol. 1, 2007, pp. 751–755. [Online]...
-
[26]
Algorithm for Calculating TCO and SCE Metrics to Assess the Efficiency of Using a Data Center,
B. Denisenko, M. Tyanutov, I. Nikiforov, and S. Ustinov, “Algorithm for Calculating TCO and SCE Metrics to Assess the Efficiency of Using a Data Center,” in2nd International Conference on Computer Applications for Management and Sustainable Development of Production and Industry (CMSD-II-2022), S. Sadullozoda and A. Gibadullin, Eds., vol. 12564, Internati...
-
[27]
SPEC Power Benchmark,
Standard Performance Evaluation Corporation (SPEC), “SPEC Power Benchmark,” https://www.spec.org/power ssj2008, 2026
2026
-
[28]
SPEC SERT: Server Efficiency Rating Tool,
——, “SPEC SERT: Server Efficiency Rating Tool,” https://www.spec .org/sert, 2026
2026
-
[29]
MLPerf Power Benchmark,
MLPerf, “MLPerf Power Benchmark,” https://mlperf.org/power, 2026
2026
-
[30]
HPCTOOLKIT: tools for performance analysis of optimized parallel programs,
L. Adhianto, S. Banerjee, M. Fagan, M. Krentel, G. Marin, J. Mellor-Crummey, and N. R. Tallent, “HPCTOOLKIT: tools for performance analysis of optimized parallel programs,”Concurrency and Computation: Practice and Experience, vol. 22, no. 6, pp. 685–701,
-
[31]
Available: https://www.doi.org/10.1002/cpe.1553
[Online]. Available: https://doi.org/10.1002/cpe.1553
-
[32]
A. Afzal, “The cost of computation: Metrics and models for modern multicore-based systems in scientific computing,”Master’s thesis, Department Informatik, Friedrich Alexander Universit ¨at Erlangen- N¨urnberg, 2015. [Online]. Available: https://doi.org/10.13140/RG.2.2. 35954.25283
-
[33]
A. Afzal, G. Hager, and G. Wellein, “SPEChpc 2021 Benchmarks on Ice Lake and Sapphire Rapids Infiniband Clusters: A Performance and Energy Case Study,” in14th IEEE/ACM Performance Modeling, Benchmarking and Simulation of High Performance Computer Systems (PMBS), 2023. [Online]. Available: https://doi.org/10.1145/3624062.36 24197
-
[34]
Analytic Roofline Modeling and Energy Analysis of LULESH Proxy Application on Multi-Core Clusters,
——, “Analytic Roofline Modeling and Energy Analysis of LULESH Proxy Application on Multi-Core Clusters,”International Journal of High Performance Computing Applications (IJHPCA), 2025. [Online]. Available: https://doi.org/10.1177/10943420251363711
-
[35]
NVIDIA GPU Architecture Specifications and Datasheets,
NVIDIA Corporation, “NVIDIA GPU Architecture Specifications and Datasheets,” https://www.nvidia.com/en-us/data-center, 2026
2026
-
[36]
AWS Pricing Calculator,
Amazon Web Services (AWS), “AWS Pricing Calculator,” https://calc ulator.aws, 2026
2026
-
[37]
Google Cloud Pricing Calculator,
Google Cloud, “Google Cloud Pricing Calculator,” https://cloud.google .com/products/calculator, 2026
2026
-
[38]
Azure Pricing Calculator,
Microsoft Azure, “Azure Pricing Calculator,” https://azure.microsoft.co m/en-us/pricing/calculator, 2026
2026
-
[39]
ENERGY STAR Program for Data Center Equip- ment,
ENERGY STAR, “ENERGY STAR Program for Data Center Equip- ment,” https://www.energystar.gov/products/data center equipment, 2026
2026
-
[40]
Life Cycle Analysis for Emissions of Scientific Computing Centres,
M. Wadenstein and W. Vanderbauwhede, “Life Cycle Analysis for Emissions of Scientific Computing Centres,”The European Physical Journal C, vol. 85, p. 913, 2025. [Online]. Available: https://doi.org/10.1140/epjc/s10052-025-14650-8
-
[41]
P. Arzt and F. Wolf, “Navigating Energy Doldrums: Modeling the Impact of Energy Price V olatility on HPC Cost of Ownership,”ArXiv preprint, 2025. [Online]. Available: https://arxiv.org/abs/2509.07567
-
[42]
GROMACS Unplugged: How Power Capping and Frequency Shapes Performance on GPUs,
A. Afzal, A. Kahler, G. Hager, and G. Wellein, “GROMACS Unplugged: How Power Capping and Frequency Shapes Performance on GPUs,”Euro-Par 2025: Parallel Processing Workshops Volume in the Springer Lecture Notes in Computer Science (LNCS) series, 2025. [Online]. Available: https://doi.org/10.48550/arXiv.2412.08792
-
[43]
An Integrated GPU Power and Performance Model,
S. Hong and H. Kim, “An Integrated GPU Power and Performance Model,” inProceedings of the 37th Annual International Symposium on Computer Architecture (ISCA), 2010, pp. 280–289. [Online]. Available: https://doi.org/10.1145/1815961.1815998
-
[44]
Experience on Clock Rate Adjustment for Energy-Efficient GPU-Accelerated Real-World Codes,
G. Amati, M. Turisini, A. Monterubbiano, M. Paladino, E. Boella, D. Gregori, and D. Croce, “Experience on Clock Rate Adjustment for Energy-Efficient GPU-Accelerated Real-World Codes,” inHigh Performance Computing. Cham: Springer Nature Switzerland, 2026, pp. 245–257. [Online]. Available: https://doi.org/10.1007/978-3-032-0 7612-0 19
-
[45]
Global sensitivity indices for nonlinear mathematical models and their Monte Carlo estimates,
I. Sobol, “Global sensitivity indices for nonlinear mathematical models and their Monte Carlo estimates,”Mathematics and Computers in Simulation, vol. 55, no. 1, pp. 271–280, 2001. [Online]. Available: https://doi.org/10.1016/S0378-4754(00)00270-6
-
[46]
A. Saltelli, P. Annoni, I. Azzini, F. Campolongo, M. Ratto, and S. Tarantola, “Variance based sensitivity analysis of model output. Design and estimator for the total sensitivity index,”Computer Physics Communications, vol. 181, no. 2, pp. 259–270, 2010. [Online]. Available: https://doi.org/10.1016/j.cpc.2009.09.018
-
[47]
Slurm Energy Plugin,
“Slurm Energy Plugin,” https://slurm.schedmd.com/slurm.conf.html, 2026. SITOGRAPHY VII. WATTLYTICSREPRODUCIBILITYSITOGRAPHY [S1] https://tinyurl.com/Wattlytics-R1 [S2] https://tinyurl.com/Wattlytics-R2 [S3] https://tinyurl.com/Wattlytics-R3 [S4] https://tinyurl.com/Wattlytics-R4 [S5] https://tinyurl.com/Wattlytics-R5 [S6] https://tinyurl.com/Wattlytics-R6...
2026
discussion (0)
Sign in with ORCID, Apple, or X to comment. Anyone can read and Pith papers without signing in.