REVIEW 3 major objections 5 minor 188 references
Pairwise quantile regression achieves fast log(n)/n learning rates
Reviewed by Pith at T0; open to challenge. T0 means a machine referee read the full paper against a public rubric. the ladder, T0–T4 →
T0 review · deepseek-v4-flash
2026-08-02 08:36 UTC pith:QW32LP6W
load-bearing objection A natural pairwise extension of quantile regression with a plausible fast-rate theorem, but the proof of Proposition 1 has a local-to-global gap that needs repair before the main result is watertight. the 3 major comments →
On Pairwise Quantile Regression - Statistical Guarantees and Applications
The pith
A machine-rendered reading of the paper's core claim, the machinery that carries it, and where it could break.
Core claim
The main result (Theorem 1 and Corollary 1) states that, for any delta in (0,1), with probability at least 1-delta, the excess risk of the empirical pairwise pinball-loss minimizer over a bounded VC class of symmetric functions is bounded by C( L log(n)/n + (B+||s||_inf) log(1/delta)/n + L/n ), provided the true conditional tau-quantile belongs to the class and the conditional density of the similarity score given the covariate pair is uniformly lower bounded by nu>0 in a neighborhood of the quantile. Consequently, the L2 distance to the conditional quantile is O(sqrt(log(n)/n)). The key mechanism is Proposition 1: the variance of the first-order Hoeffding projection is bounded by a constant
What carries the argument
The central object is the U-statistic version of the empirical pinball loss, bR_n(q) = 2/(n(n-1)) sum_{i<j} rho_tau(s(X_i,X_j)-q(Z_i,Z_j)), minimized over a symmetric function class Q. Its Hoeffding decomposition splits the centered U-statistic into a linear term (average of first-order projections k_q(V_i)) and a degenerate U-process remainder. Proposition 1 shows Var(k_q(V)) <= (2 max(tau,1-tau)^2 / nu) E(q), tying the variance of the linear term to the excess risk and enabling local-Rademacher-style concentration. Concentration bounds for degenerate U-processes control the remainder. This decomposition is what converts the problem into one where fast rates apply.
Load-bearing premise
The entire fast-rate result depends on Assumption 3: the conditional density of the similarity score given the covariate pair must be bounded below by a positive constant on a fixed interval around the target quantile, for every covariate pair; if that density is flat or degenerate, the variance-excess risk control and the log(n)/n rate disappear.
What would settle it
Construct a family of examples satisfying Assumptions 1-2 and realizability, with the conditional score distribution supported on only two points (so no positive density near the quantile), run the pairwise pinball-loss ERM on growing n, and measure excess risk and L2 error. If the observed rates are n^{-1/2} rather than log(n)/n, Assumption 3 is necessary for the fast rate.
If this is right
- The estimator achieves excess risk of order log(n)/n, faster than the generic 1/sqrt(n) rate, even though pairs are dependent.
- The variance-excess risk control holds with exponent theta=1 automatically, so pairwise quantile regression gets fast rates under the same density condition that guarantees uniqueness of the risk minimizer.
- Incomplete U-statistics with only O(n log n) pairs preserve near-optimal performance, making the method scalable to large datasets.
- The approach directly estimates extreme conditional quantiles of similarity scores, which correspond to false rejections and false acceptances in biometric systems, enabling targeted analysis of rare errors.
- A penalized model-selection scheme yields an oracle inequality over a countable collection of function classes.
Where Pith is reading between the lines
- The uniform density lower bound (Assumption 3) is plausible for smooth, continuous scores but may fail in real biometric data where conditioned covariates (like same-age, same-quality pairs) can make the score distribution nearly degenerate; if such degeneracy is present, the fast-rate guarantee is not in force. A practical check would be to estimate the conditional density near the quantile on su
- Because the fast rate follows from the variance-excess risk relation for U-statistics, the same proof template should transfer to other pairwise 'margin-like' losses, such as expectile regression or pairwise logistic-type losses, whenever a similar Lipschitz and calibration inequality holds.
- The paper notes but does not implement score recalibration via quantile alignment; one immediate extension is to use q_hat_tau to adjust raw similarity scores so that impostor/genuine distributions are standardized, then re-evaluate FAR/FRR on the adjusted scores.
- The Shapley analysis shows feature importances vary across quantile levels (e.g., quality dominates low genuine quantiles, hair length affects high impostor quantiles); this suggests a stratified error analysis could be performed per quantile to guide targeted data augmentation.
Editorial analysis
A structured set of objections, weighed in public.
Referee Report
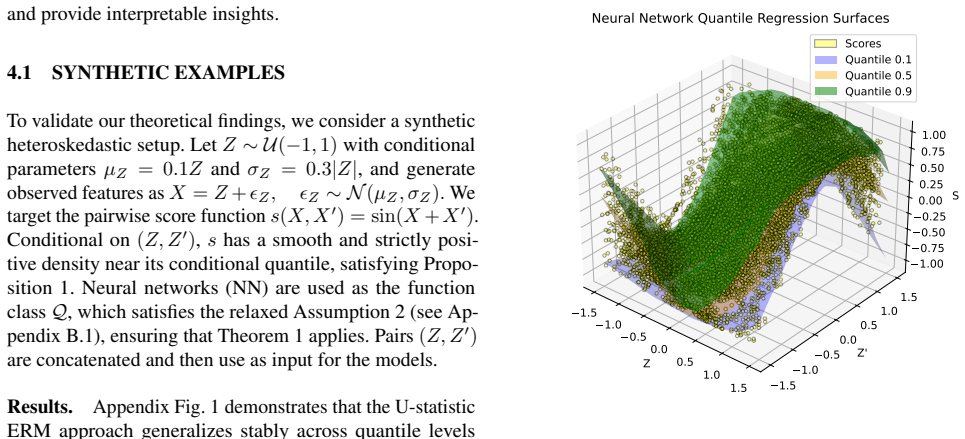
Summary. The paper proposes a pairwise extension of quantile regression, where the response is a symmetric similarity score s(X,X') and the covariates are pairs (Z,Z'). The empirical risk is a degree-2 U-statistic built from the pairwise pinball loss. The main theoretical claim is that, under a VC-type complexity condition on the function class and a local lower bound on the conditional density of the score near its conditional τ-quantile (Assumption 3), the excess risk of the empirical minimizer converges at the fast rate O(L log n / n) and the L2 error at O(sqrt(log n / n)). The authors also present synthetic experiments and a facial-recognition application with SHAP-based interpretability.
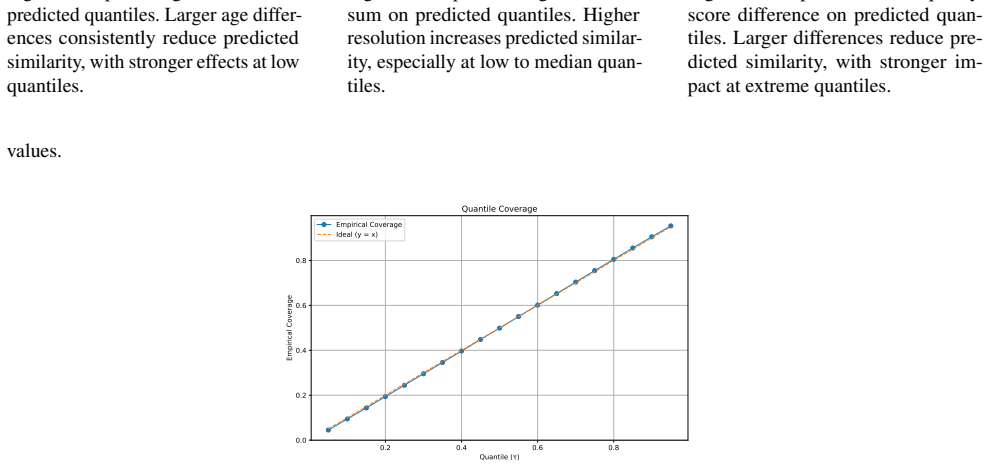
Significance. If established, the fast-rate result is a valuable addition to pairwise learning theory: it shows that the U-statistic structure yields a variance–excess-risk control with θ=1, leading to near-parametric rates under a mild local-density condition. The application to biometric similarity scores is timely and the empirical study, including coverage checks and model comparisons, is a useful contribution. The paper also provides code, which strengthens reproducibility. However, the proof of the main variance–excess proposition is not correct as written, and the proof of the main theorem contains an algebraic error in the Hoeffding decomposition; these issues affect the central theoretical claim and need to be repaired.
major comments (3)
- [Appendix A.1, Eq. (18)] The proof claims the global quadratic lower bound E(q) ≥ (ν/2)||q−Qs||²_{L2}. Assumption 3 only gives density control on the δ-neighborhood of the conditional quantile. For |Δq| > δ, the Knight-identity integral ∫_0^Δ (F(Qs+t)−F(Qs))dt grows at most linearly, not quadratically. Concretely, take τ=1/2, Qs=0.5, and conditional density 50 on [0.49,0.51] and 0 elsewhere; for q≡1, E(q)=0.2475 while (ν/2)||q−Qs||² = 6.25. Thus Proposition 1 as stated is false. The fast rate can likely be salvaged by replacing the quadratic lower bound with a combination of the local quadratic bound and a linear bound for large deviations, yielding C_var depending on (B+||s||∞)/δ, but this repair is not in the manuscript and the stated constant 2Mτ²/ν is not correct.
- [Appendix A.2, Eq. (20)] The canonical (degenerate) kernel is defined as k̂_q(V,V') = K_q(V,V') − k_q(V) − k_q(V') − E(q). For a symmetric kernel K_q, the correct Hoeffding projection is K_q − k_q(V) − k_q(V') + E(q), where E(q)=E[K_q]. With the minus sign, k̂_q is not centered and the decomposition bE_n(q) − E(q) = 2T_n(q) + W_n(q) is algebraically wrong; the right-hand side differs by 2E(q). This is a load-bearing error because the subsequent bound E(q̂_τ) ≤ 2(sup|T_n| + sup|W_n|) follows from that decomposition. The argument can be fixed by changing the sign to +E(q), but as written the proof of Theorem 1 is incorrect.
- [Theorem 1 and Corollary 1] Both results rely on Proposition 1 for the variance–excess control and on Eq. (18) for the L2-to-excess bound. Since Eq. (18) is not valid globally, the stated constants and the claimed range of applicability are not justified. The rate O(log n/n) is likely preserved after the repair, but the constants must be modified to include a factor depending on the ratio (B+||s||∞)/δ (or a similar term). The manuscript should state the repaired proposition and track the new constants through the proof.
minor comments (5)
- [Assumption 2] For real-valued function classes, 'VC-dimension' should be defined precisely (e.g., VC subgraph dimension) or the relevant entropy integral should be stated. The current wording is slightly ambiguous.
- [Appendix A.1] The phrase 'by a first-order Taylor expansion of the conditional CDF' is not accurate; the identity is an exact integral representation via the Knight identity. Rewording would improve clarity.
- [Appendix B.2] In Proposition 2 the bound contains (B+1)log(n/δ)/n; the appearance of '1' is unexplained. Presumably it is ||s||∞, but this should be stated explicitly.
- [Section 4.2] The D2 values in Table 1 are useful, but the text does not report error bars or a measure of variability across data splits. Adding confidence intervals would strengthen the empirical claims.
- [Throughout] Several references are cited with page numbers or theorem numbers that are not checked against the actual sources (e.g., Theorem 8.3 in Massart 2007). The authors should verify these citations carefully.
Circularity Check
No significant circularity: the fast-rate theorem follows from a new variance-excess inequality plus external U-process concentration results; self-citations are to prior machinery, not to the target claim.
full rationale
The central derivation chain is: (i) define the pairwise pinball risk and its U-statistic empirical counterpart; (ii) prove a variance-excess inequality for the Hoeffding projection (Prop. 1) using the Knight identity and the local density lower bound (Assumption 3); (iii) combine that inequality with existing U-process concentration and local Rademacher bounds (Clémençon et al. 2008, Massart 2007) to obtain log(n)/n risk bounds and an L2 rate. None of these steps assumes E(q̂τ) ≤ C(...) as an input; the target bound is the output of the fixed-point/local-complexity argument. The paper's self-citations (Clémençon et al. 2008, Clémençon 2011/2014) are to general U-process or ranking/clustering machinery, not to the pairwise quantile-regression claim; Theorem 5/Corollary 6 of Clémençon et al. 2008 are published concentration results with independent proofs. The density lower bound (Assumption 3) is a stated condition, not the conclusion being proved. The empirical section validates coverage and loss reduction against baselines rather than fitting the theoretical constants; no fitted parameter is later renamed a prediction. The reviewer/skeptic concern about Prop. 1's use of the quadratic lower bound outside the δ-neighborhood is a possible proof-repair issue (the constant C_var may need modification for large |Δq|), but it is a correctness gap, not a circular reduction: the theorem does not define Qs in terms of q̂τ or fit a parameter to the quantity it predicts. Appendix B's model-selection and approximation-error extensions are explicit relaxations/deferrals, not circular dependencies. I therefore find no self-definitional, fitted-input, or self-citation-chain circularity.
Axiom & Free-Parameter Ledger
axioms (6)
- domain assumption Assumption 3: ps|Z,Z'(t) ≥ ν > 0 for all (z,z') and all t in [Qs(τ|z,z')−δ, Qs(τ|z,z')+δ].
- domain assumption Assumption 2: Q is a bounded VC class of symmetric functions with finite VC dimension L and uniform bound B.
- domain assumption Realizability: Qs(τ|·) ∈ Q (relaxed in Appendix B.2 by adding approximation error A(Q)).
- standard math U-process concentration results of Clémençon et al. (2008) and Massart (2007), including local Rademacher complexity and degenerate U-statistic bounds.
- standard math Knight (1998) identity for the difference of pinball losses.
- standard math The conditional τ-quantile minimizes the pinball risk, so the first-order term in the Knight identity vanishes in expectation.
read the original abstract
Quantile regression provides a powerful tool for summarizing the conditional distribution of a real-valued random variable (r.v.) of interest $Y$ as a function of covariates $Z$ in cases where it shows a large dispersion with high probability, going beyond the situation where standard least square regression is informative/predictive. This article aims to extend this methodology to the pairwise setting, where the variable to be explained is a similarity score between two independent observations (e.g., pixelated ID photos used as input to biometric systems), and the explanatory variables consist of the pair of covariates attached to these observations, such as age or hair color. We establish theoretical guarantees for solutions of this statistical learning problem, considered here as empirical minimizers of a pairwise version of the pinball loss. Leveraging sharp concentration results for $U$-processes, we prove generalization bounds and identify mild conditions under which fast learning rates can be achieved. Confirming the probabilistic analysis, experiments based on simulation data also provide solid empirical evidence of the validity of the methodology promoted here for pairwise quantile regression. Finally, its usefulness from an application perspective is demonstrated by a detailed study aimed at analyzing errors in similarity scoring for facial recognition.
Figures




Reference graph
Works this paper leans on
-
[1]
Hoeffding , title =
W. Hoeffding , title =. The Annals of Mathematical Statistics , number =
-
[2]
Handbook of Quantile Regression , pages=
Extremal quantile regression , author=. Handbook of Quantile Regression , pages=. 2017 , publisher=
2017
-
[3]
International Conference on Machine Learning , pages=
A probabilistic theory of supervised similarity learning for pointwise ROC curve optimization , author=. International Conference on Machine Learning , pages=. 2018 , organization=
2018
-
[4]
and Ngan, M
Grother, P. and Ngan, M. , title =
-
[5]
2014 , author =
A statistical view of clustering performance through the theory of U-processes , journal =. 2014 , author =
2014
-
[6]
2011 , publisher=
Reproducing kernel Hilbert spaces in probability and statistics , author=. 2011 , publisher=
2011
-
[7]
Journal of Machine Learning Research , volume=
Total stability of SVMs and localized SVMs , author=. Journal of Machine Learning Research , volume=
-
[8]
S. Cl. The Annals of Statistics , number =
-
[9]
Electron
Clémençon and Laforgue , title=. Electron. J. Statist. , year=
-
[10]
Asian Conference on Machine Learning , pages=
Learning from survey training samples: rate bounds for Horvitz-Thompson risk minimizers , author=. Asian Conference on Machine Learning , pages=. 2016 , organization=
2016
-
[11]
International Conference on Machine Learning , pages=
Learning from biased data: A semi-parametric approach , author=. International Conference on Machine Learning , pages=. 2021 , organization=
2021
-
[12]
O. H. M. Padilla and W. Tansey and Y. Chen , title =. Journal of Machine Learning Research , year =
-
[13]
Computing Science and Statistics: Statistics of Many Parameters: Curves, Images, Spatial Models , pages=
Nonparametric estimation of conditional quantiles using neural networks , author=. Computing Science and Statistics: Statistics of Many Parameters: Curves, Images, Spatial Models , pages=. 1992 , publisher=
1992
-
[14]
Journal of machine learning research , volume=
Quantile regression forests , author=. Journal of machine learning research , volume=
-
[15]
Hirotugu , journal =
A. Hirotugu , journal =. Information theory and an extension of the maximum likelihood principle , year =
-
[16]
Ehab and M
A. Ehab and M. Hiba and E. Elsayed , doi =. Bivariate Weibull Distribution: Properties and Different Methods of Estimation , volume =
-
[17]
Advances in
Cl\'emen. Advances in. 2011 , title=
2011
-
[18]
Metric Learning , author=
-
[19]
A. K. Menon and R. C. Williamson , title =. Journal of Machine Learning Research , year =
-
[20]
CThomas , journal =
A. CThomas , journal =. A Note on the Identifiability of Mixtures of Distributions , volume =
-
[21]
Faustina Johnson and A
A. Faustina Johnson and A. Edward Kwabena and others , journal =. Autoregressive Integrated Moving Average (ARIMA) Modeling of Time Series Data: A Case Study on Crime Rate in Buffalo, New York , volume =
-
[22]
Journal of Machine Learning Research , year=
Empirical risk minimization under random censorship , author=. Journal of Machine Learning Research , year=
-
[23]
Journal of machine learning research , year=
Rademacher and gaussian complexities: Risk bounds and structural results , author=. Journal of machine learning research , year=
-
[24]
Local Rademacher complexities , year =
Bartlett and Bousquet and Mendelson , journal =. Local Rademacher complexities , year =
-
[25]
Jean-Patrick and C
B. Jean-Patrick and C. Gilles , hal_id =
-
[26]
B. Aharon and N. Arkadi , doi =. Lectures on Modern Convex Optimization , year =. https://epubs.siam.org/doi/pdf/10.1137/1.9780898718829 , publisher =
-
[27]
1981 , journal=
Nonparametric regression with randomly censored survival data , author=. 1981 , journal=
1981
-
[28]
B. Chris M. , journal =. Stochastic EM , year =
-
[29]
2006 , publisher=
Pattern recognition and machine learning , author=. 2006 , publisher=
2006
-
[30]
Journal of Nonparametric Statistics , year=
Uniform convergence rate of the kernel regression estimator adaptive to intrinsic dimension in presence of censored data , author=. Journal of Nonparametric Statistics , year=
-
[31]
Convex Optimization , year =
Boyd and Vandenberghe , publisher =. Convex Optimization , year =
-
[32]
B. B.W. and H. M. and K. R.M. and F. STATE UNIV TALLAHASSEE Deptof STATISTICS. , publisher =. Nonparametric Tests of Independence for Censored Data with Application to Heart Transplant Studies , year =
-
[33]
Test , year=
Nonparametric density estimation in presence of bias and censoring , author=. Test , year=
-
[34]
Data mining and knowledge discovery , year=
A tutorial on support vector machines for pattern recognition , author=. Data mining and knowledge discovery , year=
-
[35]
Proceedings of the 22nd international conference on Machine learning , year=
Learning to rank using gradient descent , author=. Proceedings of the 22nd international conference on Machine learning , year=
-
[36]
Kenneth P
B. Kenneth P. and A. David R. , publisher =. Model Selection and Multimodel Inference: A Practical Information-Theoretic Approach , year =
-
[37]
Sort Out
C. Rich and B. Shumeet and M. Tom , journal =. Using the Future to "Sort Out" the Present: Rankprop and Multitask Learning for Medical Risk Evaluation , volume =
-
[38]
Gilles and P
C. Gilles and P. Patrick , hal_id =
-
[39]
C. John M. and H. Trevor J. , publisher =. Statistical Models in S , year =
-
[40]
Ming-Hui and M
C. Ming-Hui and M. Peter and P. Diana B. , journal =. Maximum Likelihood Estimation for a Mixture of Two Weibull Distributions , volume =
-
[41]
Ming-Hui and M
C. Ming-Hui and M. Peter and P. Diana B. , journal =. Estimation and Testing for a Mixture Model with Components from Exponential and Weibull Distributions , volume =
-
[42]
Ming-Hui and M
C. Ming-Hui and M. Peter , journal =. A Mixture Model with Weibull Components as a Survival Model for Heterogeneous Populations , volume =
-
[43]
arXiv , author =:1907.07523 , primaryclass =
A Multivariate Extreme Value Theory Approach to Anomaly Clustering and Visualization , year =. arXiv , author =:1907.07523 , primaryclass =
Pith/arXiv arXiv 1907
-
[44]
Sik Cho , journal =
J. Sik Cho , journal =. Reliability for series system in bivariate Weibull model under bivariate random censorship , volume =
-
[45]
Advances in neural information processing systems , year=
Ranking data with continuous labels through oriented recursive partitions , author=. Advances in neural information processing systems , year=
-
[46]
C. D. , publisher =. Modelling Survival Data in Medical Research , year =
-
[47]
2018 , publisher=
Analysis of survival data , author=. 2018 , publisher=
2018
-
[48]
C. DR. and O. D. , journal =. Competing Risks: A Practical Perspective , volume =
-
[49]
Regression Models and Life-Tables , urldate =
DRCox , journal =. Regression Models and Life-Tables , urldate =
-
[50]
1994 , publisher=
Statistical analysis of reliability data , author=. 1994 , publisher=
1994
-
[51]
Scandinavian Journal of Statistics , year=
Non-parametric regression with censored survival time data , author=. Scandinavian Journal of Statistics , year=
-
[52]
The Annals of Statistics , year=
Uniform consistency of the kernel conditional Kaplan-Meier estimate , author=. The Annals of Statistics , year=
-
[53]
Nonparametric quantile regression with censored data , author=. Sankhy. 1992 , publisher=
1992
-
[54]
1999 , publisher=
Decoupling: from dependence to independence , author=. 1999 , publisher=
1999
-
[55]
Maximum Likelihood from Incomplete Data via the EM Algorithm , urldate =
APDempster and NMLaird and DBRubin , journal =. Maximum Likelihood from Incomplete Data via the EM Algorithm , urldate =
-
[56]
Florence and P
D. Florence and P. Patrick , hal_id =
-
[57]
Frechet Differentiability, p-Variation and Uniform Donsker Classes , urldate =
RMDudley , journal =. Frechet Differentiability, p-Variation and Uniform Donsker Classes , urldate =
-
[58]
J. Dupuy and K. Essona Gneyou , doi =. A Wavelet Estimator of the Intensity Function with Censored Data , volume =. https://doi.org/10.1080/16843703.2011.11673266 , journal =
arXiv 2011
-
[59]
EElmahdy and A
E. EElmahdy and A. WAboutahoun , journal =. A new approach for parameter estimation of finite Weibull mixture distributions for reliability modeling , volume =
-
[60]
EElmahdy , journal =
E. EElmahdy , journal =. A new approach for Weibull modeling for reliability life data analysis , volume =
-
[61]
Ronald A
F. Ronald A. and M. Frank J. , journal =. Weibull Distributions in Life Data Analysis , volume =
-
[62]
Thomas R
F. Thomas R. and H. David P. , publisher =. Counting
-
[63]
A Method for Comparing Two Hierarchical Clusterings , volume =
EBFowlkes and CLMallows , journal =. A Method for Comparing Two Hierarchical Clusterings , volume =
-
[64]
Chris and R
F. Chris and R. Adrian E. , booktitle =. The MCLUST procedure for fitting mixtures of normal and t-components , year =
-
[65]
F. David A. , publisher =. Statistical Models: Theory and Practice , year =
-
[66]
Yoav and I
F. Yoav and I. Raj and S. Robert and S. Yoram , journal =. An Efficient Boosting Algorithm for Combining Preferences. , volume =
-
[67]
Bahareh and Y
G. Bahareh and Y. Masoud and H. Narges and S. Esmaeil , journal =. Wavelet estimation of copula function based on cencored data , volume =
-
[68]
G. C. , lccn =. Introduction to High-Dimensional Statistics , year =
-
[69]
Gönen and G
M. Gönen and G. Heller , journal =. Concordance Probability and Discriminatory Power in Proportional Hazards Regression , urldate =
-
[70]
PFine and R
J. PFine and R. JGray , journal =. A Proportional Hazards Model for the Subdistribution of a Competing Risk , urldate =
-
[71]
FE and C
H. FE and C. RM and P. DB and L. KL and R. RA , journal =. Evaluating the yield of medical tests , volume =
-
[72]
EHarrell and K
F. EHarrell and K. L Lee and D. BMark , journal =. Multivariable prognostic models: issues in developing models, evaluating assumptions and adequacy, and measuring and reducing errors. , volume =
-
[73]
Jr., Frank E
H. Jr., Frank E. and L. Kerry L. and C. Robert M. and P. David B. and R. Robert A. , eprint =. Regression modelling strategies for improved prognostic prediction , volume =. Statistics in Medicine , keywords =
-
[74]
Olga and G
P. Olga and G. Gonzalez, Eduardo and V. Huerta, Humberto and V. José , journal =. Identifiability and Comparison of Estimation Methods on Weibull Mixture Models , volume =
-
[75]
Jia and J
Y. Jia and J. Jeong , journal =. Deep learning for quantile regression under right censoring: DeepQuantreg , volume =
-
[76]
Shuichi and H
J. Shuichi and H. David P. , journal =. Analysis of survival data with a nonmonotone hazard function and unobservable states , volume =
-
[77]
Takeuchi and Q
I. Takeuchi and Q. V. Le and T. D. Sears and A. J. Smola , journal =. Nonparametric Quantile Estimation , volume =
-
[78]
Bradley , journal =
J. Bradley , journal =. A Class of Three-Level Designs for Definitive Screening in the Presence of Second-Order Effects , volume =
-
[79]
K. JD. and P. RL. , publisher =. The Statistical Analysis of Failure Time Data , year =
-
[80]
2002 , publisher=
The statistical analysis of failure time data , author=. 2002 , publisher=
2002
discussion (0)
Sign in with ORCID, Apple, or X to comment. Anyone can read and Pith papers without signing in.