REVIEW 3 major objections 4 minor 41 references
Future mm-VLBI of M87 can separate turbulent from reconnection electron heating and thermal from non-thermal particle distributions.
Reviewed by Pith at T0; open to challenge. T0 means a machine referee read the full paper against a public rubric. the ladder, T0–T4 →
T0 review · grok-4.5
2026-07-14 05:35 UTC pith:ZJVPVRYA
load-bearing objection Solid multi-frequency GRMHD+GRRT diagnostics for M87 heating models; the abstract claim is a bit ahead of the idealised maps, but the work is still useful and referee-ready. the 3 major comments →
Probing radiation micro-physics in M 87 I. Total intensity and broad-band spectra
The pith
A machine-rendered reading of the paper's core claim, the machinery that carries it, and where it could break.
Core claim
With a dynamical range of 10^4 and simultaneous coverage from 86 GHz to 345 GHz, future VLBI arrays can observationally separate turbulent versus magnetic-reconnection electron heating and thermal versus hybrid kappa electron distributions in M87, even though the integrated spectra and single-frequency total-intensity images remain largely degenerate.
What carries the argument
Two-temperature MAD GRMHD runs with explicit electron-entropy evolution under turbulent (Kawazura-type) and reconnection (Rowan-type) heating fractions, post-processed with GRRT that includes both Maxwell–Jüttner and kappa distributions whose parameters are set by local magnetisation and plasma beta.
Load-bearing premise
The electron-heating fractions and kappa slopes taken from idealised particle-in-cell simulations remain valid when applied as sub-grid prescriptions to the global, time-dependent magnetically arrested flow.
What would settle it
A multi-frequency VLBI campaign of M87 that reaches dynamic range ~10^4 between 86 GHz and 345 GHz and measures spectral-index maps on 50–150 µas scales; if those maps show no systematic difference between the jet sheath and the highly magnetised interior, the claimed separability fails.
If this is right
- Spectral-index maps between 86 GHz and 230 GHz become the primary observable for distinguishing heating mechanisms, not single-frequency total-intensity images.
- Hybrid thermal-plus-kappa models are required to match both the radio-to-NIR spectrum and the extended jet emission at millimetre wavelengths.
- The radial transition from steep (disk-dominated) to flat (jet-dominated) spectral index can locate the non-thermal particle injection radius.
- Turnover frequency and turnover flux density are largely insensitive to heating model and electron distribution, while the optically thin spectral index remains diagnostic.
Where Pith is reading between the lines
- If the same spectral-index contrast appears in other low-luminosity AGN, the method becomes a general diagnostic rather than an M87-specific tool.
- Polarimetric extensions of the same multi-frequency campaign would further break remaining degeneracies between heating models once Faraday rotation and ordered-field geometry are included.
- The requirement for dynamic range 10^4 sets a concrete performance target for ngEHT and ngVLA array design and calibration strategies.
Editorial analysis
A structured set of objections, weighed in public.
Referee Report
Summary. This paper presents long-term 3D GRMHD simulations of MAD accretion onto a high-spin Kerr black hole (a*=0.9375) that evolve electron entropy under two sub-grid heating prescriptions (turbulent from Kawazura et al. 2019 and reconnection from Rowan et al. 2017). The snapshots are post-processed with GRRT (BHOSS) using thermal Maxwell–Jüttner and hybrid thermal–kappa electron distribution functions (with kappa and width parametrized from PIC results of Ball et al. 2018 and Meringolo et al. 2023). For M87 parameters the authors compute broadband spectra, 230 GHz images with disk/jet decompositions, 86–230 GHz spectral-index maps, optical-depth profiles, and turnover-frequency/flux maps. They conclude that, while total-intensity images and integrated spectra are largely degenerate, spectral-index structure and optically-thin slopes differ systematically between heating models and eDFs, so that future VLBI arrays with dynamical range ~10^4 over 86–345 GHz have the potential to distinguish them.
Significance. If the reported spectral-index and turnover distinctions survive realistic observing conditions, the work supplies concrete, falsifiable predictions that link sub-grid electron microphysics to multi-frequency VLBI observables of M87 on scales from the photon ring to ~1000 µas. This is timely for ngEHT and ngVLA planning. Strengths include the consistent two-temperature GRMHD implementation, PIC-calibrated heating and kappa recipes, careful component decompositions, optical-depth analysis, radial profiles, and the parameter explorations already present in the appendices. The calculations are performed with publicly documented codes (BHAC, BHOSS) and therefore in principle reproducible.
major comments (3)
- [Abstract and Section 6] The abstract and §6 claim that a dynamical range of 1×10^4 over 86–345 GHz is sufficient for future VLBI to distinguish turbulent versus reconnection heating and thermal versus kappa eDFs. This rests entirely on idealised, time-averaged GRRT images and maps (Figs. 6, 8–11) that are never passed through a realistic array response, thermal noise, sparse uv-coverage or imaging regularisation. The paper itself emphasises that total-intensity images are largely degenerate (§5) and that the discriminatory power resides in spectral-index structure; without a controlled recovery test it remains unproven that those differences remain detectable at the quoted dynamic range. Either synthetic ngEHT/ngVLA observations or an explicit qualification of the claim is required.
- [Section 3 and Appendix B] The free parameters ε = 0.5 and r_inj = 10 M are fixed to values previously chosen to fit the broadband SED and jet width, while ṁ is iterated to match 1 Jy of compact 230 GHz flux. Appendix B demonstrates that the spatial extent of the steep-to-flat spectral-index transition depends on both parameters. The main-text results and the abstract claim should quantify how the distinguishability between heating models persists (or degrades) across a plausible range of ε and r_inj rather than presenting primarily the single best-fit case.
- [Section 2, Eqs. (2)–(3) and (8)–(9)] The electron-heating fractions (Eqs. 2–3) and kappa parametrizations (Eqs. 8–9) are taken from idealised PIC simulations and applied as sub-grid models. The authors correctly flag the limitations (omission of compressive fluctuations, full reconnection geometries and non-local effects). Because the quantitative spectral-index differences that underpin the central claim are generated by these prescriptions, a short robustness test—e.g., modest variations of the functional forms within published uncertainties, or a direct comparison with a simple R–β model—would strengthen that the reported distinctions are not artefacts of the specific sub-grid choices.
minor comments (4)
- [Throughout] Several typographical errors remain (e.g., “Appdenix B”, “moti-vated”, inconsistent spacing in “eDF : thermal”). A careful proof-reading pass is needed.
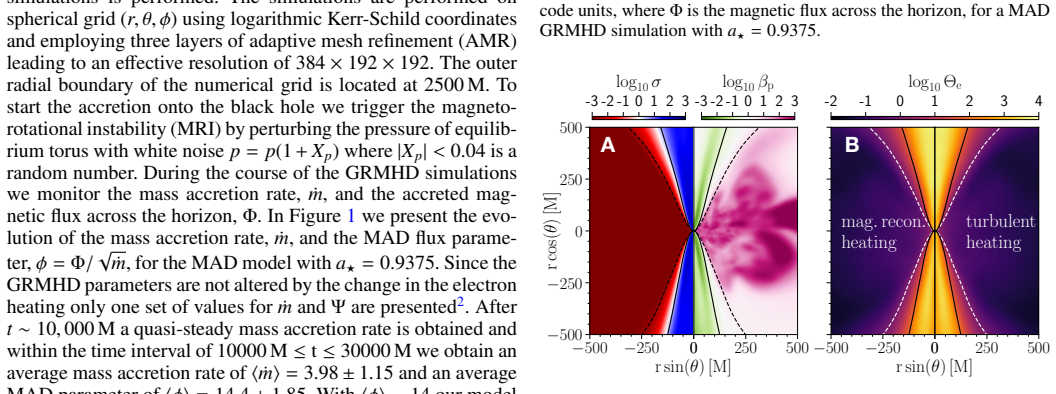
- [Figures 2 and 4] Figure 2 and Figure 4 colour bars use non-standard symbols (æ, Øp, £e); these should be replaced by conventional σ, β_p, Θ_e for readability.
- [Section 3] The viewing angle is stated as ϑ = 160° in the text but the jet-axis orientation in the images is not explicitly related to the observer’s line of sight; a short clarifying sentence would help.
- [Section 2] The floor model and σ_cut = 3 are standard, yet the residual North–South asymmetries after time/azimuthal averaging (Fig. 2) are attributed partly to floors. A quantitative statement of how much of the jet-spine emission is discarded would be useful.
Circularity Check
Minor conventional normalizations (230 GHz flux match and ε=0.5 chosen from prior SED/jet-width fits) do not force the spectral-index distinguishability that is the paper's main claim.
specific steps
-
fitted input called prediction
[Section 3, paragraph on mass-accretion-rate normalisation]
"For the final radiative transfer we fix the mass, distance and viewing angle (ϑ=160°) of M87 while iterating the mass accretion rate to match an average flux of 1.0 Jy at 230 GHz for the compact emission region (r∼100 µas) over 28000 M ≤ t ≤ 30000 M. The resulting accretion rates are 2.79 (2.59)×10−5 M⊙ yr−1 for magnetic reconnection heating without/with non-thermal particles and 2.72 (2.47)×10−5 M⊙ yr−1 for turbulent heating."
The absolute flux scale of every model is forced to the observed 1 Jy compact flux at 230 GHz by construction. This is a conventional overall normalisation; it does not dictate the spectral-index or multi-frequency morphology differences that constitute the paper's distinguishability claim, so the circularity is minor.
-
self citation load bearing
[Section 3, choice of ε and r_inj]
"The only free parameter in our GRRT setup is the fraction of magnetic energy, ε, that determines the width of the κ distribution (see Eq. 7). We study ε=0.5, as this value provides the best simultaneous fit to the broadband spectral energy distribution of M87 and the observed jet width (see Fromm et al. 2022; Cruz-Osorio et al. 2021)."
ε=0.5 is adopted because prior papers by overlapping authors found it best matches the SED and jet width. The choice is therefore not derived from first principles inside the present work. It is not load-bearing for the heating-model contrast (the paper also shows thermal-only runs), so the circularity remains mild.
full rationale
The paper's central result is that turbulent vs reconnection heating and thermal vs kappa eDFs produce distinguishable multi-frequency signatures (especially spectral-index maps and optically-thin slopes) once idealised GRRT images are formed. Those differences arise from the distinct spatial dependence of the imported heating fractions (Eqs. 2–3) and kappa prescriptions (Eqs. 8–9) applied to the same MAD GRMHD flow; they are not tautological restatements of the inputs. The only steps that reduce to fitted or previously-chosen quantities are the overall mass-accretion-rate normalisation (iterated so that the compact 230 GHz flux equals 1 Jy) and the choice ε=0.5 (selected because earlier work by overlapping authors found it best matches the broadband SED and jet width). Both are standard practice in the field and leave the relative spectral-index contrasts free. Self-citations to Mizuno et al. (2021), Fromm et al. (2022), Cruz-Osorio et al. (2021) and Zhang et al. (2024) supply the heating implementation and the ε preference but do not constitute a uniqueness theorem that forbids alternatives; the paper itself notes the limitations of the sub-grid recipes. No self-definitional loop, no prediction that is forced by construction, and no renaming of a known empirical pattern appear. Score 2 reflects only the conventional, non-load-bearing normalisations.
Axiom & Free-Parameter Ledger
free parameters (5)
- ε (magnetic-energy fraction for non-thermal particles) =
0.5
- r_inj (non-thermal injection radius) =
10 M
- mass accretion rate ṁ =
≈2.5–2.8e-5 Msun/yr
- σ_cut =
3
- black-hole spin a* =
0.9375
axioms (5)
- domain assumption Turbulent (Kawazura et al. 2019) and reconnection (Rowan et al. 2017) heating fractions adequately capture electron energization in global MAD flows
- domain assumption κ(σ, β_p) parametrizations from Ball et al. (2018) and Meringolo et al. (2023) correctly describe non-thermal tails
- domain assumption MAD models better describe EHT observations of M87 than SANE models
- domain assumption Synchrotron emission dominates from radio to NIR; Bremsstrahlung and inverse Compton can be neglected below ~10^{16} Hz
- ad hoc to paper Adiabatic index γ̂ = 4/3 and floor prescriptions (ρ_fl, p_fl, electron-pressure bounds) do not qualitatively alter the observable differences outside the excluded spine
read the original abstract
Next generation Very Long Baseline Interferometers (VLBI) will provide dense sampling of the Fourier space together with high signal to noise ratios allowing to reliably observe and image faint jet structure in M 87 at mm-wavelength. The proposed next generation Event Horizon Telescope (ngEHT) and next generation Very Large Array (ngVLA) offers the unique capability to simultaneously resolve and image the accretion flow around the supermassive black hole in M 87 together with the jet launching and acceleration zone. In order to explore these capabilities and to provide theoretical expectations we perform general relativistic magnetohydrodynamic simulations of accretion on to black holes and jet launching. M 87 has been the target for multiple observations across the entire electromagnetic spectrum. Among these VLBI observations provide unique capability to resolve the jet structure down to several gravitational radii. In this work we provide possible observable signatures which will allow us to distinguish between different electron heating models and particle distributions. We use general relativistic magnetohydrodynamics and simulate the accretion of the magnetised plasma onto Kerr-black holes in 3D. The multi-frequency radiative signatures of these simulations are computed taking different electron heating and distribution functions into account. The results of our simulations show that with a dynamical range of $1\times 10^4$ and a frequency range from 86 GHz to 345 GHz observations with future VLBI arrays have the potential to tell turbulent and magnetic reconnection electron heating and the electron distribution function apart.
Figures



Reference graph
Works this paper leans on
-
[1]
C., Balokovi´c, M., Chandra, S., et al
Algaba, J. C., Balokovi´c, M., Chandra, S., et al. 2024, A&A, 692, A140
2024
-
[2]
& Nakamura, M
Asada, K. & Nakamura, M. 2012, ApJ, 745, L28
2012
-
[3]
2018, Astrophys
Ball, D., Sironi, L., & Özel, F. 2018, Astrophys. J., 862, 80
2018
-
[4]
H., Emslie, A
Bian, N. H., Emslie, A. G., Stackhouse, D. J., & Kontar, E. P. 2014, ApJ, 796, 142
2014
-
[5]
2019, ARA&A, 57, 467
Blandford, R., Meier, D., & Readhead, A. 2019, ARA&A, 57, 467
2019
-
[6]
Blandford, R. D. & Königl, A. 1979, ApJ, 232, 34
1979
-
[7]
Blandford, R. D. & Payne, D. G. 1982, Mon. Not. R. Astron. Soc., 199, 883
1982
-
[8]
Blandford, R. D. & Znajek, R. L. 1977, Mon. Not. R. Astron. Soc., 179, 433
1977
-
[9]
2025, MNRAS, 537, 2496
Chael, A. 2025, MNRAS, 537, 2496
2025
-
[10]
A., Johnson, M
Chael, A. A., Johnson, M. D., Bouman, K. L., et al. 2018, ApJ, 857, 23
2018
-
[11]
Cruz-Osorio, A., Fromm, C. M., Mizuno, Y ., et al. 2021, Nature Astronomy [arXiv:2111.02517]
Pith/arXiv arXiv 2021
-
[12]
M., et al
Cruz-Osorio, A., Meringolo, C., Fromm, C. M., et al. 2026, ApJ, 1001, 227
2026
-
[13]
2023, Nature, 621, 711
Cui, Y ., Hada, K., Kawashima, T., et al. 2023, Nature, 621, 711
2023
-
[14]
2019, Astron
Davelaar, J., Olivares, H., Porth, O., et al. 2019, Astron. Astrophys., 632, A2
2019
-
[15]
C., & Agol, E
Dexter, J., McKinney, J. C., & Agol, E. 2012, Mon. Not. R. Astron. Soc., 421, 1517 EHT Collaboration, Akiyama, K., Alberdi, A., et al. 2024, A&A, 681, A79 EHT Collaboration, Akiyama, K., Alberdi, A., et al. 2019a, Astrophys. J. Lett., 875, L1 EHT Collaboration, Akiyama, K., Alberdi, A., et al. 2019b, Astrophys. J. Lett., 875, L5 EHT Collaboration, Akiyama...
2012
-
[16]
Fishbone, L. G. & Moncrief, V . 1976, Astrophys. J., 207, 962
1976
-
[17]
Font, J. A. & Daigne, F. 2002, Astrophys. J, 581, L23
2002
-
[18]
M., Cruz-Osorio, A., Mizuno, Y ., et al
Fromm, C. M., Cruz-Osorio, A., Mizuno, Y ., et al. 2022, A&A, 660, A107
2022
-
[19]
2013, Astrophys
Hada, K., Kino, M., Doi, A., et al. 2013, Astrophys. J., 775, 70
2013
-
[20]
Kawazura, Y ., Barnes, M., & Schekochihin, A. A. 2019, Proceedings of the Na- tional Academy of Science, 116, 771
2019
-
[21]
Y ., Krichbaum, T
Kim, J. Y ., Krichbaum, T. P., Lu, R. S., et al. 2018, Astron. Astrophys., 616, A188
2018
-
[22]
& Fichtner, H., eds
Lazar, M. & Fichtner, H., eds. 2021, Astrophysics and Space Science Library, V ol. 464, Kappa Distributions; From Observational Evidences via Controver- sial Predictions to a Consistent Theory of Nonequilibrium Plasmas
2021
-
[23]
P., et al
Lu, R.-S., Asada, K., Krichbaum, T. P., et al. 2023, Nature, 616, 686
2023
-
[24]
2023, ApJ, 944, 122
Meringolo, C., Cruz-Osorio, A., Rezzolla, L., & Servidio, S. 2023, ApJ, 944, 122
2023
-
[25]
P., Walker, R
Mertens, F., Lobanov, A. P., Walker, R. C., & Hardee, P. E. 2016, Astron. Astro- phys., 595, A54
2016
-
[26]
M., Younsi, Z., et al
Mizuno, Y ., Fromm, C. M., Younsi, Z., et al. 2021, MNRAS, 506, 741 4 https://bhac.science/ 5 https://achael.github.io/eht-imaging/ Article number, page 12 of 15 Christian M. Fromm et al.: Probing radiation micro-physics in M 87 Mo´scibrodzka, M. 2025, ApJ, 981, 145 Mo´scibrodzka, M., Falcke, H., & Shiokawa, H. 2016, Astron. Astrophys., 586, A38
2021
-
[27]
2018, ApJ, 868, 146
Nakamura, M., Asada, K., Hada, K., et al. 2018, ApJ, 868, 146
2018
-
[28]
M., et al
Olivares, H., Younsi, Z., Fromm, C. M., et al. 2020, Mon. Not. R. Astron. Soc., 497, 521
2020
-
[29]
Pandya, A., Zhang, Z., Chandra, M., & Gammie, C. F. 2016, Astrophys. J., 822, 34
2016
-
[30]
2019, arXiv e-prints, arXiv:1904.04923
Porth, O., Chatterjee, K., Narayan, R., et al. 2019, arXiv e-prints, arXiv:1904.04923
Pith/arXiv arXiv 2019
-
[31]
2017, Computational Astrophysics and Cosmology, 4, 1
Porth, O., Olivares, H., Mizuno, Y ., et al. 2017, Computational Astrophysics and Cosmology, 4, 1
2017
-
[32]
& Zanotti, O
Rezzolla, L. & Zanotti, O. 2013, Relativistic Hydrodynamics (Oxford, UK: Ox- ford University Press)
2013
-
[33]
W., et al
Ro, H., Kino, M., Sohn, B. W., et al. 2023, A&A, 673, A159
2023
-
[34]
E., Sironi, L., & Narayan, R
Rowan, M. E., Sironi, L., & Narayan, R. 2017, ApJ, 850, 29
2017
-
[35]
& Spitkovsky, A
Sironi, L. & Spitkovsky, A. 2009, ApJ, 698, 1523
2009
-
[36]
Tchekhovskoy, A., Narayan, R., & McKinney, J. C. 2011, Mon. Not. R. Astron. Soc., 418, L79
2011
-
[37]
C., Hardee, P
Walker, R. C., Hardee, P. E., Davies, F. B., Ly, C., & Junor, W. 2018, Astrophys. J., 855, 128
2018
-
[38]
N., Ryan, B
Yarza, R., Wong, G. N., Ryan, B. R., & Gammie, C. F. 2020, Astrophys. J., 898, 50
2020
-
[39]
M., & Olivares, H
Younsi, Z., Porth, O., Mizuno, Y ., Fromm, C. M., & Olivares, H. 2020, in Perseus in Sicily: From Black Hole to Cluster Outskirts, ed. K. Asada, E. de Gouveia Dal Pino, M. Giroletti, H. Nagai, & R. Nemmen, V ol. 342, 9–12
2020
-
[40]
Zhang, M., Mizuno, Y ., Dihingia, I. K., et al. 2026, arXiv e-prints, arXiv:2605.15502
Pith/arXiv arXiv 2026
-
[41]
=0.0 500µas
Zhang, M., Mizuno, Y ., Fromm, C. M., Younsi, Z., & Cruz-Osorio, A. 2024, A&A, 687, A88 Article number, page 13 of 15 A&A proofs:manuscript no. main12page_refV1 Appendix A: Differences in turnover values across heatings and eDFs The detailed differences across heating and eDF are presented in Fig. A.1 and A.2. From the difference plots (third column in Fi...
2024
discussion (0)
Sign in with ORCID, Apple, or X to comment. Anyone can read and Pith papers without signing in.