REVIEW 4 major objections 8 minor 55 references
Vision-language models can read common ER diagram parts but collapse on weak entities, multivalued attributes, and N-ary relationships.
Reviewed by Pith at T0; open to challenge. T0 means a machine referee read the full paper against a public rubric. the ladder, T0–T4 →
T0 review · grok-4.5
2026-07-31 07:12 UTC pith:EKWSU5AO
load-bearing objection Solid first ER/EER schema-recovery benchmark; the EER failure profile holds, but the abstract’s 15–25% reasoning gain is mostly a synthetic-tier story. the 4 major comments →
ERUnderstand: Evaluating Vision-Language Models on Structured ER Diagrams
The pith
A machine-rendered reading of the paper's core claim, the machinery that carries it, and where it could break.
Core claim
On a 2,960-diagram benchmark with machine-readable JSON ground truth, state-of-the-art vision-language models recover common ER elements at high F1 but drop to roughly 0.28 on weak entities, 0.14 on multivalued attributes, and 0.07 on N-ary relationships; reasoning models lift overall Macro-F1 by about 15–25 percent yet remain sensitive to linguistic priors, spatial layout bias, and rising diagram complexity.
What carries the argument
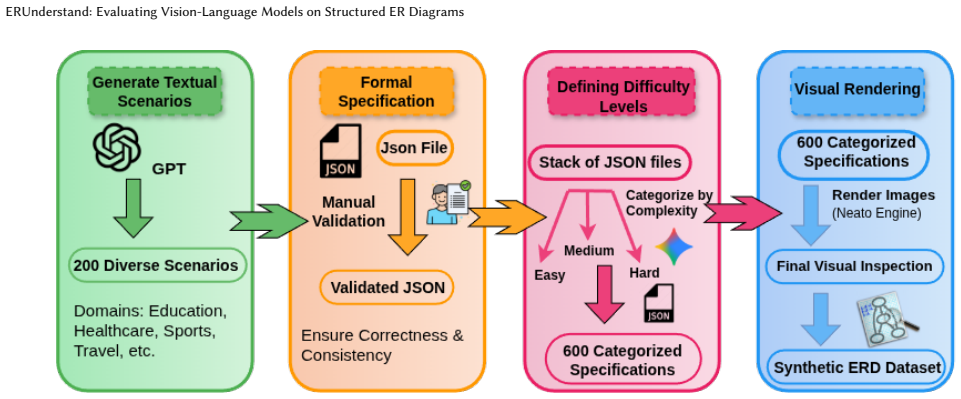
ERUnderstand: a three-source corpus (curated educational diagrams, production schemas, and LLM-assisted Graphviz synthetics) paired with a unified JSON schema and a structure-aware fractional F1 that scores entities, relationships, attributes, keys, weak constructs, inheritance, and higher-arity links with partial credit for misconnections.
Load-bearing premise
The ranking and failure diagnosis rest on a single fixed partial-credit F1 with greedy label matching and one zero-temperature prompt template, without a classical shape-and-OCR parser baseline on the same target.
What would settle it
Run the released evaluation toolkit on the same 2,960 images with a classical detector-plus-heuristic ER parser (or a different matching/partial-credit scheme) and check whether the same element-wise gaps and model orderings still appear.
If this is right
- AI database assistants cannot yet treat textbook or slide ER images as reliable executable schemas without human checking.
- Progress on multimodal schema recovery will be measured by gains on weak entities, multivalued/derived attributes, and N-ary and IS-A structure, not only entity/attribute OCR.
- Synthetic controllable generators become a standard stress test for spatial connectivity and notation sensitivity in VLMs.
- Reasoning-time methods help but do not remove dependence on name priors or collapse under dense layouts.
- The same JSON-plus-fractional-F1 protocol can be extended to UML class diagrams and property-graph schemas.
Where Pith is reading between the lines
- Closing the gap likely needs architectures that explicitly model edge connectivity and line-style notation, not only larger multimodal pretraining.
- Interactive multi-turn prompting can recover omissions but will not fix systematic miswiring, so product pipelines still need verification layers.
- Because production relational dumps lack EER constructs by construction, benchmarks built only from DDL will overstate readiness for conceptual modeling tasks.
Editorial analysis
A structured set of objections, weighed in public.
Referee Report
Summary. The paper introduces ERUnderstand, a benchmark of 2,960 ER diagrams from three sources (740 curated educational renderings, 179 production database schemas, 2,041 LLM-assisted synthetic diagrams), each paired with a standardized JSON representation, plus a structure-aware fractional-F1 scoring toolkit. Ten VLMs are evaluated under a fixed zero-temperature prompt. The main findings: models recover entities/attributes/relationships well (F1 often 0.74–1.00) but fail on weak entities (0.28), multivalued attributes (0.14), N-ary relationships (0.07), and IS-A hierarchies; a set of controlled probes (context-free labels, label permutation, IS-A-only diagrams, PK naming vs. visual cues, 20+-entity diagrams, interactive prompting) diagnoses spatial-proximity bias, reliance on linguistic priors over diagram structure, and complexity collapse. The abstract and conclusion headline that reasoning-augmented models improve Macro-F1 by 15–25%.
Significance. If the results hold, this is a useful and well-resourced contribution. ERDs are a natural testbed for visual-structural reasoning, and ERUnderstand is, to my knowledge, the first benchmark to pair ERD images with executable-schema JSON ground truth at this scale (2,960 diagrams, ~17k entities), with public release of data, evaluation toolkit, and generation code. The controlled probes (context-free labels, label permutation, IS-A-only diagrams, PK naming vs. underline, high-density stress set) are genuinely diagnostic and largely independent of the main scoring pipeline, and the failure-mode findings — spatial proximity bias, reliance on naming conventions over visual notation, collapse on 20+-entity diagrams — are valuable to both the VLM and database communities. Honest touches strengthen credibility: the sensitivity analysis over the partial-credit weight (§B.3), the valid-JSON coverage audit (§B.2), and the explicit note that the released annotations are adjudicated rather than double-annotated (§A.2). The failure-mode conclusions would survive even if the headline aggregate numbers were qualified, which is the right sign of a benchmark paper whose durable contribution is the资源
major comments (4)
- [Abstract, §6, Table 2] Abstract/§7 vs. Table 2: the headline claim that reasoning-augmented models improve Macro-F1 by 15–25% is tier-dependent. From Table 2's own averages the gain is +0.15/+0.29/+0.28 on the synthetic Easy/Med/Hard tiers and roughly +0.08–0.12 on curated tiers, but only +0.013 (0.735→0.748) on the Schema tier — the only tier of real production schemas. The synthetic tier dominates the benchmark (2,041 of 2,960 diagrams) and is produced by a single LLM-assisted Graphviz pipeline whose regularities the paper itself documents: §D.8 shows synthetic PKs uniformly follow the _id convention, and Appendix A.3 shows EER constructs are prompt-mandated — precisely the categories where reasoning gains are largest in Table 3 (e.g., N-ary 0.07→0.31, IS-A 0.74→0.91). The aggregate 15–25% figure may therefore partly measure exploitation of generator regularities rather than a general ERD-understanding advan
- [§2, §4, Limitations] The related-work section highlights OmniSch as close in spirit precisely because it compares VLMs against a classical OCR/detector/heuristic baseline, yet ERUnderstand ships no non-VLM baseline at all. Without one, the reader cannot tell whether low scores such as 0.07 F1 on N-ary relationships reflect a VLM-specific structural-reasoning deficit or intrinsic difficulty of the notation/target representation, and the §1 contribution claim of 'strong baselines' is overstated — all baselines are commercial or open VLMs. A simple classical pipeline (OCR plus shape/line detection plus heuristic graph assembly) is feasible at least on the standardized Graphviz-rendered synthetic and Schema tiers and would materially strengthen the failure-mode attributions in §5. The Limitations section concedes this gap, but given the paper's central interpretive claims about 'visual-structural reasoning,' a b
- [§5, §6, Tables 2/5/7/9] Model identifiers are inconsistent across the manuscript in ways that affect reproducibility of the rankings. §5's CF/LP analysis reports 'Claude-4.5: −0.35', a model absent from Table 2; the complexity analysis in §5 cites 'Gemini-2.0' (0.428) while Table 9 attributes 0.428 to Gemini-3.0-flash; Table 7 and §D.7 include GPT-4o, GPT-5, Claude-3.5, Qwen-3, and Gemini-2.5, while Table 2 uses GPT-5.4-*, Claude-4.6-S, and Qwen-3.5; §6's GED paragraph cites 'GPT-5' but Table 5 lists both GPT-5 and GPT-5.4-pro. Please add a single table mapping every reported name to an exact model version and evaluation date, state which experiments used which versions, and give the protocol behind the §6 robustness claim ('repeated evaluations over different versions, <4%'), which currently has no supporting detail.
- [§4, Eqs. (1)–(3), §B.2] The text states that structural errors are assigned 0.5 weight 'as both False Positive and False Negative', but FN_rel in Eq. (3) includes only Rel_missed + Rel_miscon/2 — cardinality and N-ary errors are penalized on the FP side only, while TP_rel in Eq. (1) subtracts N-ary in full. The worked example in §B.2 describes one missed, one extra, one misconnected ternary, and one wrong cardinality, yet computes FP = 1 + (1+1+1)/2, which appears to count the single misconnected ternary as both Rel_miscon and N-ary. Either the equations, the prose, or the example needs correction, and the exact counting rules (what increments the N-ary term versus Rel_miscon) should be defined. This is load-bearing because the category-level F1 values in Table 3 are a central result and the inter-annotator agreement statistic (0.897) is computed with the same scorer.
minor comments (8)
- [§D.10, Table 3] §D.10 states N-ary performance remains 'below 0.01 F1 for non-reasoning models', but Table 3 reports 0.07 (and §6 says 'below 0.1'). Please reconcile.
- [Appendix D, Figure 5, §5] The final line of Appendix D reads 'Sections 5 through 5' — presumably a different range was intended. Also 'Label Perumutation' in Figure 5's legend and 'random random 4-letter strings' in §5.
- [§5, Tables 7–9] Several controlled probes use small samples (19 high-density diagrams, 32 IS-A-only, 30 for interactive prompting, 200 for CF/LP) with no variance or confidence intervals reported. Given that per-diagram F1 is the unit of analysis, reporting standard errors (or bootstrap CIs) for the headline deltas in Figure 5 and Tables 7–9 would strengthen the claims.
- [Appendix A.3] Appendix A.3 states 'each generated JSON was manually validated' for 2,041 synthetic diagrams. Please clarify the validation procedure — full manual inspection of all 2,041 seems implausible; if a sample was audited, give the sample size and acceptance rate.
- [§A.2, Table 4] The double-annotation pilot is commendably honest, but 21 of 30 diagrams requiring correction is substantial. Please discuss what this implies for residual noise in the released (split-annotation plus adjudication) ground truth, and report per-category agreement, not only overall Macro-F1.
- [References] References [38] and [39] are the same FlowLearn paper listed twice; [47] and [48] are the same Thalheim book listed twice. Also [8] is titled 'Claude 3.7 Sonnet' while the text evaluates Claude-4.6.
- [§6] The reasoning/non-reasoning split (GLM-4.5 open-source counted as reasoning; GPT-5.4-chat vs GPT-5.4-pro) rests on the vague criterion 'explicit reasoning or reinforcement-based inference mechanisms'. Please give an operational definition, since the 15–25% claim depends entirely on this grouping.
- [§5, Figure 3] Figure 3(b)'s attention-map evidence is suggestive but drawn from a single query on a single model (Qwen). Either temper the causal language ('The model fails to attend...') or note explicitly that this is illustrative rather than systematic evidence.
Circularity Check
No significant circularity: empirical VLM benchmark with independent ground truth and external model evaluation.
full rationale
ERUnderstand is a benchmark-and-evaluation paper, not a first-principles derivation. Load-bearing claims are measured Macro-F1/BLEU/GED of external VLMs against independently annotated curated JSON, DDL-derived production schemas, and synthetic JSON rendered via Graphviz. Synthetic generation is distribution-inspired by curated stats and uses fixed seeds, but model scores are not fitted parameters renamed as predictions, nor are headline F1 gaps forced by construction from the generator inputs. Failure-mode probes (context-free/label-permutation naming, IS-A-only diagrams, PK cue removal, interactive prompting) are external interventions that can and do degrade performance. Self-citations are absent as load-bearing uniqueness or ansatz justifications; related-work citations are to prior diagram/VLM benchmarks and classical ER modeling. Concerns that the 15–25% reasoning gain is tier-dependent (large on synthetic, ~2% on Schema) are validity/generalization issues, not circular reduction of outputs to inputs. Derivation chain is self-contained empirical measurement; score 0.
Axiom & Free-Parameter Ledger
free parameters (2)
- partial_credit_weight_f for structural misconnections =
0.5 (default)
- difficulty thresholds and EER injection rates in synthetic generator =
Easy ≤4 ents/rels; Medium 5+; Hard 7+; High IS-A 20+ / 30+ entities in special prompts
axioms (5)
- domain assumption Standardized JSON with entities dict + relationships array uniquely and adequately encodes ER/EER semantics needed for 'executable schema' recovery.
- ad hoc to paper Greedy label similarity matching after punctuation/case normalization is sufficient to align predicted vs gold elements before structural scoring.
- ad hoc to paper Zero-temperature, single-template constrained JSON prompting fairly represents VLM capability (vs interactive or tool-augmented agents).
- domain assumption LLM-assisted Graphviz synthetic schemas, after manual validation, are valid stress tests that do not artifactually create the reported failure modes.
- ad hoc to paper Macro-F1 over element categories (unweighted) is the right headline aggregate versus frequency-weighted F1.
invented entities (2)
-
ERUnderstand benchmark (2,960 paired ERD images + JSON + fractional F1 toolkit)
independent evidence
-
Fractional structure-aware F1 with half-credit for misconnected/cardinality/N-ary errors
no independent evidence
read the original abstract
Entity-Relationship Diagrams (ERDs) are central to conceptual database design, yet they are typically available only as rendered images rather than machine-readable schemas, limiting AI-assisted database engineering. We introduce ERUnderstand, the first large-scale benchmark for structured understanding of ER diagrams, comprising 2,960 diagrams collected from curated educational sources, real-world schemas, and synthetically generated examples spanning diverse domains, notations, complexity levels, and Extended Entity-Relationship (EER) constructs. Each diagram is paired with a standardized machine-readable representation for fine-grained evaluation of schema elements. Evaluating state-of-the-art Vision-Language Models (VLMs), we find that while common ERD elements are recovered reliably (F1 > 0.74), performance drops sharply on weak entities (as low as 0.28 F1), multivalued attributes (0.14 F1), and N-ary relationships (0.07 F1). Reasoning-augmented models improve overall performance by 15-25% but remain sensitive to linguistic priors and increasing diagram complexity. ERUnderstand provides a standardized benchmark for evaluating multimodal understanding of conceptual database schemas. The benchmark, dataset, evaluation toolkit, and generation code are publicly available at https://github.com/salinaria/ERUnderstand.
Figures



Reference graph
Works this paper leans on
-
[1]
Josh Achiam, Steven Adler, Sandhini Agarwal, Lama Ahmad, Ilge Akkaya, Floren- cia Leoni Aleman, Diogo Almeida, Janko Altenschmidt, Sam Altman, Shyamal Anadkat, et al. 2023. Gpt-4 technical report.arXiv preprint arXiv:2303.08774 (2023)
Pith/arXiv arXiv 2023
-
[2]
Estelle Aflalo, Meng Du, Shao-Yen Tseng, Yongfei Liu, Chenfei Wu, Nan Duan, and Vasudev Lal. 2022. VL-InterpreT: An Interactive Visualization Tool for Inter- preting Vision-Language Transformers. InProceedings of the IEEE/CVF Conference on Computer Vision and Pattern Recognition (CVPR). 21406–21415
2022
-
[3]
Google AI. [n. d.]. Gemini Language Model. Accessed May 5, 2025
2025
-
[4]
1996.Logical reasoning with diagrams
Gerard Allwein and Jon Barwise. 1996.Logical reasoning with diagrams. Oxford University Press
1996
-
[5]
M Angelaccio, T Catarci, and G Santucci. 1990. Query by Diagram: A fully visual query system.Journal of Visual Languages & Computing1, 3 (1990), 255–273
1990
-
[6]
Renzo Angles, Angela Bonifati, Stefania Dumbrava, George Fletcher, Alastair Green, Jan Hidders, Bei Li, Leonid Libkin, Victor Marsault, Wim Martens, et al
-
[7]
Anonymous. 2025. Visual Structures Helps Visual Reasoning: Addressing the Binding Problem in VLMs.arXiv preprint arXiv:2506.22146(2025)
arXiv 2025
-
[8]
Anthropic. 2025. Claude 3.7 Sonnet. Large language model
2025
-
[9]
Abdul Arbaz, Heng Fan, Junhua Ding, Meikang Qiu, and Yunhe Feng. 2024. GenFlowchart: parsing and understanding flowchart using generative AI. In International Conference on Knowledge Science, Engineering and Management. Springer, 99–111
2024
-
[10]
Jon Barwise and John Etchemendy. 1995. Heterogeneous Logic.Diagrammatic reasoning: Cognitive and computational perspectives(1995), 211–234
1995
-
[11]
Nimo Beeren and George Fletcher. 2023. A Formal Design Framework for Practical Property Graph Schema Languages.. InEDBT. 478–484
2023
-
[12]
2009.Natural language processing with Python: analyzing text with the natural language toolkit
Steven Bird, Ewan Klein, and Edward Loper. 2009.Natural language processing with Python: analyzing text with the natural language toolkit. O’Reilly Media, Inc
2009
-
[13]
Boyuan Chen et al. 2024. SpatialVLM: Endowing Vision-Language Models with Spatial Reasoning Capabilities.arXiv preprint arXiv:2401.12168(2024)
Pith/arXiv arXiv 2024
-
[14]
Peter Pin-Shan Chen. 1976. The entity-relationship model—toward a unified view of data.ACM transactions on database systems (TODS)1, 1 (1976), 9–36
1976
-
[15]
Xuweiyi Chen, Ziqiao Ma, Xuejun Zhang, Sihan Xu, Shengyi Qian, Jianing Yang, David Fouhey, and Joyce Chai. 2024. Multi-object hallucination in vision language models.Advances in Neural Information Processing Systems37 (2024), 44393–44418
2024
-
[16]
Peter C-H Cheng. 2002. Electrifying diagrams for learning: principles for complex representational systems.Cognitive Science26, 6 (2002), 685–736
2002
-
[17]
Nancy Chinchor and Beth Sundheim. 1993. MUC-5 evaluation metrics. In Proceedings of the 5th Conference on Message Understanding(Baltimore, Mary- land)(MUC5 ’93). Association for Computational Linguistics, USA, 69–78. doi:10.3115/1072017.1072026
arXiv 1993
-
[18]
Xiang Deng, Huan Sun, Chenyan Xiong, Yuxuan Liang, Jordan Boyd-Graber, and Yu Su. 2021. TURL: Table Understanding through Representation Learning.Proc. VLDB Endow.14, 3 (2021), 307–319
2021
-
[19]
Xinbo Gao, Bing Xiao, Dacheng Tao, and Xuelong Li. 2010. A survey of graph edit distance.Pattern Anal. Appl.13, 1 (Feb. 2010), 113–129
2010
-
[20]
Wolfgang Gatterbauer. 2011. Databases will visualize queries too.Proceedings of the VLDB Endowment4, 12 (2011), 1498–1501
2011
-
[21]
Fausto Giunchiglia and Toby Walsh. 1992. A Theory of Abstraction.Artificial Intelligence57, 2-3 (1992), 323–389
1992
-
[22]
Eric Hammer. 1995. Logic and visual information. (1995)
1995
-
[23]
Yifan Hou, Buse Giledereli, Yilei Tu, and Mrinmaya Sachan. 2024. Do Vision-Language Models Really Understand Visual Language?arXiv preprint arXiv:2410.00193(2024)
Pith/arXiv arXiv 2024
-
[24]
Cheng-Yu Hsu et al. 2023. Can Visual Scratchpads With Diagrammatic Abstrac- tions Augment LLM Reasoning?. InProceedings of the Conference on Empirical Methods in Natural Language Processing
2023
-
[25]
Lei Huang, Weijiang Yu, Weitao Ma, Weihong Zhong, Zhangyin Feng, Haotian Wang, Qianglong Chen, Weihua Peng, Xiaocheng Feng, Bing Qin, et al. 2025. A survey on hallucination in large language models: Principles, taxonomy, chal- lenges, and open questions.ACM Transactions on Information Systems43, 2 (2025), 1–55
2025
-
[26]
2001.Mathematical reasoning with diagrams
Mateja Jamnik. 2001.Mathematical reasoning with diagrams. University of Chicago Press Chicago
2001
-
[27]
Saehan Jo and Immanuel Trummer. 2024. ThalamusDB: Approximate Query Processing on Multi-Modal Data.Proc. ACM Manag. Data2, 3, Article 186 (May 2024), 26 pages
2024
-
[28]
Jill H Larkin and Herbert A Simon. 1987. Why a diagram is (sometimes) worth ten thousand words.Cognitive science11, 1 (1987), 65–100
1987
-
[29]
Viktor Leis, Andrey Gubichev, Atanas Mirchev, Peter Boncz, Alfons Kemper, and Thomas Neumann. 2025. Still Asking: How Good Are Query Optimizers, Really? Proceedings of the VLDB Endowment18, 12 (2025), 5531–5536
2025
-
[30]
Konstantinos Leventidis, Ayush Agarwal, Muhammad Saleem, and Wolfgang Gatterbauer. 2020. QueryVis: Logic-based diagrams help users understand com- plicated SQL queries faster. InProceedings of the International Conference on Management of Data (SIGMOD). ACM, 1901–1916
2020
-
[31]
Guoliang Li, Xuanhe Zhou, and Xinyang Zhao. 2024. Llm for data management. Proceedings of the VLDB Endowment17, 12 (2024), 4213–4216
2024
-
[32]
Pan Lu, Liang Qiu, Jiaqi Chen, Tony Xia, Yizhou Zhao, Wei Zhang, Zhou Yu, Xiaodan Liang, and Song-Chun Zhu. 2021. Iconqa: A new benchmark for ab- stract diagram understanding and visual language reasoning.arXiv preprint arXiv:2110.13214(2021)
Pith/arXiv arXiv 2021
-
[33]
Potsawee Manakul, Adian Liusie, and Mark JF Gales. 2023. Selfcheckgpt: Zero- resource black-box hallucination detection for generative large language models. arXiv preprint arXiv:2303.08896(2023)
Pith/arXiv arXiv 2023
-
[34]
Junbo Niu, Zheng Liu, Zhuangcheng Gu, Bin Wang, Linke Ouyang, Zhiyuan Zhao, Tao Chu, Tianyao He, Fan Wu, Qintong Zhang, et al. 2025. Mineru2. 5: A decoupled vision-language model for efficient high-resolution document parsing. InThe 64th Annual Meeting of the Association for Computational Linguistics– Industry Track
2025
-
[35]
OpenAI. 2023. ChatGPT Large Language Model. Accessed: 2025-04-05
2023
-
[36]
Linke Ouyang, Yuan Qu, Hongbin Zhou, Jiawei Zhu, Rui Zhang, Qunshu Lin, Bin Wang, Zhiyuan Zhao, Man Jiang, Xiaomeng Zhao, et al. 2025. Omnidocbench: Benchmarking diverse pdf document parsing with comprehensive annotations. InProceedings of the IEEE/CVF Conference on Computer Vision and Pattern Recog- nition. 24838–24848
2025
-
[37]
Jelena Ovčinňikiva, Rihards Balodis, and Guntis Barzdins. 2023. Diagrammatic Queries in ViziQuer. InProceedings of the International Conference on Conceptual Modeling (ER). Springer, 403–413
2023
-
[39]
Huitong Pan, Qi Zhang, Cornelia Caragea, Eduard Dragut, and Longin Jan Late- cki. 2024. Flowlearn: Evaluating large vision-language models on flowchart understanding. InECAI 2024. IOS Press, 73–80
2024
-
[40]
Kishore Papineni, Salim Roukos, Todd Ward, and Wei-Jing Zhu. 2002. Bleu: a method for automatic evaluation of machine translation. InProceedings of the 40th annual meeting of the Association for Computational Linguistics. 311–318
2002
-
[41]
Atsushi Shimojima. 2015. Semantic Properties of Diagrams and Their Cognitive Potentials.Studies in Logic, Language and Information(2015)
2015
-
[42]
1994.The logical status of diagrams
Sun-Joo Shin. 1994.The logical status of diagrams. Cambridge University Press
1994
-
[43]
Keng Siau. 1998. Visual object-relationship query language for user-oriented database query formulation.Journal of Computer Information Systems38, 4 (1998), 117–126
1998
-
[44]
Philipp Skavantzos and Sebastian Link. 2025. Entity/relationship graphs: Prin- cipled design, modeling, and data integrity management of graph databases. Proceedings of the ACM on Management of Data3, 1 (2025), 1–26
2025
-
[45]
Keith Stenning and Jon Oberlander. 1995. A cognitive theory of graphical and linguistic reasoning: Logic and implementation.Cognitive science19, 1 (1995), 97–140
1995
-
[46]
Gemini Team, Rohan Anil, Sebastian Borgeaud, Jean-Baptiste Alayrac, Jiahui Yu, Radu Soricut, Johan Schalkwyk, Andrew M Dai, Anja Hauth, Katie Millican, et al. 2023. Gemini: a family of highly capable multimodal models.arXiv preprint arXiv:2312.11805(2023)
Pith/arXiv arXiv 2023
-
[47]
2013.Entity-Relationship Modeling: Foundations of Database Technology
Bernhard Thalheim. 2013.Entity-Relationship Modeling: Foundations of Database Technology. Springer. doi:10.1007/978-3-642-61841-3
-
[48]
2013.Entity-relationship modeling: foundations of database technology
Bernhard Thalheim. 2013.Entity-relationship modeling: foundations of database technology. Springer Science & Business Media
2013
-
[49]
Tongyi Lab. 2023. Qwen: A Large-Scale Language Model Developed by Alibaba Cloud. Accessed: 2025-04-05
2023
-
[50]
2002.The language of graphics: A framework for the analysis of syntax and meaning in maps, charts and diagrams
Jörg von Engelhardt. 2002.The language of graphics: A framework for the analysis of syntax and meaning in maps, charts and diagrams. Yuri Engelhardt
2002
-
[51]
Shaowei Wang, Lingling Zhang, Xuan Luo, Yi Yang, Xin Hu, Tao Qin, and Jun Liu
-
[52]
xAI. 2025. Grok 3: Artificial Intelligence Language Model. Accessed: 2025-05-05
2025
-
[53]
Enming Zhang, Ruobing Yao, Huanyong Liu, Junhui Yu, and Jiale Wang. 2024. First Multi-Dimensional Evaluation of Flowchart Comprehension for Multimodal Large Language Models.arXiv preprint arXiv:2406.10057(2024)
Pith/arXiv arXiv 2024
-
[54]
Xuanhe Zhou, Chengliang Chai, Guoliang Li, and Ji Sun. 2023. Database meets AI: A survey.Journal of Database Management35, 1 (2023), 1–45. Ali Ansari, Yasmin Mohammadi, Farnoush Nili, Parsa Esmaeilkhani, Longin Jan Latecki, and Eduard Dragut A ERUnderstand Benchmark Details This appendix provides comprehensive technical specifications for the ERUnderstand...
arXiv 2023
-
[2022]
Computer science diagram understanding with topology parsing.ACM Transactions on Knowledge Discovery from Data (TKDD)16, 6 (2022), 1–20
2022
-
[2023]
Pg-schema: Schemas for property graphs.Proceedings of the ACM on Management of Data1, 2 (2023), 1–25
2023
discussion (0)
Sign in with ORCID, Apple, or X to comment. Anyone can read and Pith papers without signing in.