Mapping Interstellar Ice Inventory toward Class 0 Protostars in Star-forming Region Orion A with JWST Data
Pith reviewed 2026-06-27 16:11 UTC · model grok-4.3
The pith
Ice around six Orion protostars matches astrochemical models covering 90 percent of inventory
A machine-rendered reading of the paper's core claim, the machinery that carries it, and where it could break.
Core claim
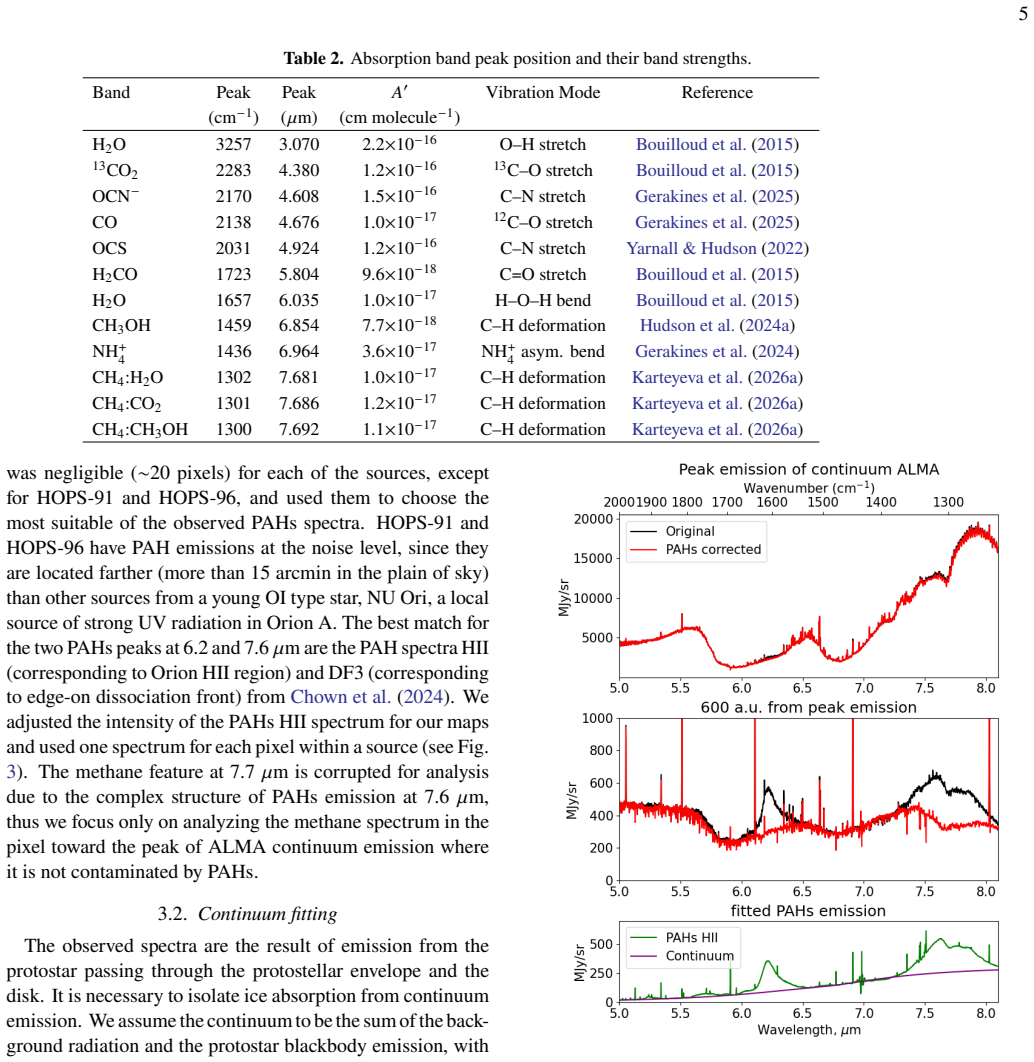
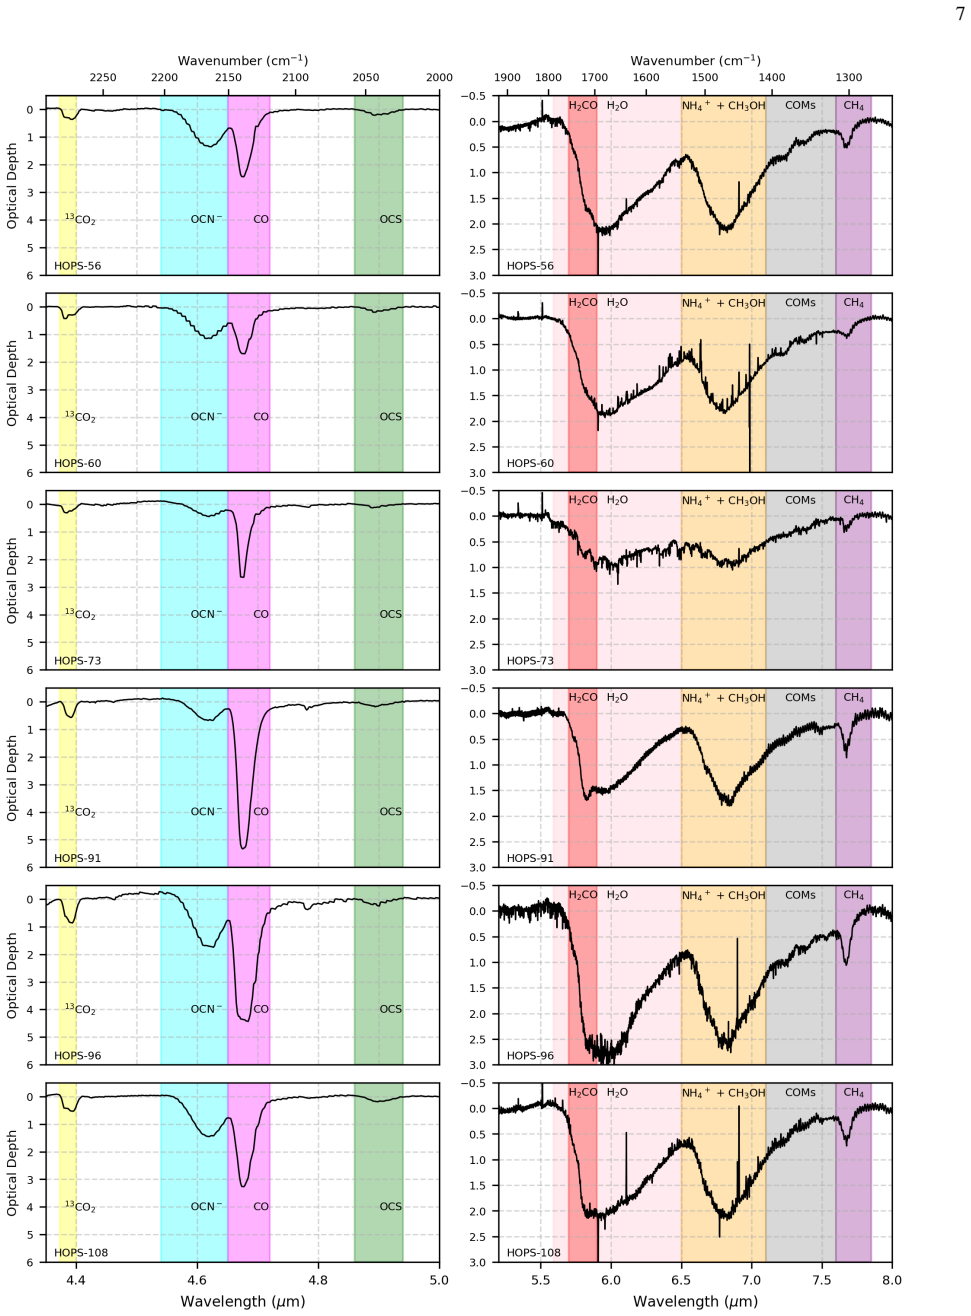
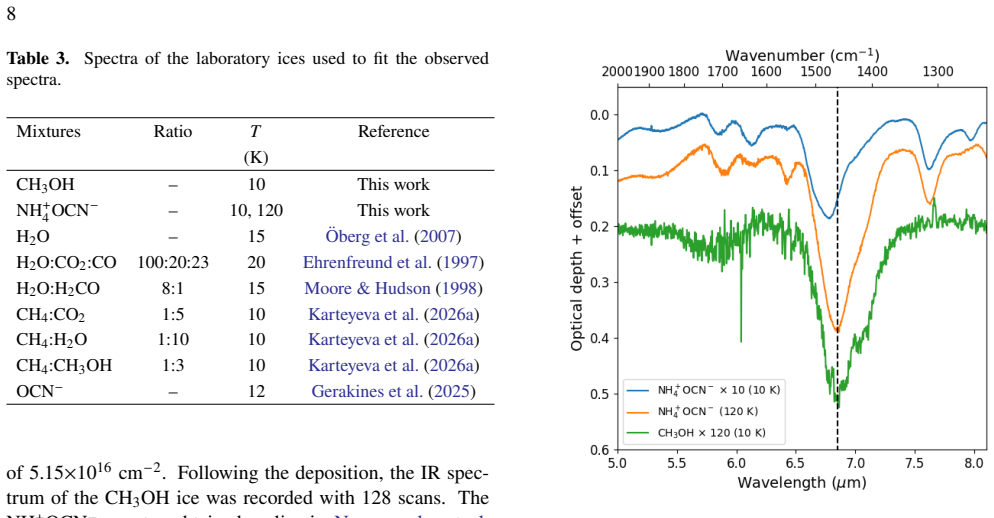
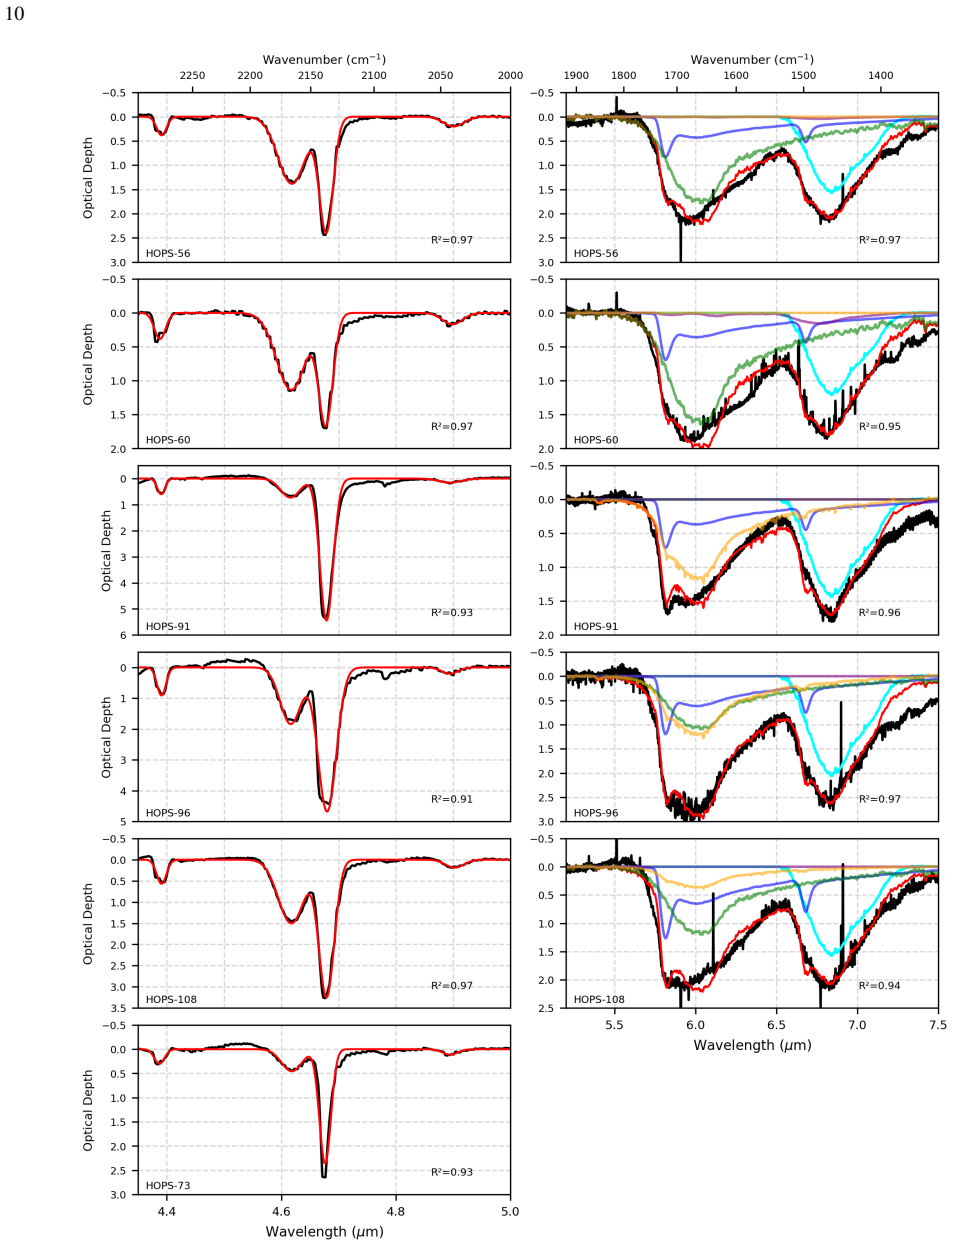
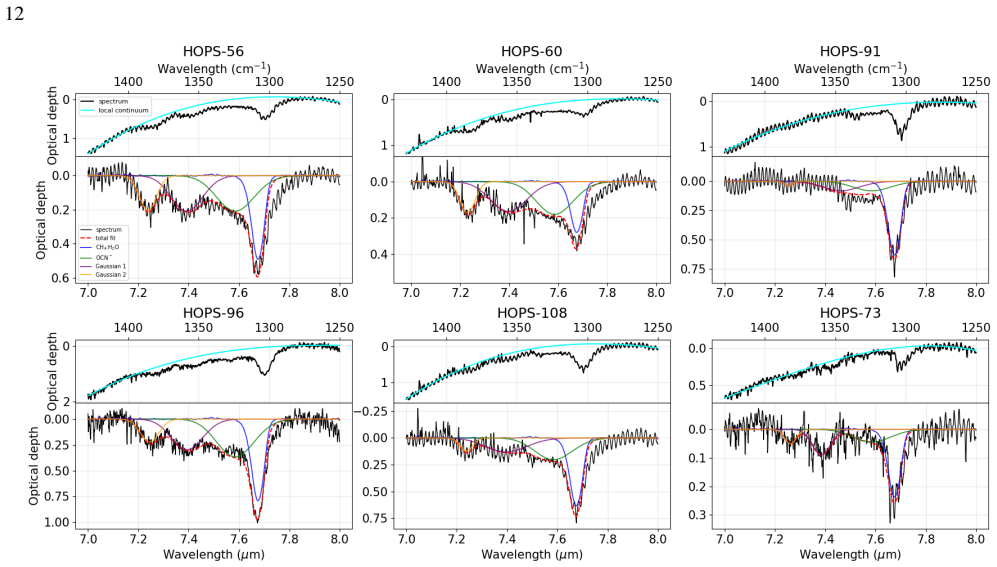
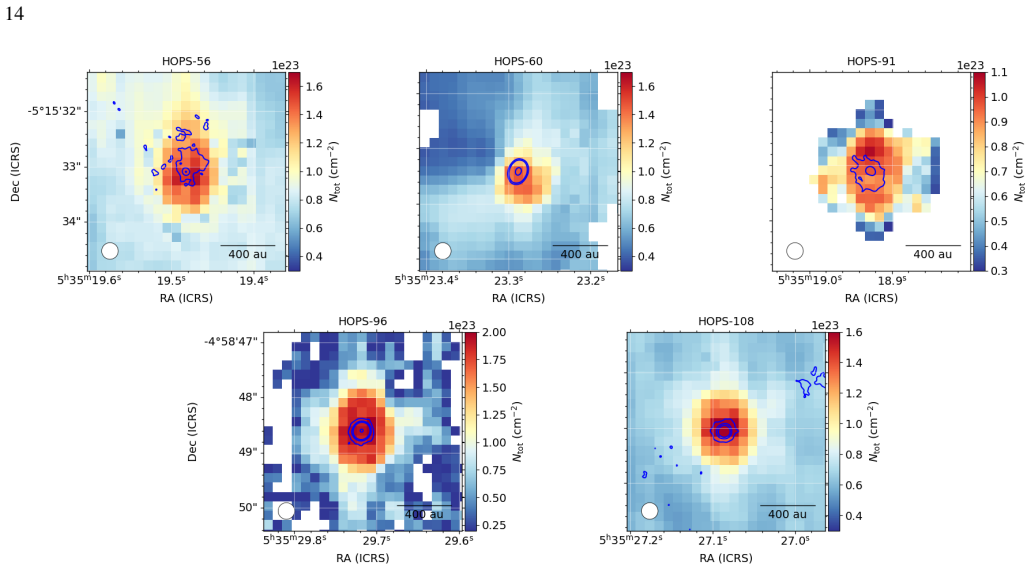
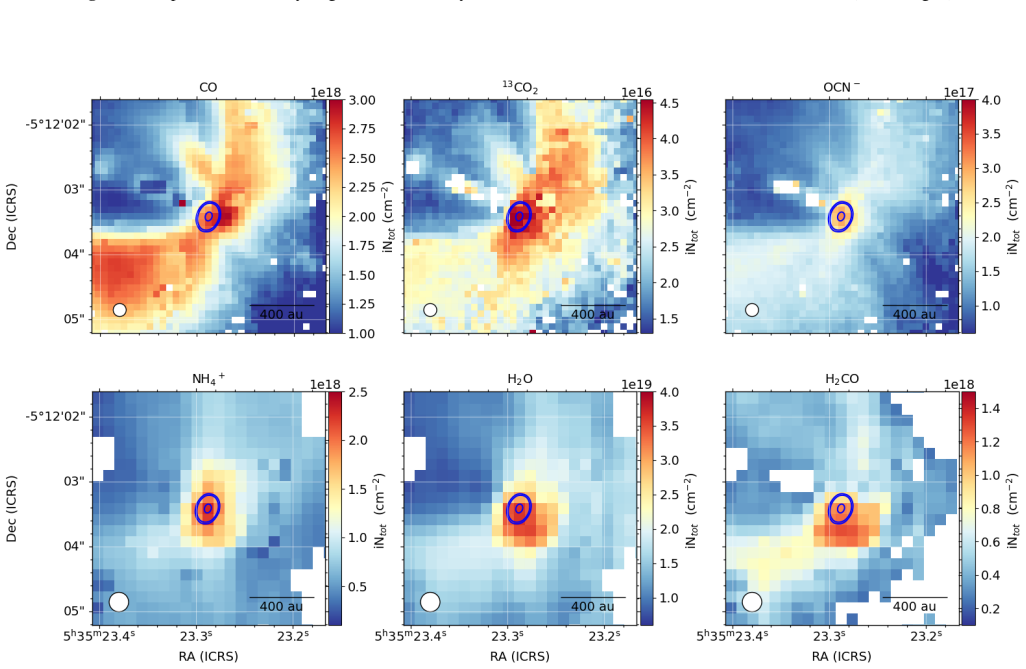
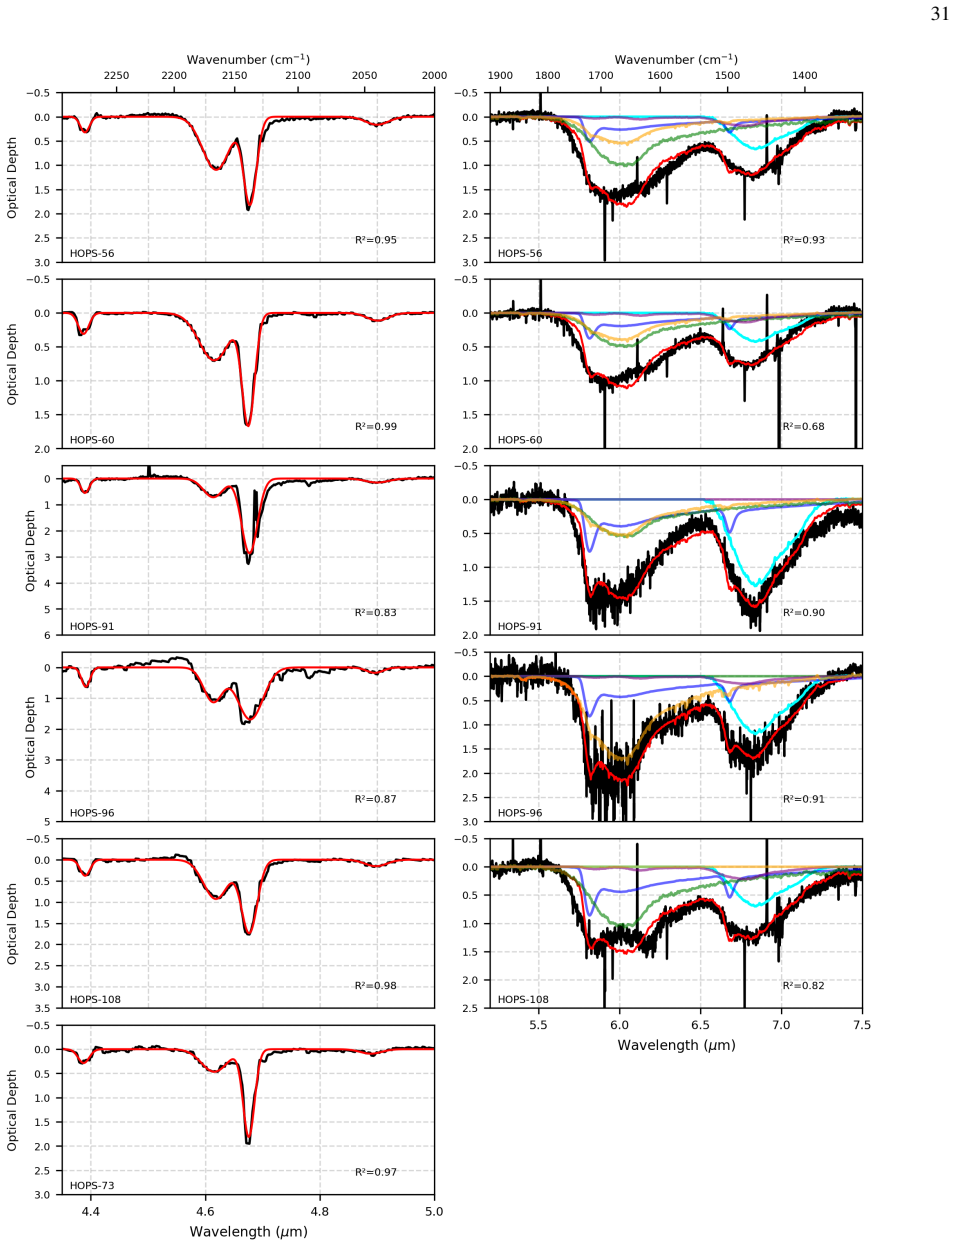
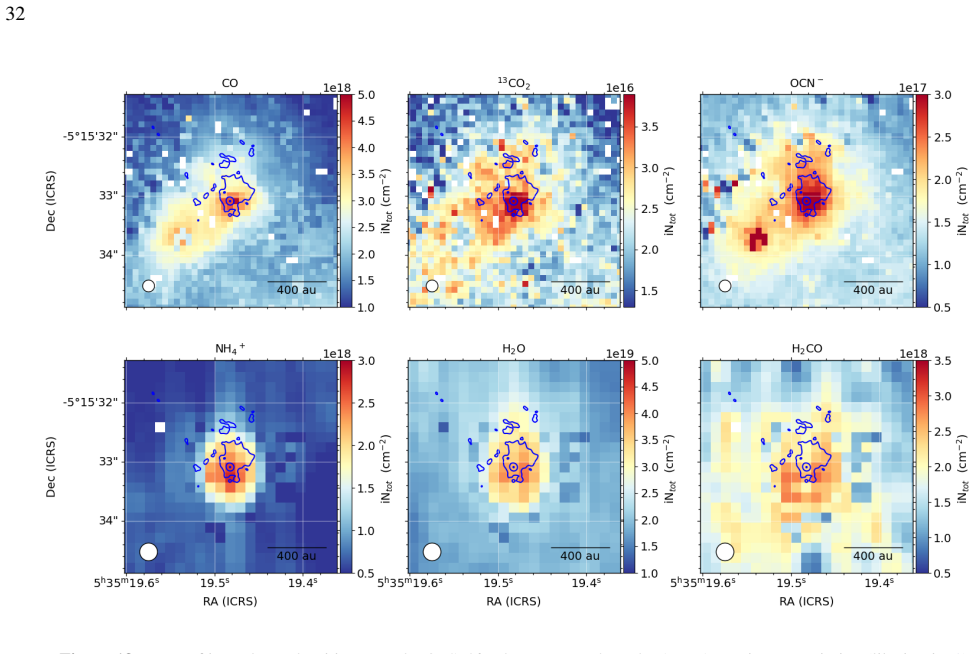
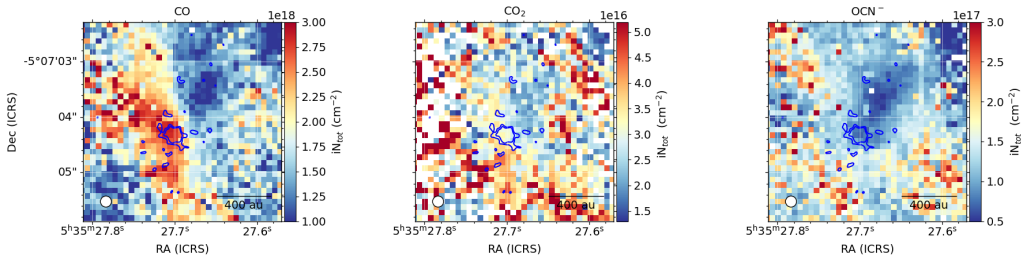
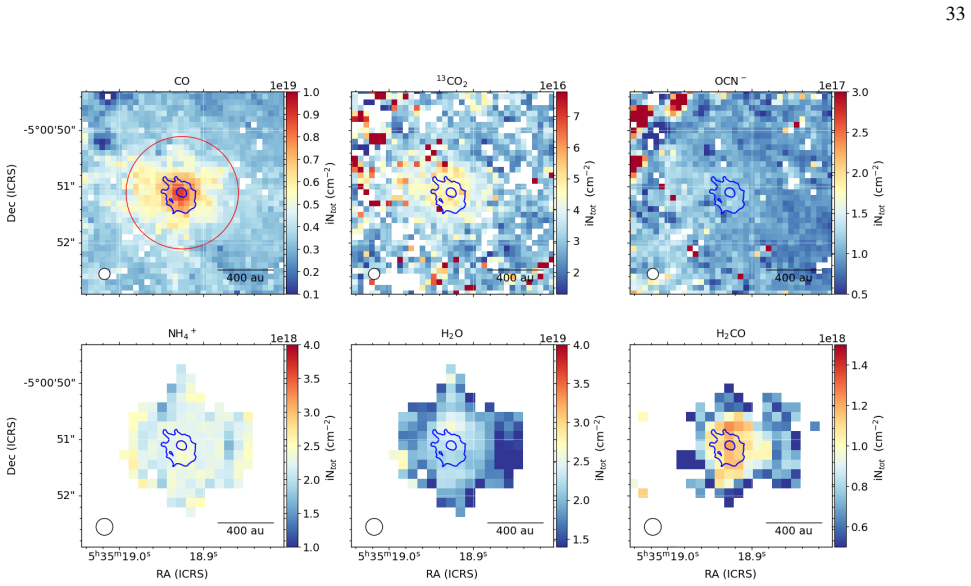
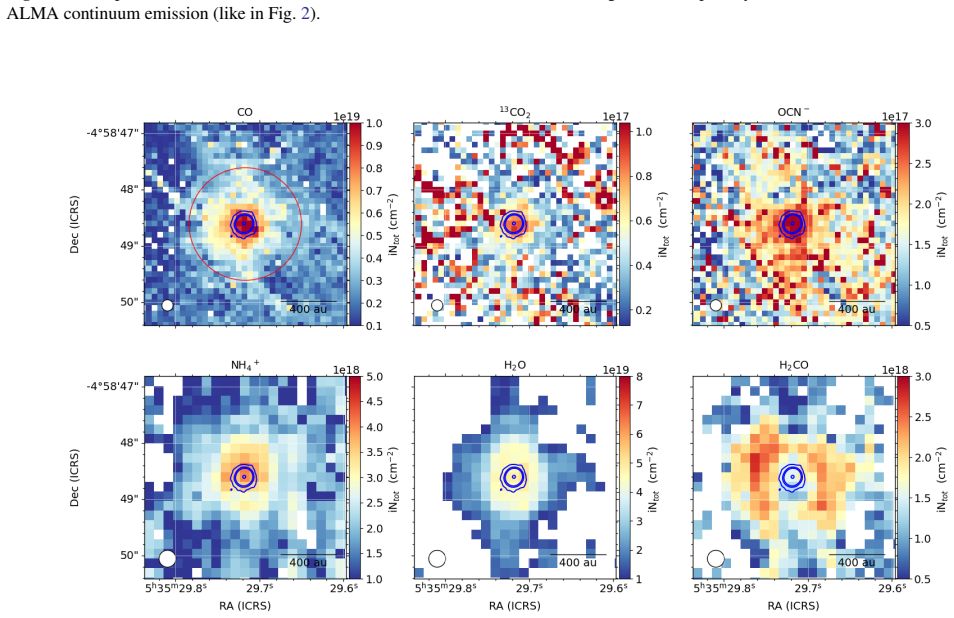
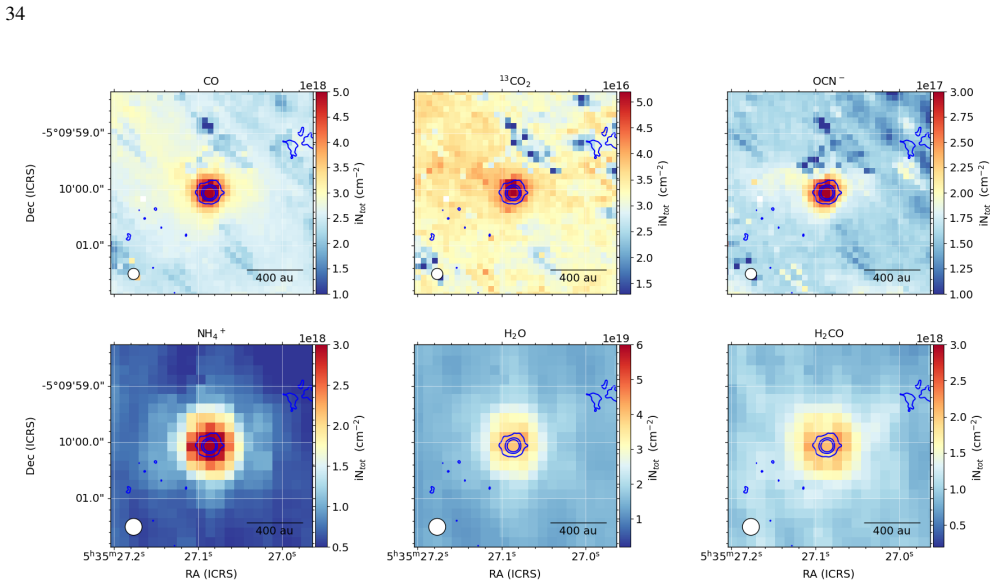
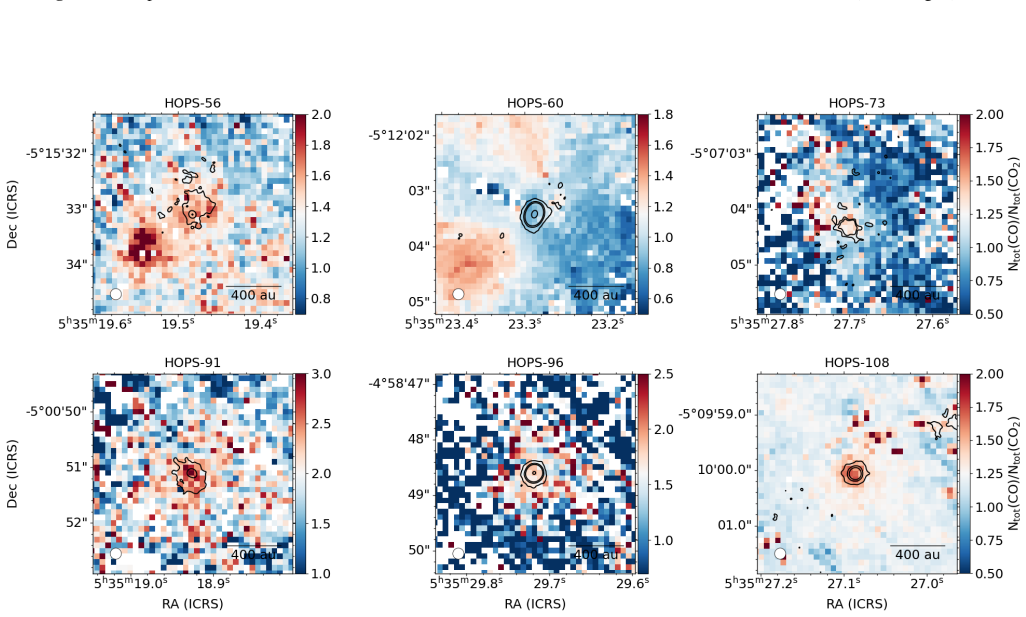
Using JWST NIRSpec and MIRI MRS data covering 4.3 to 8.1 microns, pixel-by-pixel absorption maps are built for key ice species including 13CO2, OCN-, CO, H2O, NH4+, and H2CO, with CH4 and OCS measured at continuum peaks. Column densities are derived through fits to laboratory ice analogs and validated by radiative transfer modeling of the protostellar envelopes. The total ice composition is consistent with astrochemical models and covers approximately 90 percent of the observed ice inventory, suggesting that ice is primarily formed during the prestellar stage and subsequently inherited by the protostellar envelope. The sources separate into two groups based on ice abundances relative to wate
What carries the argument
Pixel-by-pixel absorption maps at ~100 AU resolution from JWST spectra, with column densities derived by fitting laboratory ice analogs
Load-bearing premise
Laboratory ice analogs accurately represent the actual composition, structure, and temperature conditions of the interstellar ices in the protostellar envelopes
What would settle it
A measurement or model calculation showing that the fitted ice species account for substantially less than 90 percent of the total observed absorption, for example below 70 percent, would falsify the coverage claim
Figures


read the original abstract
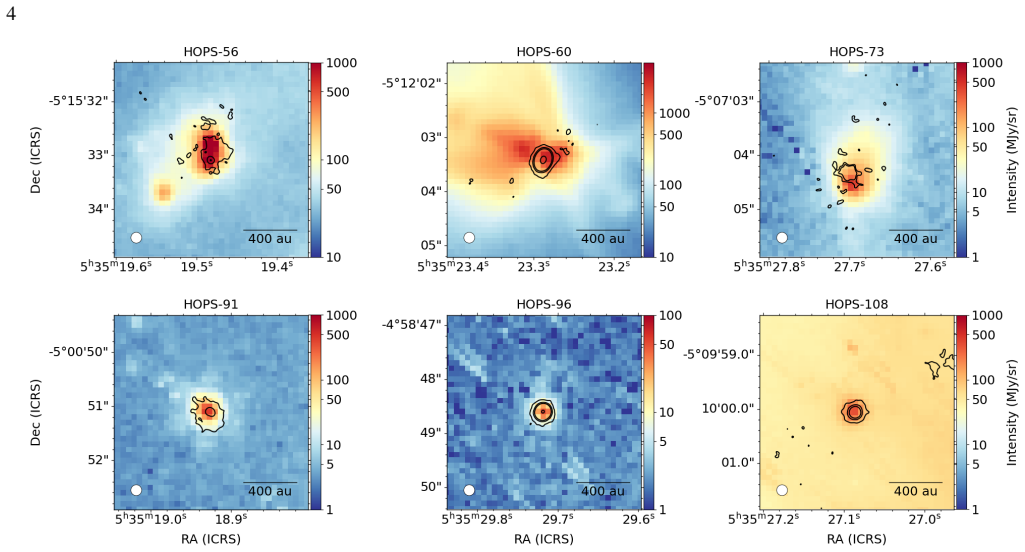
We present a detailed study of the spatial distribution and chemical composition of interstellar ices toward six Class 0 protostars (HOPS-56, HOPS-60, HOPS-73, HOPS-91, HOPS-96, and HOPS-108) in the Orion A molecular cloud. Using high-resolution spectroscopic data from the JWST NIRspec and MIRI MRS instruments (4.3 - 8.1 $\mu$m), we have constructed the first pixel by pixel absorption maps with a resolution of $\sim$100~AU for key ice species, including $^{13}$CO$_2$, OCN$^-$, CO, H$_2$O, NH$_4^+$, and H$_2$CO. CH$_4$ and OCS were analyzed toward the continuum peaks. The column densities were derived by fitting the observed spectra with laboratory ice analogs. We employed radiative transfer modeling, which confirmed the reliability of our column density estimates within the protostellar envelopes. Our analysis reveals significant variations in ice abundances and distributions, reflecting the physical structure and energetic processes within the envelopes. Specifically, we observe the influence of protostellar heating and outflows on the ice mantles, most notably in HOPS-60. The total ice composition is consistent with astrochemical models and covers $\sim$90% of observed ice inventory suggesting that ice is primarily formed during the prestellar stage and subsequently inherited by the protostellar envelope. Based on the abundance relative to water, the sources can be categorized into two distinct groups, possibly indicating evolutionary differences or variations in envelope density and temperature profiles.
Editorial analysis
A structured set of objections, weighed in public.
Referee Report
Summary. The paper reports JWST NIRSpec and MIRI MRS spectroscopy (4.3–8.1 µm) of six Class 0 protostars in Orion A. It constructs the first ~100 AU resolution pixel-by-pixel absorption maps for 13CO2, OCN–, CO, H2O, NH4+, and H2CO (with CH4 and OCS at continuum peaks), derives column densities by fitting laboratory ice analogs, and uses radiative-transfer modeling to assess reliability inside the envelopes. The total ice composition is stated to cover ~90% of the observed inventory, to be consistent with astrochemical models, and therefore to indicate that ices form primarily in the prestellar stage and are inherited by the protostellar envelope. Sources are divided into two groups on the basis of ice abundances relative to water.
Significance. If the laboratory-analog fits are shown to be robust and the ~90% coverage claim holds with quantified uncertainties, the work supplies the first spatially resolved ice maps at protostellar-envelope scales. This would furnish direct observational constraints on the timing of ice formation and on the degree of inheritance from the prestellar phase, while the two-group categorization could link ice chemistry to envelope density or evolutionary state.
major comments (3)
- [Abstract] Abstract: the central claim that the summed column densities cover ~90% of the observed ice inventory (and therefore support prestellar formation plus inheritance) is presented without reported fit residuals, reduced-χ² values, quantitative error bars on the column densities, or an explicit list of which species or wavelength regions were excluded from the sum. Because the 90% figure is obtained directly from the laboratory-analog scaling factors, the absence of these diagnostics makes the claim impossible to evaluate from the given information.
- [Abstract] Abstract (radiative-transfer paragraph): the modeling is described only as confirming that the already-derived optical depths are reliable inside the envelopes. It does not appear to test whether alternative laboratory spectra (different temperatures, H2O:CO2 mixing ratios, or matrix compositions) would systematically alter the derived columns by tens of percent; such a test is required before the 90% coverage can be treated as data-driven rather than analog-dependent.
- [Abstract] Abstract (final sentence): the division of the six sources into two groups on the basis of abundances relative to water is stated without the numerical thresholds, the specific abundance ratios used, or any statistical test showing that the grouping is significant rather than an arbitrary partition of a small sample.
minor comments (1)
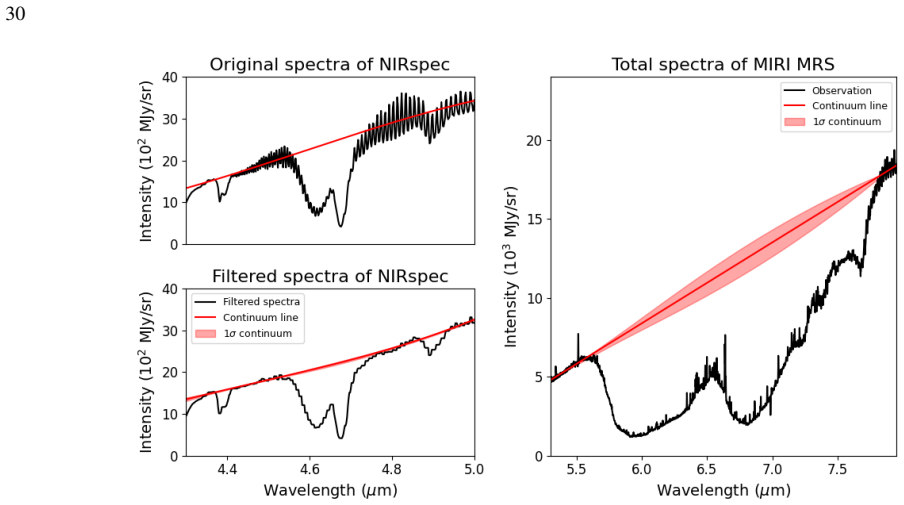
- The abstract refers to “the first pixel by pixel absorption maps” but does not specify the exact spatial sampling or the continuum-subtraction method used to generate the maps; these details belong in the methods section.
Simulated Author's Rebuttal
We thank the referee for their thorough and constructive review. We address each of the three major comments below, indicating where we will revise the manuscript to improve clarity and robustness while defending the core analysis where appropriate.
read point-by-point responses
-
Referee: [Abstract] Abstract: the central claim that the summed column densities cover ~90% of the observed ice inventory (and therefore support prestellar formation plus inheritance) is presented without reported fit residuals, reduced-χ² values, quantitative error bars on the column densities, or an explicit list of which species or wavelength regions were excluded from the sum. Because the 90% figure is obtained directly from the laboratory-analog scaling factors, the absence of these diagnostics makes the claim impossible to evaluate from the given information.
Authors: The detailed fit residuals, reduced-χ² values, column density uncertainties, and the explicit list of included species (13CO2, OCN–, CO, H2O, NH4+, H2CO, with CH4 and OCS at peaks) and wavelength regions are provided in Sections 3 and 4 of the manuscript, along with the comparison to the total observed optical depth. The abstract summarizes the result. We agree the abstract would benefit from a brief reference to these diagnostics and will revise it accordingly to state that the ~90% coverage is based on the summed laboratory-scaled columns with quantified uncertainties reported in the main text. revision: yes
-
Referee: [Abstract] Abstract (radiative-transfer paragraph): the modeling is described only as confirming that the already-derived optical depths are reliable inside the envelopes. It does not appear to test whether alternative laboratory spectra (different temperatures, H2O:CO2 mixing ratios, or matrix compositions) would systematically alter the derived columns by tens of percent; such a test is required before the 90% coverage can be treated as data-driven rather than analog-dependent.
Authors: The radiative-transfer modeling was performed to evaluate the effects of envelope density and temperature gradients on the observed absorption features and to confirm that the derived optical depths are not significantly biased by radiative transfer effects within ~100 AU scales. It was not intended to vary the laboratory ice analogs themselves. We acknowledge that a sensitivity test to alternative laboratory spectra would strengthen the robustness of the column densities and the resulting 90% claim. We will add such an analysis (or a discussion of the impact based on existing literature variations) in the revised manuscript. revision: yes
-
Referee: [Abstract] Abstract (final sentence): the division of the six sources into two groups on the basis of abundances relative to water is stated without the numerical thresholds, the specific abundance ratios used, or any statistical test showing that the grouping is significant rather than an arbitrary partition of a small sample.
Authors: The two-group division is based on the ratio of the total column density of the other ice species to the H2O column density, with a separation observed around a value of ~0.25–0.3 that aligns with differences in envelope properties. No formal statistical test (e.g., clustering significance) was applied given the sample size of six. We agree that the abstract should specify the ratio used and the approximate threshold; we will add this information and note the limited sample size in the revision. revision: yes
Circularity Check
No significant circularity: direct observational measurements
full rationale
The paper measures column densities for specific ice species by fitting JWST spectra (4.3-8.1 µm) to laboratory ice analogs, then sums the resulting columns to report that they cover ~90% of the observed inventory. This is a straightforward empirical accounting of measured quantities with no derivation step that reduces by construction to its own inputs, no fitted parameter renamed as a prediction, and no load-bearing self-citation or uniqueness claim. The consistency statement with astrochemical models is a post-hoc comparison, not a self-referential loop. The analysis remains self-contained against external spectral data.
Axiom & Free-Parameter Ledger
free parameters (1)
- column density scaling factors per species
axioms (1)
- domain assumption Laboratory ice analogs accurately represent the composition and optical properties of interstellar ices under protostellar envelope conditions
Reference graph
Works this paper leans on
-
[1]
Al-Halabi, A., Fraser, H. J., Kroes, G. J., & van Dishoeck, E. F. 2004, A&A, 422, 777, doi: 10.1051/0004-6361:20035939 Astropy Collaboration, Robitaille, T. P., Tollerud, E. J., et al. 2013, A&A, 558, A33, doi: 10.1051/0004-6361/201322068 Astropy Collaboration, Price-Whelan, A. M., Sip˝ocz, B. M., et al. 2018, AJ, 156, 123, doi: 10.3847/1538-3881/aabc4f A...
-
[2]
Boogert, A. C. A., Gerakines, P. A., & Whittet, D. C. B. 2015, ARA&A, 53, 541, doi: 10.1146/annurev-astro-082214-122348
work page internal anchor Pith review doi:10.1146/annurev-astro-082214-122348 2015
-
[3]
Boogert, A. C. A., Schutte, W. A., Tielens, A. G. G. M., et al. 1996, A&A, 315, L377
1996
-
[4]
Boogert, A. C. A., Pontoppidan, K. M., Knez, C., et al. 2008, ApJ, 678, 985, doi: 10.1086/533425
-
[5]
Borshcheva, K., Fedoseev, G., Punanova, A. F., et al. 2025, ApJ, 990, 163, doi: 10.3847/1538-4357/adea73
-
[6]
2015, MNRAS, 451, 2145, doi: 10.1093/mnras/stv1021
Bouilloud, M., Fray, N., B´enilan, Y., et al. 2015, MNRAS, 451, 2145, doi: 10.1093/mnras/stv1021
-
[7]
2007, A&A, 476, 995, doi: 10.1051/0004-6361:20078157
Bouwman, J., Ludwig, W., Awad, Z., et al. 2007, A&A, 476, 995, doi: 10.1051/0004-6361:20078157
-
[8]
Brunken, N. G. C., Rocha, W. R. M., van Dishoeck, E. F., et al. 2024a, A&A, 685, A27, doi: 10.1051/0004-6361/202348718
-
[9]
Brunken, N. G. C., van Dishoeck, E. F., Slavicinska, K., et al. 2024b, A&A, 692, A163, doi: 10.1051/0004-6361/202451794
-
[10]
doi:10.5281/zenodo.10870758 , abstract =
Bushouse, Howard, Eisenhamer, Jonathan, Dencheva, Nadia, et al. 2024, JWST Calibration Pipeline, 1.14.0, Zenodo, doi: 10.5281/zenodo.10870758 27
-
[11]
Caselli, P., Pineda, J. E., Sipil¨a, O., et al. 2022, ApJ, 929, 13, doi: 10.3847/1538-4357/ac5913
-
[12]
Chen, Y., Rocha, W. R. M., van Dishoeck, E. F., et al. 2024, A&A, 690, A205, doi: 10.1051/0004-6361/202450706
-
[13]
Chiar, J. E., Adamson, A. J., Kerr, T. H., & Whittet, D. C. B. 1995, ApJ, 455, 234, doi: 10.1086/176571
-
[14]
2024, A&A, 685, A75, doi: 10.1051/0004-6361/202346662
Chown, R., Sidhu, A., Peeters, E., et al. 2024, A&A, 685, A75, doi: 10.1051/0004-6361/202346662
-
[15]
Collings, M. P., Anderson, M. A., Chen, R., et al. 2004, MNRAS, 354, 1133, doi: 10.1111/j.1365-2966.2004.08272.x
-
[16]
2001, in AAS/Division for Planetary Sciences Meeting Abstracts# 33, Vol
Cottin, H., Lowenthal, M., Hudson, R., & Moore, M. 2001, in AAS/Division for Planetary Sciences Meeting Abstracts# 33, Vol. 33, 20–08
2001
-
[17]
M., Linnartz, H., & Ioppolo, S
Cuppen, H. M., Linnartz, H., & Ioppolo, S. 2024, ARA&A, 62, 243, doi: 10.1146/annurev-astro-071221-052732
-
[18]
A., Ysard, N., Demyk, K., & Chabot, M
Dartois, E., Noble, J. A., Ysard, N., Demyk, K., & Chabot, M. 2022, A&A, 666, A153, doi: 10.1051/0004-6361/202243929
-
[19]
Dartois, E., Noble, J. A., Caselli, P., et al. 2024, Nature Astronomy, 8, 359, doi: 10.1038/s41550-023-02155-x
-
[20]
2026, arXiv e-prints, arXiv:2603.19992, doi: 10.48550/arXiv.2603.19992
DeWitt, C., De Simone, M., Bianchi, E., et al. 2026, arXiv e-prints, arXiv:2603.19992, doi: 10.48550/arXiv.2603.19992
-
[21]
2021, OpTool: Command-line driven tool for creating complex dust opacities, Astrophysics Source Code Library, record ascl:2104.010
Dominik, C., Min, M., & Tazaki, R. 2021, OpTool: Command-line driven tool for creating complex dust opacities, Astrophysics Source Code Library, record ascl:2104.010. http://ascl.net/2104.010
2021
-
[22]
Dishoeck, E. F. 2015, MNRAS, 451, 3836, doi: 10.1093/mnras/stv1177
-
[23]
P., Juhasz, A., Pohl, A., et al
Dullemond, C. P., Juhasz, A., Pohl, A., et al. 2012, RADMC-3D: A multi-purpose radiative transfer tool, Astrophysics Source Code Library, record ascl:1202.015. http://ascl.net/1202.015
2012
-
[24]
Ehrenfreund, P., Boogert, A. C. A., Gerakines, P. A., Tielens, A. G. G. M., & van Dishoeck, E. F. 1997, A&A, 328, 649
1997
-
[25]
A., et al
Ehrenfreund, P., Kerkhof, O., Schutte, W. A., et al. 1999, A&A, 350, 240
1999
-
[26]
2002, Reports on Progress in Physics, 65, 1427, doi: 10.1088/0034-4885/65/10/202
Ehrenfreund, P., Irvine, W., Becker, L., et al. 2002, Reports on Progress in Physics, 65, 1427, doi: 10.1088/0034-4885/65/10/202
-
[27]
Fayolle, E. C., ¨Oberg, K. I., Cuppen, H. M., Visser, R., & Linnartz, H. 2011, A&A, 529, A74, doi: 10.1051/0004-6361/201016121
-
[28]
2016, MNRAS, 460, 4297, doi: 10.1093/mnras/stw1028
Linnartz, H. 2016, MNRAS, 460, 4297, doi: 10.1093/mnras/stw1028
-
[29]
Furlan, E., Fischer, W. J., Ali, B., et al. 2016, ApJS, 224, 5, doi: 10.3847/0067-0049/224/1/5
-
[30]
Gerakines, P. A., Materese, C. K., & Hudson, R. L. 2025, MNRAS, 537, 2918, doi: 10.1093/mnras/staf192
-
[31]
Gerakines, P. A., Yarnall, Y. Y., & Hudson, R. L. 2024, Icarus, 413, 116007, doi: https://doi.org/10.1016/j.icarus.2024.116007
-
[32]
Gibb, E. L., Whittet, D. C. B., Boogert, A. C. A., & Tielens, A. G. G. M. 2004, ApJS, 151, 35, doi: 10.1086/381182
-
[33]
Goto, M., Vasyunin, A. I., Giuliano, B. M., et al. 2021, A&A, 651, A53, doi: 10.1051/0004-6361/201936385
-
[34]
2025, arXiv e-prints, arXiv:2509.21763, doi: 10.48550/arXiv.2509.21763
Gramze, S., Ginsburg, A., Budaiev, N., et al. 2025, arXiv e-prints, arXiv:2509.21763, doi: 10.48550/arXiv.2509.21763
-
[35]
2016, Astronomy and Computing, 16, 41, doi: 10.1016/j.ascom.2016.04.001
Greenfield, P., & Miller, T. 2016, Astronomy and Computing, 16, 41, doi: 10.1016/j.ascom.2016.04.001 G¨ uver, T., &¨Ozel, F. 2009, MNRAS, 400, 2050, doi: 10.1111/j.1365-2966.2009.15598.x
-
[36]
1999, NewAR, 43, 1, doi: 10.1016/S1387-6473(99)00004-4
Hartmann, L. 1999, NewAR, 43, 1, doi: 10.1016/S1387-6473(99)00004-4
-
[37]
Herbst, E., & van Dishoeck, E. F. 2009, ARA&A, 47, 427, doi: 10.1146/annurev-astro-082708-101654
-
[38]
Huang, B., Girart, J. M., Stephens, I. W., et al. 2024, ApJL, 963, L31, doi: 10.3847/2041-8213/ad27d4
-
[39]
L., Gerakines, P
Hudson, R. L., Gerakines, P. A., & Yarnall, Y. Y. 2022, The Astrophysical Journal, 925, 156
2022
-
[40]
Hudson, R. L., Yarnall, Y. Y., & Gerakines, P. A. 2024a, The Astrophysical Journal, 977, 130, doi: 10.3847/1538-4357/ad8c43 —. 2024b, The Astrophysical Journal, 977, 130 Jim´enez-Serra, Izaskun, Meg´ıas, Andr´es, Salaris, Joseph, et al. 2025, A&A, 695, A247, doi: 10.1051/0004-6361/202452389
-
[41]
Zamozdra, S. N., & Zhilkin, A. G. 2022, Open Astronomy, 31, 172, doi: 10.1515/astro-2022-0022
-
[42]
2026a, A&A, 707, A293, doi: 10.1051/0004-6361/202558069 —
Vasyunin, A. 2026a, A&A, 707, A293, doi: 10.1051/0004-6361/202558069 —. 2026b, A&A, 706, L4, doi: 10.1051/0004-6361/202557939
-
[43]
Keane, J. V., Tielens, A. G. G. M., Boogert, A. C. A., Schutte, W. A., & Whittet, D. C. B. 2001, A&A, 376, 254, doi: 10.1051/0004-6361:20010936
-
[44]
2021, Astronomy & Astrophysics, 652, A29
Kruczkiewicz, F., Vitorino, J., Congiu, E., Theul´e, P., & Dulieu, F. 2021, Astronomy & Astrophysics, 652, A29
2021
-
[45]
2018, A&A, 617, A116, doi: 10.1051/0004-6361/201833463
Luna, Ram´on, Molpeceres, Germ´an, Ortigoso, Juan, et al. 2018, A&A, 617, A116, doi: 10.1051/0004-6361/201833463
-
[46]
Machida, M. N., & Hosokawa, T. 2013, Monthly Notices of the Royal Astronomical Society, 431, 1719, doi: 10.1093/mnras/stt291
-
[47]
Mathis, J. S., Rumpl, W., & Nordsieck, K. H. 1977, ApJ, 217, 425, doi: 10.1086/155591
-
[48]
2021, The Astrophysical Journal, 916, 23, doi: 10.3847/1538-4357/ac069f
Matsushita, Y., Takahashi, S., Ishii, S., et al. 2021, The Astrophysical Journal, 916, 23, doi: 10.3847/1538-4357/ac069f
-
[49]
McClure, M. K., Rocha, W. R. M., Pontoppidan, K. M., et al. 2023, Nature Astronomy, 7, 431, doi: 10.1038/s41550-022-01875-w
-
[50]
2022, ACS Earth and Space Chemistry, 6, 597 28
Minissale, M., Aikawa, Y., Bergin, E., et al. 2022, ACS Earth and Space Chemistry, 6, 597 28
2022
-
[51]
Moore, M. H., & Hudson, R. L. 1998, Icarus, 135, 518, doi: 10.1006/icar.1998.5996
-
[52]
2025, The Astrophysical Journal Letters, 978, L46, doi: 10.3847/2041-8213/ada290
Nakibov, R., Karteyeva, V., Petrashkevich, I., et al. 2025, The Astrophysical Journal Letters, 978, L46, doi: 10.3847/2041-8213/ada290
-
[53]
Novozamsky, J. H., Schutte, W. A., & Keane, J. V. 2001, A&A, 379, 588, doi: 10.1051/0004-6361:20011332 ¨Oberg, K. I., Fraser, H. J., Boogert, A. C. A., et al. 2007, A&A, 462, 1187, doi: 10.1051/0004-6361:20065881
-
[54]
2024, The Astrophysical Journal Letters, 972, L10, doi: 10.3847/2041-8213/ad6d5c
Ozhiganov, M., Medvedev, M., Karteyeva, V., et al. 2024, The Astrophysical Journal Letters, 972, L10, doi: 10.3847/2041-8213/ad6d5c
-
[55]
2024, A&A, 682, A53, doi: 10.1051/0004-6361/202347339
Patapis, Polychronis, Argyriou, Ioannis, Law, David R., et al. 2024, A&A, 682, A53, doi: 10.1051/0004-6361/202347339
-
[56]
Pavlyuchenkov, Y. N., Wiebe, D. S., Akimkin, V. V., Khramtsova, M. S., & Henning, T. 2012, MNRAS, 421, 2430, doi: 10.1111/j.1365-2966.2012.20480.x
-
[57]
2024, A&A, 685, A74, doi: 10.1051/0004-6361/202348244
Peeters, E., Habart, E., Bern´e, O., et al. 2024, A&A, 685, A74, doi: 10.1051/0004-6361/202348244
-
[58]
2013, ApJL, 777, L33, doi: 10.1088/2041-8205/777/2/L33
Polychroni, D., Schisano, E., Elia, D., et al. 2013, ApJL, 777, L33, doi: 10.1088/2041-8205/777/2/L33
-
[59]
Pontoppidan, K. M. 2006, A&A, 453, L47, doi: 10.1051/0004-6361:20065569
-
[60]
Pontoppidan, K. M., van Dishoeck, E. F., & Dartois, E. 2004, A&A, 426, 925, doi: 10.1051/0004-6361:20041276
-
[61]
2003, Chemical physics letters, 368, 594
Raunier, S., Chiavassa, T., Marinelli, F., Allouche, A., & Aycard, J. 2003, Chemical physics letters, 368, 594
2003
-
[62]
Rayalacheruvu, P., Majumdar, L., Rocha, W. R. M., et al. 2025, arXiv e-prints, arXiv:2506.15358, doi: 10.48550/arXiv.2506.15358
-
[63]
Rocha, W. R. M., Rachid, M. G., Olsthoorn, B., et al. 2022, A&A, 668, A63, doi: 10.1051/0004-6361/202244032
-
[64]
Rocha, W. R. M., van Dishoeck, E. F., Ressler, M. E., et al. 2024, A&A, 683, A124, doi: 10.1051/0004-6361/202348427
-
[65]
Rocha, W. R. M., McClure, M. K., Sturm, J. A., et al. 2025, A&A, 693, A288, doi: 10.1051/0004-6361/202451505
-
[66]
2003, Astronomy & Astrophysics, 398, 1049
Schutte, W., & Khanna, R. 2003, Astronomy & Astrophysics, 398, 1049
2003
-
[67]
Sheehan, P. D., Tobin, J. J., Looney, L. W., & Megeath, S. T. 2022, ApJ, 929, 76, doi: 10.3847/1538-4357/ac574d
-
[68]
Slavicinska, K., Boogert, A. C. A., Tychoniec, L., et al. 2025a, A&A, 693, A146, doi: 10.1051/0004-6361/202451383
-
[69]
Slavicinska, K., Tychoniec, L., Navarro, M. G., et al. 2025b, ApJL, 986, L19, doi: 10.3847/2041-8213/addb45
-
[70]
Slavicinska, K., Rachid, M. G., Rocha, W. R. M., et al. 2023, A&A, 677, A13, doi: 10.1051/0004-6361/202346996
-
[71]
Smith, Z. L., Dickinson, H. J., Fraser, H. J., et al. 2025, Nature Astronomy, 9, 883, doi: 10.1038/s41550-025-02511-z
-
[72]
Soille, P. 2003, Morphological Image Analysis: Principles and Applications (Berlin: Springer), doi: 10.1007/978-3-662-05088-0
-
[73]
Soker, N., Bublitz, J., & Kastner, J. H. 2022, ApJ, 928, 159, doi: 10.3847/1538-4357/ac5827
-
[74]
Sonnentrucker, P., Neufeld, D. A., Gerakines, P. A., et al. 2008, ApJ, 672, 361, doi: 10.1086/523790
-
[75]
Storey, J. W. V., Watson, D. M., & Townes, C. H. 1981, ApJL, 244, L27, doi: 10.1086/183472
-
[76]
2011, Astronomy & Astrophysics, 530, A96
Theule, P., Duvernay, F., Ilmane, A., et al. 2011, Astronomy & Astrophysics, 530, A96
2011
-
[77]
CORINOS V: Radiative transfer effects in protostellar ice observations
Thompson, W. E., Bergner, J. B., Evans, II, N. J., et al. 2026, arXiv e-prints, arXiv:2604.27133, doi: 10.48550/arXiv.2604.27133
work page internal anchor Pith review Pith/arXiv arXiv doi:10.48550/arxiv.2604.27133 2026
-
[78]
Tobin, J. J., Megeath, S. T., van’t Hoff, M., et al. 2019, ApJ, 886, 6, doi: 10.3847/1538-4357/ab498f
-
[79]
Tobin, J. J., Sheehan, P. D., Megeath, S. T., et al. 2020, ApJ, 890, 130, doi: 10.3847/1538-4357/ab6f64
-
[80]
2025, The Astrophysical Journal, 983, 110, doi: 10.3847/1538-4357/adb71f van Dishoeck, E
Tyagi, H., Manoj, P., Narang, M., et al. 2025, The Astrophysical Journal, 983, 110, doi: 10.3847/1538-4357/adb71f van Dishoeck, E. F., Tychoniec, L., Rocha, W. R. M., et al. 2025, A&A, 699, A361, doi: 10.1051/0004-6361/202554444 van Gelder, M. L., Ressler, M. E., van Dishoeck, E. F., et al. 2024, A&A, 682, A78, doi: 10.1051/0004-6361/202348118
discussion (0)
Sign in with ORCID, Apple, or X to comment. Anyone can read and Pith papers without signing in.