Seasonal Statistics of Shannon Capacity in a Dynamical Poisson-Voronoi Cellular Network
Pith reviewed 2026-05-19 21:06 UTC · model grok-4.3
The pith
In dynamical cellular networks with moving base stations, Shannon capacity fluctuates in recurring seasonal patterns based on signal and interference strengths at key events.
A machine-rendered reading of the paper's core claim, the machinery that carries it, and where it could break.
Core claim
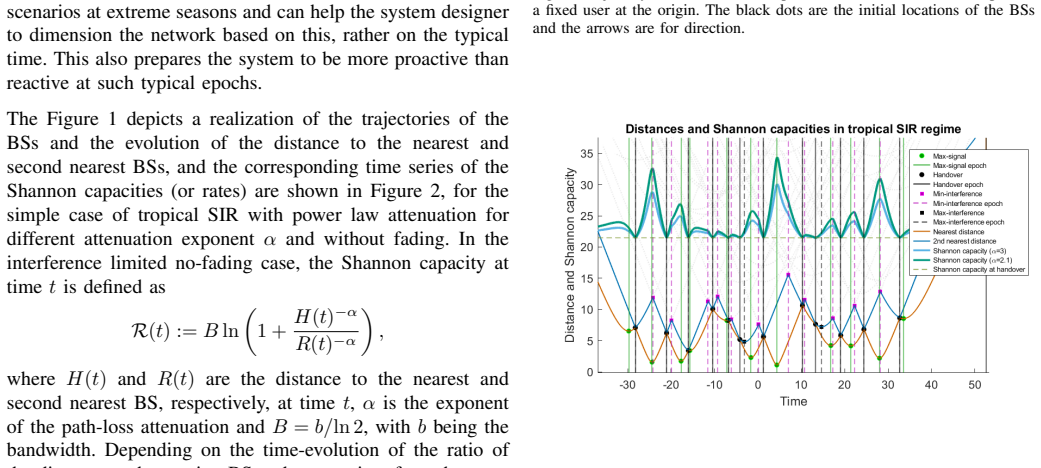
The Shannon capacity in this dynamical Poisson-Voronoi network shows distinct statistics at different event times, such as those inducing handovers or maximal proximity of the serving station, and at times of nearest or farthest nearest-interferer distance. These lead to recurring good or bad scenarios, with an analogy to seasons based on the fluctuations of signal and interference power, where strong or mild conditions correspond to different capacity seasons.
What carries the argument
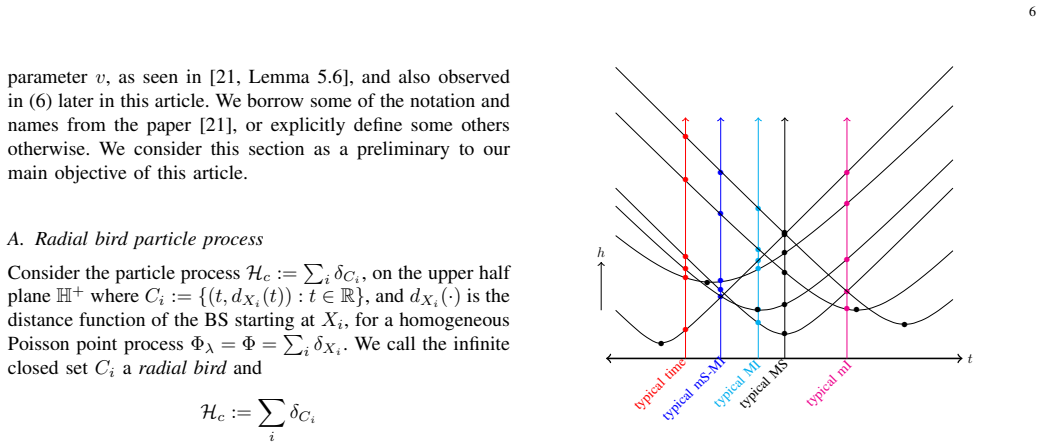
The time-dependent nearest-neighbor connection in an evolving Poisson-Voronoi tessellation generated by base stations moving at constant random velocities, used to evaluate capacity at specific event epochs.
If this is right
- Quality of service and capacity differ systematically between handover events and proximity extrema.
- Recurring good and bad capacity scenarios emerge from the periodic-like fluctuations in distances.
- Seasonal analogy allows grouping of epochs into categories based on signal and interference strength.
- Performance evaluation at typical time epochs provides a baseline for comparison with event-driven times.
Where Pith is reading between the lines
- This framework suggests that network operators could anticipate capacity variations by tracking base station positions over time.
- Similar seasonal effects might be observable in other mobile ad-hoc or sensor networks with random motion.
- Extensions could include incorporating user mobility or more complex velocity distributions to test robustness of the seasonal patterns.
Load-bearing premise
Base stations are distributed as a homogeneous Poisson point process and each moves independently at a constant speed in a uniformly random direction, while the user connects exclusively to the nearest base station at every moment.
What would settle it
A simulation or measurement where the Shannon capacity does not exhibit distinguishable recurring patterns or seasonal variations when sampled at handover times, maximal proximity times, or nearest-interferer extremal times.
Figures





read the original abstract
In this work we consider a dynamical cellular communication network in which mobile BSs are modeled as a homogeneous Poisson point process on $\mathbb R^2$. Each base station moves at a constant speed in a random direction. A typical user connects to the nearest base station and it experiences variable signal and interference powers depending on the distance of all the stations. Along the motion of the stations, the user swaps its serving station, and such an event is called a handover. We are interested in the performance evaluation of the system under some classical and tropical metrics of interest at different time of events, inducing handovers, maximal proximity of serving station, nearest interferer at closest or farthest distance with respect to the user or at any typical time epoch. A comparison study of quality of service and Shannon capacity at these epochs is also provided, among the recurrence of such ``good'' or ``bad'' scenarios. We can make an analogy with seasons based on the fluctuations of signal and interference power. Strong or mild signal or interference power correspond to different seasons of Shannon capacity along the evolution of the system.
Editorial analysis
A structured set of objections, weighed in public.
Referee Report
Summary. The manuscript models a cellular network with mobile base stations distributed as a homogeneous Poisson point process on the plane, each moving at constant speed in a uniformly random direction. A typical user connects to the nearest base station at every instant. The authors analyze the Shannon capacity and quality of service at specific epochs defined by geometric events: handover times, times of maximal proximity to the serving base station, times when the nearest interferer is closest or farthest, and arbitrary typical times. They compare these metrics across epochs and invoke the recurrence of 'good' or 'bad' scenarios to draw an analogy with seasons based on fluctuations in signal and interference power.
Significance. If the comparisons and recurrence properties are rigorously established, the work contributes to temporal analysis in stochastic-geometry models of mobile networks by linking geometric epochs to capacity variations. The seasonal analogy offers an intuitive lens for interpreting fluctuations, provided it is supported by interval statistics rather than isolated snapshots. The model setup (PPP with independent constant-velocity motions) is standard and allows well-defined nearest-BS processes.
major comments (2)
- [§4] §4 (Epoch-based capacity analysis): The central seasonal claim requires showing that the geometrically defined epochs delimit intervals whose lengths and capacity statistics differ systematically. The manuscript compares marginal Shannon-capacity distributions at handover instants, maximal-proximity times, and extremal-interferer distances, but does not derive Palm distributions or renewal-type results for inter-epoch times. Without these, the recurrence of good/bad scenarios reduces to a sequence of snapshot comparisons whose continuous-time interpretation remains heuristic.
- [§5.1] §5.1 (Numerical comparisons): The reported capacity values at the various epochs exhibit differences, yet the paper does not quantify sojourn-time distributions or provide confidence intervals on the frequency of recurrence. This leaves the seasonal analogy without direct statistical support for the claim that good or bad periods recur in a manner analogous to seasons.
minor comments (2)
- [Abstract] The abstract refers to 'tropical metrics' without definition; a brief clarification or reference in §2 would improve readability.
- [§2] Notation for the serving distance process and aggregate interference at a typical time t should be introduced once in §2 and used consistently thereafter to avoid ambiguity in the epoch definitions.
Simulated Author's Rebuttal
We thank the referee for the careful reading and constructive feedback on our manuscript. We address the major comments point by point below, indicating where we agree with the need for clarification and where we maintain the scope of our contribution.
read point-by-point responses
-
Referee: [§4] §4 (Epoch-based capacity analysis): The central seasonal claim requires showing that the geometrically defined epochs delimit intervals whose lengths and capacity statistics differ systematically. The manuscript compares marginal Shannon-capacity distributions at handover instants, maximal-proximity times, and extremal-interferer distances, but does not derive Palm distributions or renewal-type results for inter-epoch times. Without these, the recurrence of good/bad scenarios reduces to a sequence of snapshot comparisons whose continuous-time interpretation remains heuristic.
Authors: We appreciate the referee's observation that a complete continuous-time analysis would ideally include renewal-type results on inter-epoch intervals. Our contribution centers on the capacity statistics evaluated precisely at the geometrically defined epochs, which mark the transitions between regimes of signal and interference strength. The systematic differences observed in the marginal distributions at these epochs, combined with the stationarity and ergodicity of the underlying Poisson-Voronoi motion process, support the recurrence of good and bad scenarios. While deriving Palm distributions for the epochs would constitute a valuable extension, it is not required to establish the snapshot comparisons that underpin the seasonal analogy. In the revised manuscript we will add a clarifying paragraph in §4 that explicitly states the heuristic nature of the continuous-time interpretation in the absence of interval statistics and positions the analogy as an intuitive interpretation of the recurrent geometric events rather than a fully quantified seasonal model. revision: partial
-
Referee: [§5.1] §5.1 (Numerical comparisons): The reported capacity values at the various epochs exhibit differences, yet the paper does not quantify sojourn-time distributions or provide confidence intervals on the frequency of recurrence. This leaves the seasonal analogy without direct statistical support for the claim that good or bad periods recur in a manner analogous to seasons.
Authors: The numerical results in §5.1 are obtained from Monte Carlo simulations that demonstrate clear differences in Shannon capacity across the defined epochs. We agree that bootstrap confidence intervals would strengthen the presentation of these differences and will include them in the revised version. Full sojourn-time distributions are not derived because the focus remains on capacity at the event instants; however, average inter-epoch times can be estimated from the known intensity of the Poisson point process and the constant velocity, and we will add a short discussion of these estimates together with the confidence intervals to provide additional quantitative backing for the recurrence claim. revision: partial
Circularity Check
Derivation chain is self-contained with no identified circular reductions
full rationale
The paper defines epochs via independent geometric events (handovers, maximal proximity, extremal interferer distances) in a homogeneous PPP with constant-velocity motions. Capacity and QoS metrics are evaluated directly at these points using standard stochastic geometry tools. No equations or claims reduce a derived statistic to a fitted parameter or self-referential definition by construction. The seasonal analogy is presented as an interpretive description of fluctuations rather than a load-bearing mathematical result. The model assumptions (PPP, nearest-BS association, independent motions) are stated upfront and do not embed the target recurrence statistics. This is the common case of an honest non-finding.
Axiom & Free-Parameter Ledger
axioms (2)
- domain assumption Base stations form a homogeneous Poisson point process on R^2.
- domain assumption Each base station moves at constant speed in a random direction.
Lean theorems connected to this paper
-
IndisputableMonolith/Cost/FunctionalEquation.leanwashburn_uniqueness_aczel unclear?
unclearRelation between the paper passage and the cited Recognition theorem.
We are interested in the performance evaluation of the system under some classical and tropical metrics of interest at different time of events, inducing handovers, maximal proximity of serving station, nearest interferer at closest or farthest distance... We can make an analogy with seasons based on the fluctuations of signal and interference power.
-
IndisputableMonolith/Foundation/DimensionForcing.leanalexander_duality_circle_linking unclear?
unclearRelation between the paper passage and the cited Recognition theorem.
The non-periodicity of the seasons and their sequential but random appearance are also evident even in the simple tropical model without noise and fading
What do these tags mean?
- matches
- The paper's claim is directly supported by a theorem in the formal canon.
- supports
- The theorem supports part of the paper's argument, but the paper may add assumptions or extra steps.
- extends
- The paper goes beyond the formal theorem; the theorem is a base layer rather than the whole result.
- uses
- The paper appears to rely on the theorem as machinery.
- contradicts
- The paper's claim conflicts with a theorem or certificate in the canon.
- unclear
- Pith found a possible connection, but the passage is too broad, indirect, or ambiguous to say the theorem truly supports the claim.
Reference graph
Works this paper leans on
-
[1]
C. E. Shannon, “A Mathematical Theory of Communication,”Bell System Technical Journal, vol. 27, no. 3, pp. 379–423, 1948. [Online]. Available: https://onlinelibrary.wiley.com/doi/abs/10.1002/j.1538-7305. 1948.tb01338.x
-
[2]
A Tractable Approach to Coverage and Rate in Cellular Networks,
J. G. Andrews, F. Baccelli, and R. K. Ganti, “A Tractable Approach to Coverage and Rate in Cellular Networks,”IEEE Transactions on Communications, vol. 59, no. 11, pp. 3122–3134, 2011
work page 2011
-
[3]
A Primer on Cellular Network Analysis Using Stochastic Geometry
J. G. Andrews, A. K. Gupta, and H. S. Dhillon, “A Primer on Cellular Network Analysis Using Stochastic Geometry,”ArXiv, 2016. [Online]. Available: https://arxiv.org/abs/1604.03183
work page internal anchor Pith review Pith/arXiv arXiv 2016
-
[4]
Modeling and Analysis of K-Tier Downlink Heterogeneous Cellular Networks,
H. S. Dhillon, R. K. Ganti, F. Baccelli, and J. G. Andrews, “Modeling and Analysis of K-Tier Downlink Heterogeneous Cellular Networks,” IEEE Journal on Selected Areas in Communications, vol. 30, no. 3, pp. 550–560, 2012
work page 2012
-
[5]
H.-S. Jo, Y . J. Sang, P. Xia, and J. G. Andrews, “Heterogeneous Cellular Networks with Flexible Cell Association: A Comprehensive Down- link SINR Analysis,”IEEE Transactions on Wireless Communications, vol. 11, no. 10, pp. 3484–3495, 2012
work page 2012
-
[6]
H. ElSawy, E. Hossain, and M. Haenggi, “Stochastic Geometry for Modeling, Analysis, and Design of Multi-Tier and Cognitive Cellular Wireless Networks: A Survey,”IEEE Communications Surveys & Tuto- rials, vol. 15, no. 3, pp. 996–1019, 2013
work page 2013
-
[7]
Modeling and Analysis of Massive Low Earth Orbit Communication Networks,
N. Okati, “Modeling and Analysis of Massive Low Earth Orbit Communication Networks,”Ph.D. Thesis, Tempere University, 2023. [Online]. Available: https://trepo.tuni.fi/handle/10024/146346
work page 2023
-
[8]
N. Okati, T. Riihonen, D. Korpi, I. Angervuori, and R. Wichman, “Downlink Coverage and Rate Analysis of Low Earth Orbit Satellite Constellations Using Stochastic Geometry,”IEEE Transactions on Com- munications, vol. 68, no. 8, pp. 5120–5134, 2020
work page 2020
-
[9]
A Novel Analytical Model for LEO and MEO Satellite Networks Based on Cox Point Processes,
C.-S. Choi and F. Baccelli, “A Novel Analytical Model for LEO and MEO Satellite Networks Based on Cox Point Processes,”IEEE Transactions on Communications, vol. 73, pp. 2265–2279, 2022
work page 2022
-
[10]
Cox Point Processes for Multi Altitude LEO Satellite Networks,
——, “Cox Point Processes for Multi Altitude LEO Satellite Networks,” IEEE Transactions on Vehicular Technology, vol. 73, no. 10, pp. 15 916– 15 921, 2024
work page 2024
-
[11]
Stochastic geometry models of mobile com- munication networks,
F. Baccelli and S. Zuyev, “Stochastic geometry models of mobile com- munication networks,”Frontiers in Queueing: Models and Applications in Science and Engineering, ed. J. Dshalalow, CRC Press, 1996
work page 1996
-
[12]
Properties of random direction models,
P. Nain, D. Towsley, B. Liu, and Z. Liu, “Properties of random direction models,” inProceedings IEEE 24th Annual Joint Conference of the IEEE Computer and Communications Societies., vol. 3, 2005, pp. 1897–1907
work page 2005
-
[13]
Dynamic Random Geometric Graphs
D. Josep, M. Dieter, and P. Xavier, “Dynamic random geometric graphs,” arXiv preprint cs/0702074, 2007
work page internal anchor Pith review Pith/arXiv arXiv 2007
-
[14]
N. S. Ramesan and F. Baccelli, “How Wireless Queues Benefit from Motion: An Analysis of the Continuum Between Zero and Infinite Mobility,”IEEE Transactions on Wireless Communications, vol. 20, no. 12, pp. 8149–8162, 2021
work page 2021
-
[15]
Fundamentals of Mobility in Cellular Networks: Modeling and Analysis,
X. Lin, R. K. Ganti, P. J. Fleming, and J. G. Andrews, “Fundamentals of Mobility in Cellular Networks: Modeling and Analysis,” inProceedings of IEEE International Conference on Communications (ICC), 2012, pp. 5433–5437
work page 2012
-
[16]
Mobility and fading: Two sides of the same coin,
Z. Gong and M. Haenggi, “Mobility and fading: Two sides of the same coin,” in2010 IEEE Global Telecommunications Conference (GLOBECOM 2010). IEEE, 2010, pp. 1–5
work page 2010
-
[17]
Spatial and temporal correlation of the interference in ALOHA ad hoc networks,
R. K. Ganti and M. Haenggi, “Spatial and temporal correlation of the interference in ALOHA ad hoc networks,”IEEE Communications Letters, vol. 13, no. 9, pp. 631–633, 2009
work page 2009
-
[18]
Doppler- Shannon Association in Vehicular Networks: A Stochastic Geometry Analysis,
A. Balakrishnan, F. Baccelli, S. K. Jhawar, and P. Martins, “Doppler- Shannon Association in Vehicular Networks: A Stochastic Geometry Analysis,”HAL, 2026. [Online]. Available: https://hal.science/hal-055 97638/
work page 2026
-
[19]
Shared Rate Process for Mo- bile Users in Poisson Networks and Applications,
P. Madadi, F. Baccelli, and G. de Veciana, “Shared Rate Process for Mo- bile Users in Poisson Networks and Applications,”IEEE Transactions on Information Theory, vol. 64, no. 3, pp. 2121–2141, 2018
work page 2018
-
[20]
H. K. Armeniakos, A. G. Kanatas, and H. S. Dhillon, “Comprehensive Analysis of Maximum Power Association Policy for Cellular Networks Using Distance and Angular Coordinates,”IEEE Transactions on Wire- less Communications, vol. 23, no. 9, pp. 12 189–12 205, 2024
work page 2024
-
[21]
On a Class of Dynamical Poisson-Voronoi Tessellations
F. Baccelli and S. K. Jhawar, “On a Class of Dynamical Poisson-V oronoi Tessellations,”arXiv e-prints, p. arXiv:2511.15893, Nov. 2025
work page internal anchor Pith review Pith/arXiv arXiv 2025
-
[22]
Coordinated multipoint joint transmission in heterogeneous networks,
G. Nigam, P. Minero, and M. Haenggi, “Coordinated multipoint joint transmission in heterogeneous networks,”IEEE Transactions on Com- munications, vol. 62, no. 11, pp. 4134–4146, 2014
work page 2014
-
[23]
Some distributional results for poisson- voronoi tessellations,
V . Baumstark and G. Last, “Some distributional results for poisson- voronoi tessellations,”Advances in Applied Probability, vol. 39, no. 1, p. 16–40, 2007
work page 2007
-
[24]
J. F. C. Kingman,Poisson processes, ser. Oxford Studies in Probability. New York: The Clarendon Press Oxford University Press, 1993, vol. 3, oxford Science Publications
work page 1993
-
[25]
F. Baccelli and B. Blaszczyszyn,Stochastic Geometry and Wireless Networks, Volume II - Applications, ser. Foundations and Trends in Networking: V ol. 4: No 1-2, pp 1-312. NoW Publishers, 2009. [Online]. Available: https://inria.hal.science/inria-00403040
work page 2009
-
[26]
Interference in Large Wireless Networks,
M. Haenggi and R. K. Ganti, “Interference in Large Wireless Networks,” Foundations and Trends in Networking, vol. 3, no. 2, pp. 127–248, 11
-
[27]
Available: https://doi.org/10.1561/1300000015
[Online]. Available: https://doi.org/10.1561/1300000015
-
[28]
A Stochastic Geometry Framework for Analyzing Pairwise-Cooperative Cellular Networks,
A. Giovanidis and F. Baccelli, “A Stochastic Geometry Framework for Analyzing Pairwise-Cooperative Cellular Networks,”IEEE Transactions on Wireless Communications, vol. 14, p. 794–808, 2015
work page 2015
-
[29]
M. Shaked and J. G. Shanthikumar,“Stochastic Orders”, ser. Springer Series in Statistics. New York, NY: Springer, 2007
work page 2007
-
[30]
Capacity of MRC on Correlated Rician Fading Chan- nels,
K. A. Hamdi, “Capacity of MRC on Correlated Rician Fading Chan- nels,”IEEE Transactions on Communications, vol. 56, no. 5, pp. 708– 711, 2008
work page 2008
-
[31]
A Unified Asymptotic Analysis of Area Spectral Efficiency in Ultradense Cellular Networks,
A. AlAmmouri, J. G. Andrews, and F. Baccelli, “A Unified Asymptotic Analysis of Area Spectral Efficiency in Ultradense Cellular Networks,” IEEE Transactions on Information Theory, vol. 65, no. 2, pp. 1236– 1248, 2019
work page 2019
-
[32]
The Cauchy-Schlomilch transformation
T. Amdeberhan, M. L. Glasser, M. C. Jones, V . H. Moll, R. Posey, and D. Varela, “The Cauchy-Schl ¨omilch transformation,”arXiv e-prints, p. arXiv:1004.2445, Apr. 2010
work page internal anchor Pith review Pith/arXiv arXiv 2010
discussion (0)
Sign in with ORCID, Apple, or X to comment. Anyone can read and Pith papers without signing in.